catalogue
1, Definition of RFM analysis:
II. Assumptions of RFM analysis
4.3 score and assign R, F and M in groups
4.4 calculate the comprehensive score of RFM
Note: personal study notes - who says rookies can't analyze data? R language
1, Definition of RFM analysis:
RFM analysis refers to a customer segmentation method that subdivides customer value according to customer activity and transaction amount contribution. RFM analysis is mainly composed of three indicators: R (Recency), F (Frequency) and M(Monetary)
| index | explain | significance |
| R (proximity) | The interval from the customer's last transaction time to the current time | The larger the R, the longer the transaction takes place The smaller the R, the closer the customer has a transaction |
| F (Frequency) | Number of transactions of the customer in the recent period | The larger the F, the more frequent the customer transactions The smaller the F, the less the customer transactions |
| M (Monetary, quota) | The amount of the customer's transaction in the latest period of time | The larger the M, the higher the customer value The smaller the M, the lower the customer value |
According to the above three indicators, it is divided into 6, 8 and 11 models. The most common are 8:

II. Assumptions of RFM analysis
1. It is assumed that customers with recent trading behavior are more likely to have trading behavior again than customers without recent trading behavior.
2. It is assumed that customers with higher transaction frequency are more likely to have transaction behavior again than customers with lower transaction frequency.
3. It is assumed that customers with more total transaction amount in the past have more consumption enthusiasm than customers with less total transaction amount.
3, Steps of RFM analysis
RFM analysis, my understanding is to build indicators from three levels according to the user's behavior, score them respectively, then calculate the comprehensive score of RFM, finally classify customers, and finally adopt different marketing methods for different customers to achieve the purpose of retaining high-value customers, developing key development customers and mining potential customers.
Therefore, RFM analysis can be divided into the following five steps:
1. Data preparation
2. Calculate R, F and M
3. Score and assign R, F and M in groups
4. Calculate the comprehensive score of RFM
5. Customer classification
4, RMF analysis example
4.1 data preparation
data = read.csv('C:/Users/ABC/Desktop/Book source code and supporting resources/Who says rookies can't analyze data( R Language)--data/Chapter V/5.7 RFM analysis/RFM analysis.csv',
                fileEncoding="utf8",
                stringsAsFactors=FALSE)
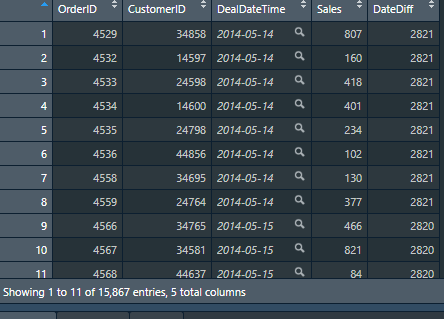
The first column of data is OrderID, the second column is CustomerID, the third column is dealdattime, and the fourth column is sales
Since the transaction date is not conducive to the comparison between data, we need to calculate the days between the transaction date and the current date according to the transaction date, which is mainly divided into the following four steps:
1. Process date as time type
2. Subtract the current date from the transaction date to get the time difference between the transaction date and the current date
3. Use as The numeric function sets the time
The difference is converted to a number in days
4. Use the floor function to round down the data to get the number of days.
#1. Data preparation

#Process time as time type
data$DealDateTime = strptime(data$DealDateTime, format ='%Y-%m-%d')
#Calculate the time difference between the transaction date and the current date
data$DateDiff = Sys.time() - data$DealDateTime
#Get days based on time difference
data$DateDiff = floor(as.numeric(data$DateDiff, units = "days"))
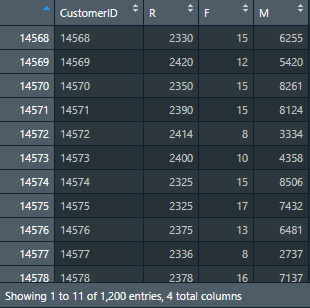
4.2 calculation of R/F/M
R: CustomerID is used as the grouping column, Days between the latest transaction date and the current date is used as the statistical column, and min is used as the statistical function
F: use CustomerID as the grouping column, OrderID as the statistical column, and the counting function length as the statistical function
M: CustomerID is used as the grouping column, Sales is used as the statistical column, and sum function is used as the statistical function
As follows:
#2. Calculate R, F and M
#Count the number of days between the latest transaction date of each customer and the current date, that is, find out the nearest consumption distance
R = tapply(data$DateDiff, data$CustomerID, min)
#Count the total number of transactions of each customer, that is, count the orders
F = tapply(data$OrderID, data$CustomerID, length)
#Count the total amount of each customer's transaction, that is, sum the amount of each transaction
M = tapply(data$Sales, data$CustomerID, sum)
#View variables
View(R)
View(F)
View(M)
#Merge R, F, M into one data frame
#Use row The names function gets the index of the R vector to generate the CustomerID column
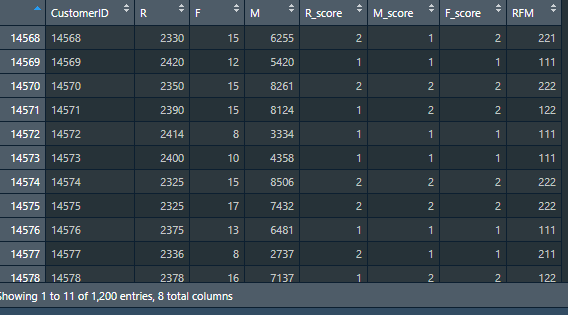
RFMData = data.frame('CustomerID' = row.names(R), 'R' = R, 'F' = F, 'M' = M)
4.3 score and assign R, F and M in groups
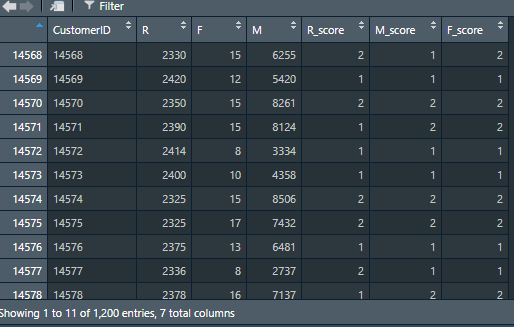
If there is no special grouping standard, it is usually divided into two groups according to the average value and assigned 1 and 2 respectively
| definition | explain | Value | explain |
| R_score | Proximity score: the closer the last transaction date is to the specified date, R_ The larger the score | 2 | R < = average |
| 1 | R> = average | ||
| F_score | Frequency score: the higher the transaction frequency, f_ The larger the score | 2 | F> = average |
| 1 | F < = average | ||
| M_score | The higher the limit score, the higher the transaction amount, M_ The larger the score | 2 | M> = average |
| 1 | M < = average |
#3. Merge R, F and M into one data frame
#Judge whether column R is greater than or equal to its own average value, and assign the qualified position as 1, otherwise assign it as 2
RFMData$R_score = ifelse(RFMData$R >= mean(RFMData$R), 1, 2)
#The assignment method is the same as above, for F_score,M_score is assigned, but opposite to R
RFMData$F_score = ifelse(RFMData$F >= mean(RFMData$F), 2, 1)
RFMData$M_score = ifelse(RFMData$M >= mean(RFMData$M), 2, 1)
4.4 calculate the comprehensive score of RFM
After getting R_score,F_score,M_ After the grouping score of score, the RFM comprehensive score can be calculated. The calculation formula of RFM comprehensive score is
RFM = 100×R_score + 10×F_score + 1×M_score
The reason for this setting is to construct an RFM score with a combination of 100 bits.
#4. Calculate the comprehensive score of RFM
RFMData$RFM = 100*RFMData$R_score + 10*RFMData$F_score + 1*RFMData$M_score
4.5 customer classification
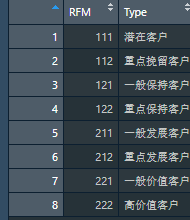
This example realizes customer classification by matching and merging with the RFM comprehensive score and the corresponding relationship table of customer type.
Firstly, the correspondence between the comprehensive score of each RFM and the customer type is defined as a data frame. Then, using the inner connection method of the merge function, the corresponding relationship table between the RFMData data frame and the RFM comprehensive score and customer type defined by the port is matched and combined into a data frame according to the RFM of the amount name of the management case, so as to complete the operation of customer classification.
#5. Customer classification
#Define the correspondence table between RFM comprehensive score and customer type
CustomerType = data.frame(
  'RFM' = c(111, 112, 121, 122, 211, 212, 221, 222),
  'Type' = c('Potential customers', 'Focus on retaining customers', 'General customer retention','Focus on maintaining customers', 'General development customers', 'Key development customers', 'General value customers', 'High value customers')
)
#Merge the correspondence table between RFMData and RFM comprehensive scores and customer types into one data frame
RFMData = merge(RFMData, CustomerType)

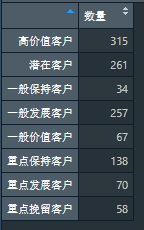
Finally, count the number of customers of each type
#Group by Type and count the number of customers of each Type
count = tapply(RFMData$CustomerID, RFMData$Type, length)
View(count)
CustomerTypeSum = data.frame('quantity' = count)
View(CustomerTypeSum)