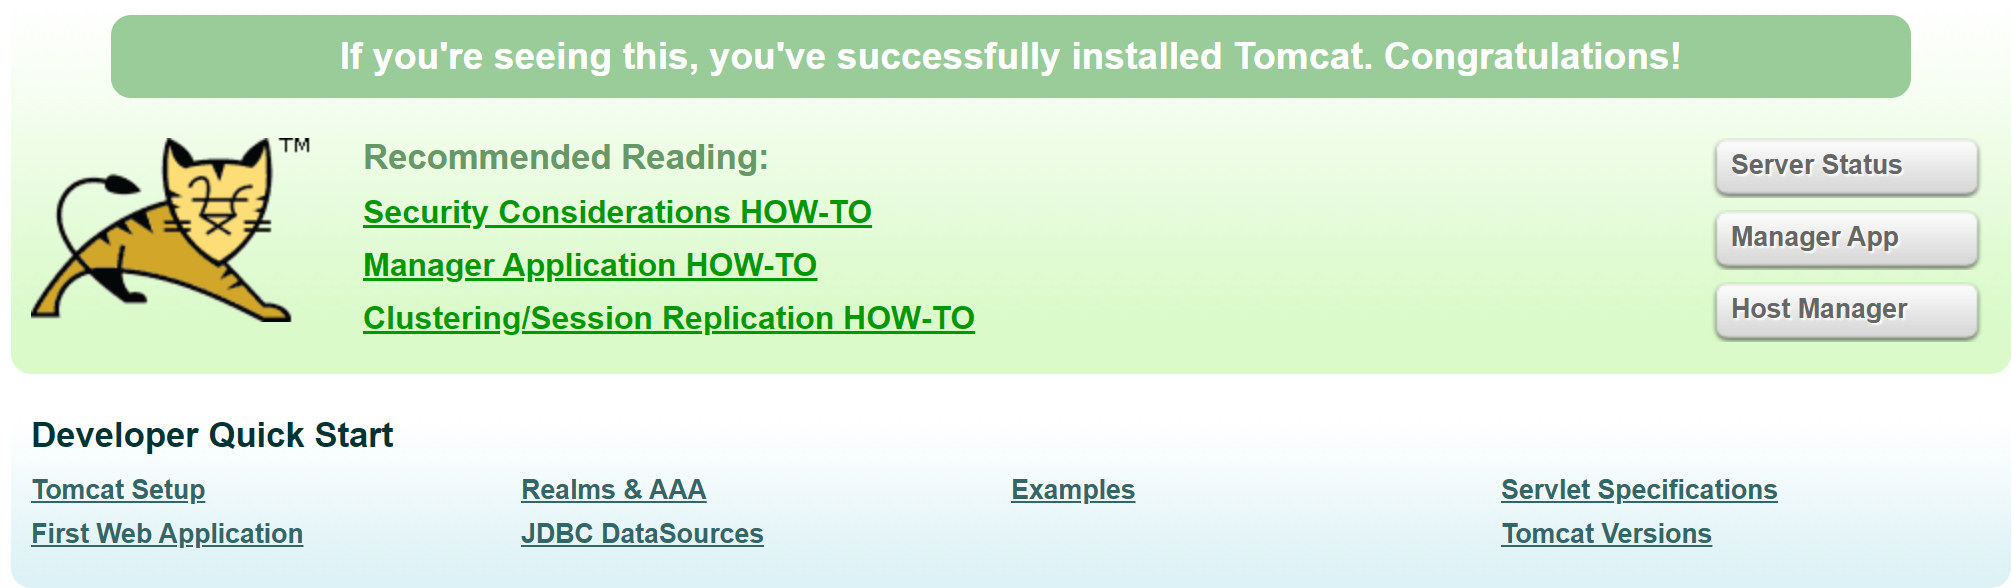
Open Tomcat management interface
Modify Tomcat \ conf \ Tomcat users XML add user
<role rolename="manager"/>
<role rolename="manager-gui"/>
<role rolename="admin"/>
<role rolename="admin-gui"/>
<user username="tomcat" password="tomcat" roles="admin-gui,admin,manager-gui,manager"/>
Note: Tomcat9 also needs to modify Tomcat \ webapps \ manager \ meta-inf \ context XML, annotation value tag content
<Context antiResourceLocking="false" privileged="true" >
  <Valve className="org.apache.catalina.valves.RemoteAddrValve"
         allow="127\.\d+\.\d+\.\d+|::1|0:0:0:0:0:0:0:1" />
  <Manager sessionAttributeValueClassNameFilter="java\.lang\.(?:Boolean|Integer|Long|Number|String)|org\.apache\.catalina\.filters\.CsrfPreventionFilter\$LruCache(?:\$1)?|java\.util\.(?:Linked)?HashMap"/>
</Context>
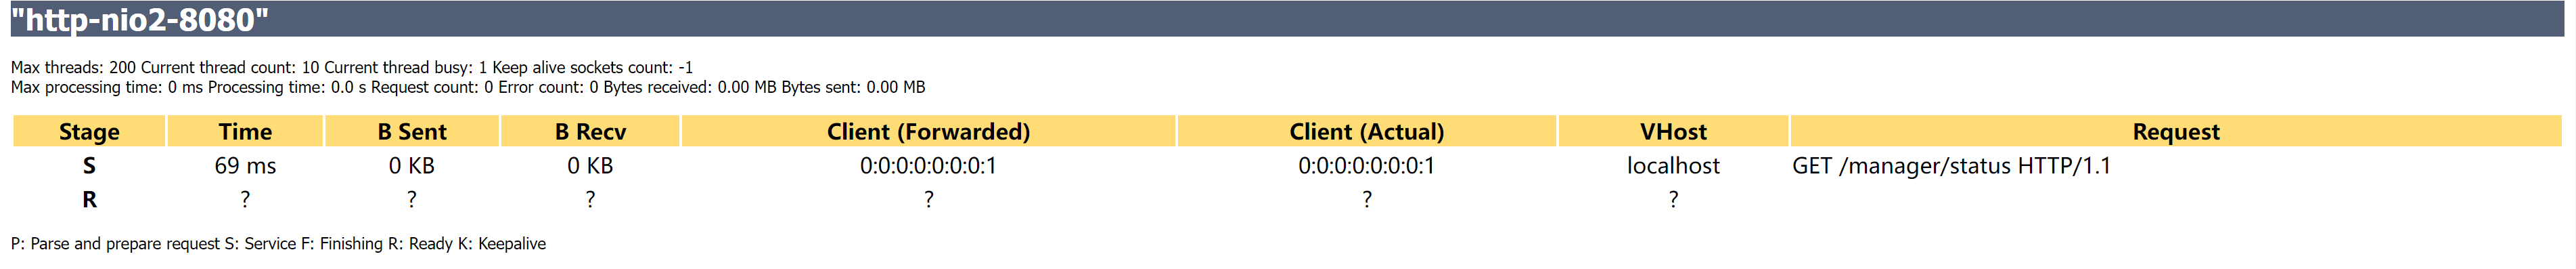
Start Tomcat to access Server Status, and enter the configured user name and password to log in
Disable AJP protocol
AJP (Apache JServer Protocol) AJPv13 protocol is package oriented. WEB server and servlet container interact through TCP connection; In order to save the expensive cost of SOCKET creation, the WEB server will try to maintain a permanent TCP connection to the servlet container and reuse the connection during multiple request and response cycles.
AJP protocol is implemented in tomcat8 Before 5.51, it is enabled by default, and subsequent versions are disabled

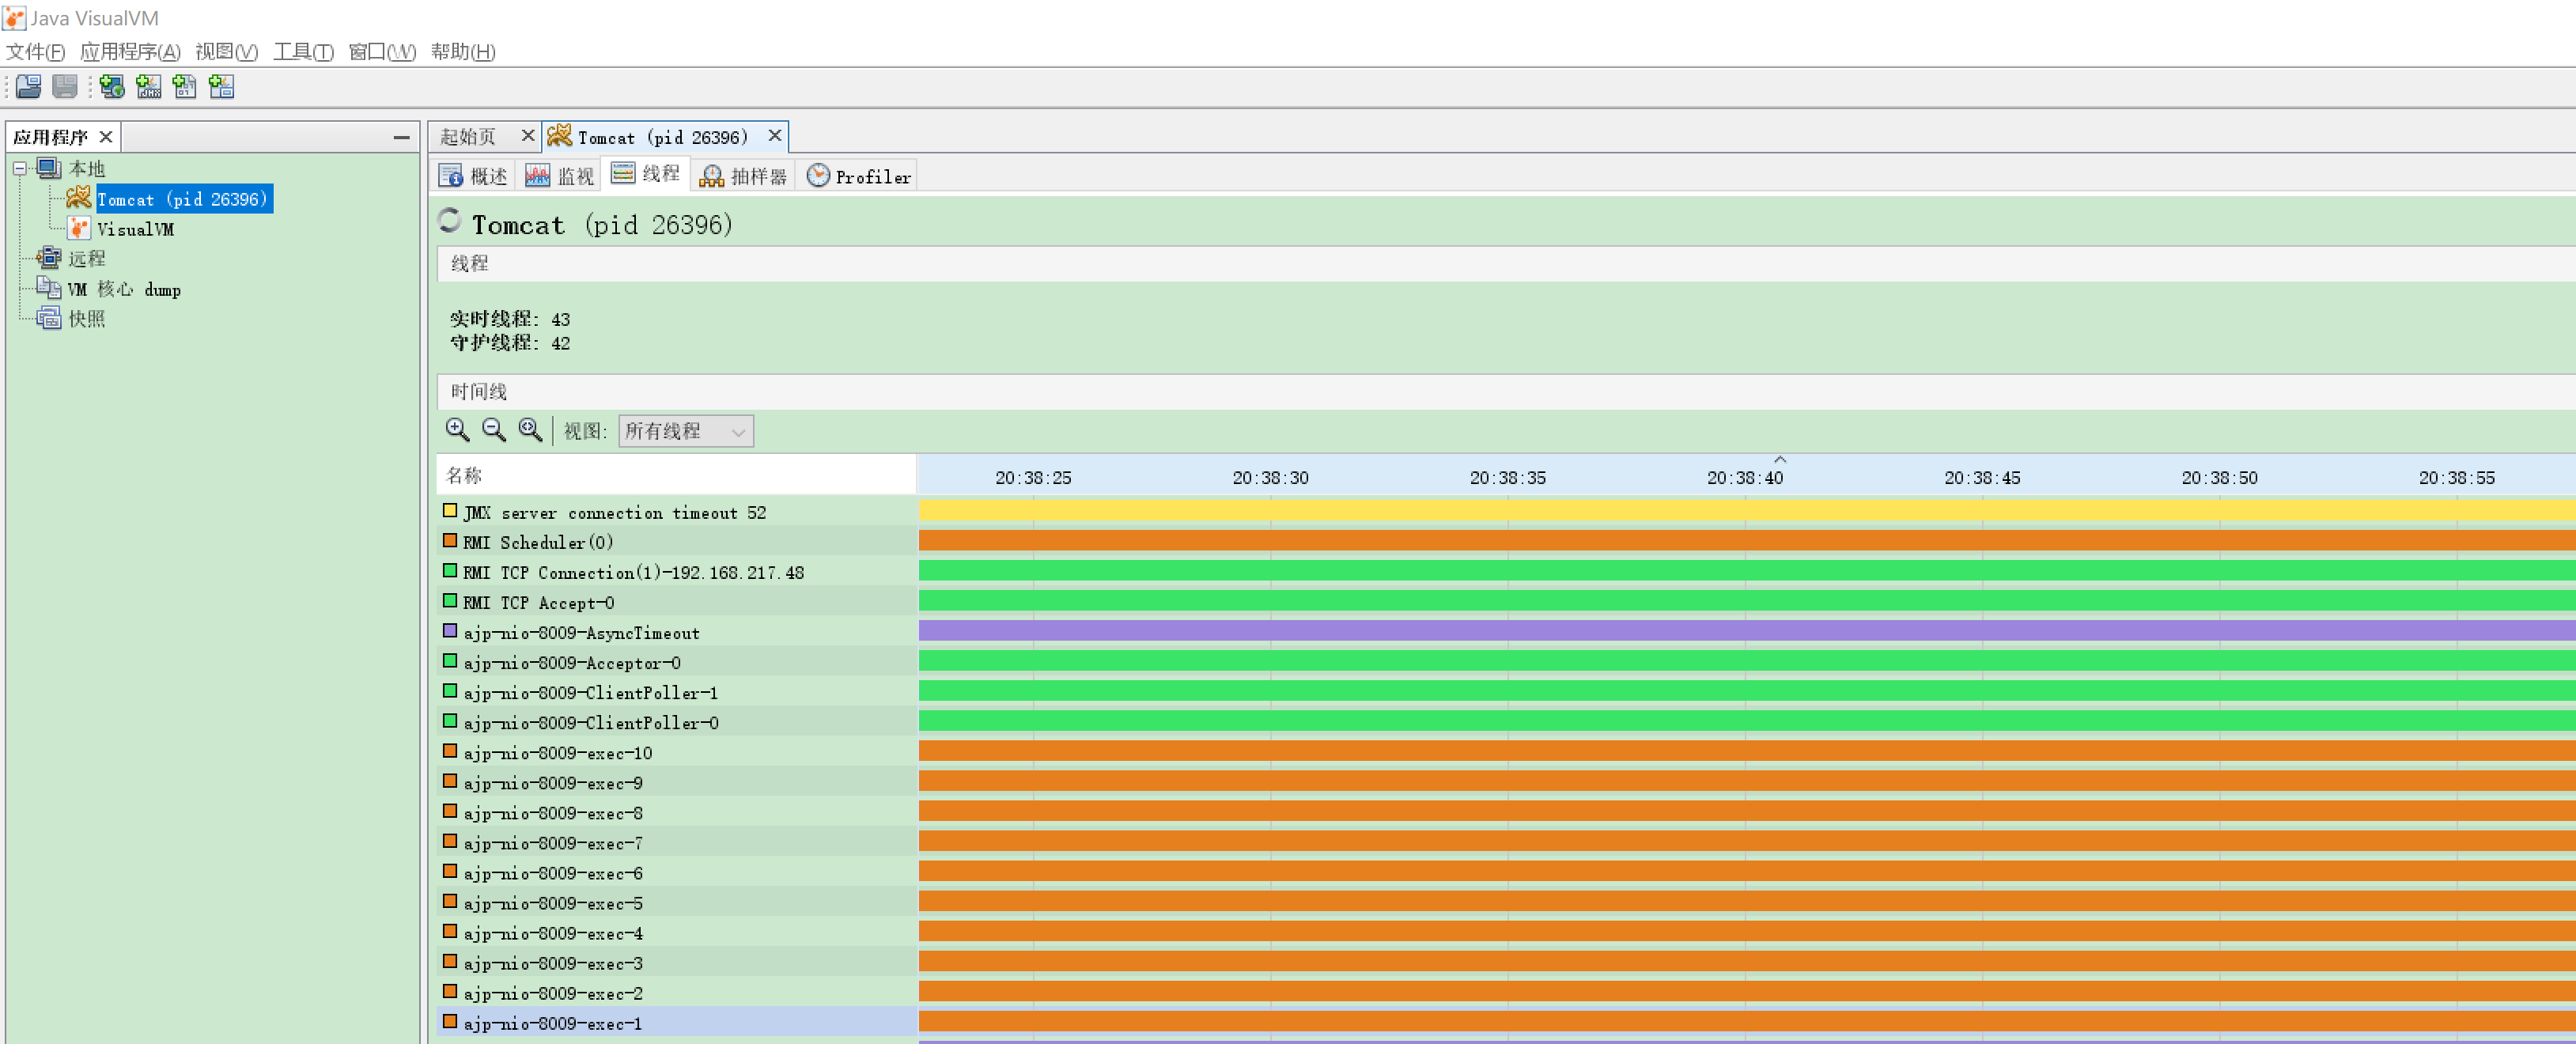
At present, the enterprise level mainly uses the architecture of Nginx+tomcat and does not need the AJP protocol, so the AJP connector can be disabled, otherwise it will occupy corresponding resources. You can use the JDK built-in tool jvisualvm to view the AJP thread resource occupation.
Modify conf / server XML, disable AJP service
<!-- <Connector port="8009" protocol="AJP/1.3" redirectPort="8443" /> -->
Enable thread pool
In Tomcat, every user request is a thread, so you can use thread pool to improve performance.
Modify conf / server XML, open the executor comment, and the Connector uses the executor attribute to point to the executor
  <!--When the comment is not opened, there are 10 threads by default, with a minimum of 10 and a maximum of 200-->
    <!-- <Executor name="tomcatThreadPool" namePrefix="catalina-exec-"
        maxThreads="150" minSpareThreads="4"/>  -->

    <Executor name="tomcatThreadPool" namePrefix="catalina-exec-"
        maxThreads="300" minSpareThreads="20"/>

    <!-- <Connector port="8080" protocol="HTTP/1.1"
               connectionTimeout="20000"
               redirectPort="8443" /> -->

    <!-- A "Connector" using the shared thread pool-->

    <Connector executor="tomcatThreadPool"
               port="8080" protocol="HTTP/1.1"
               connectionTimeout="20000"
               redirectPort="8443" />
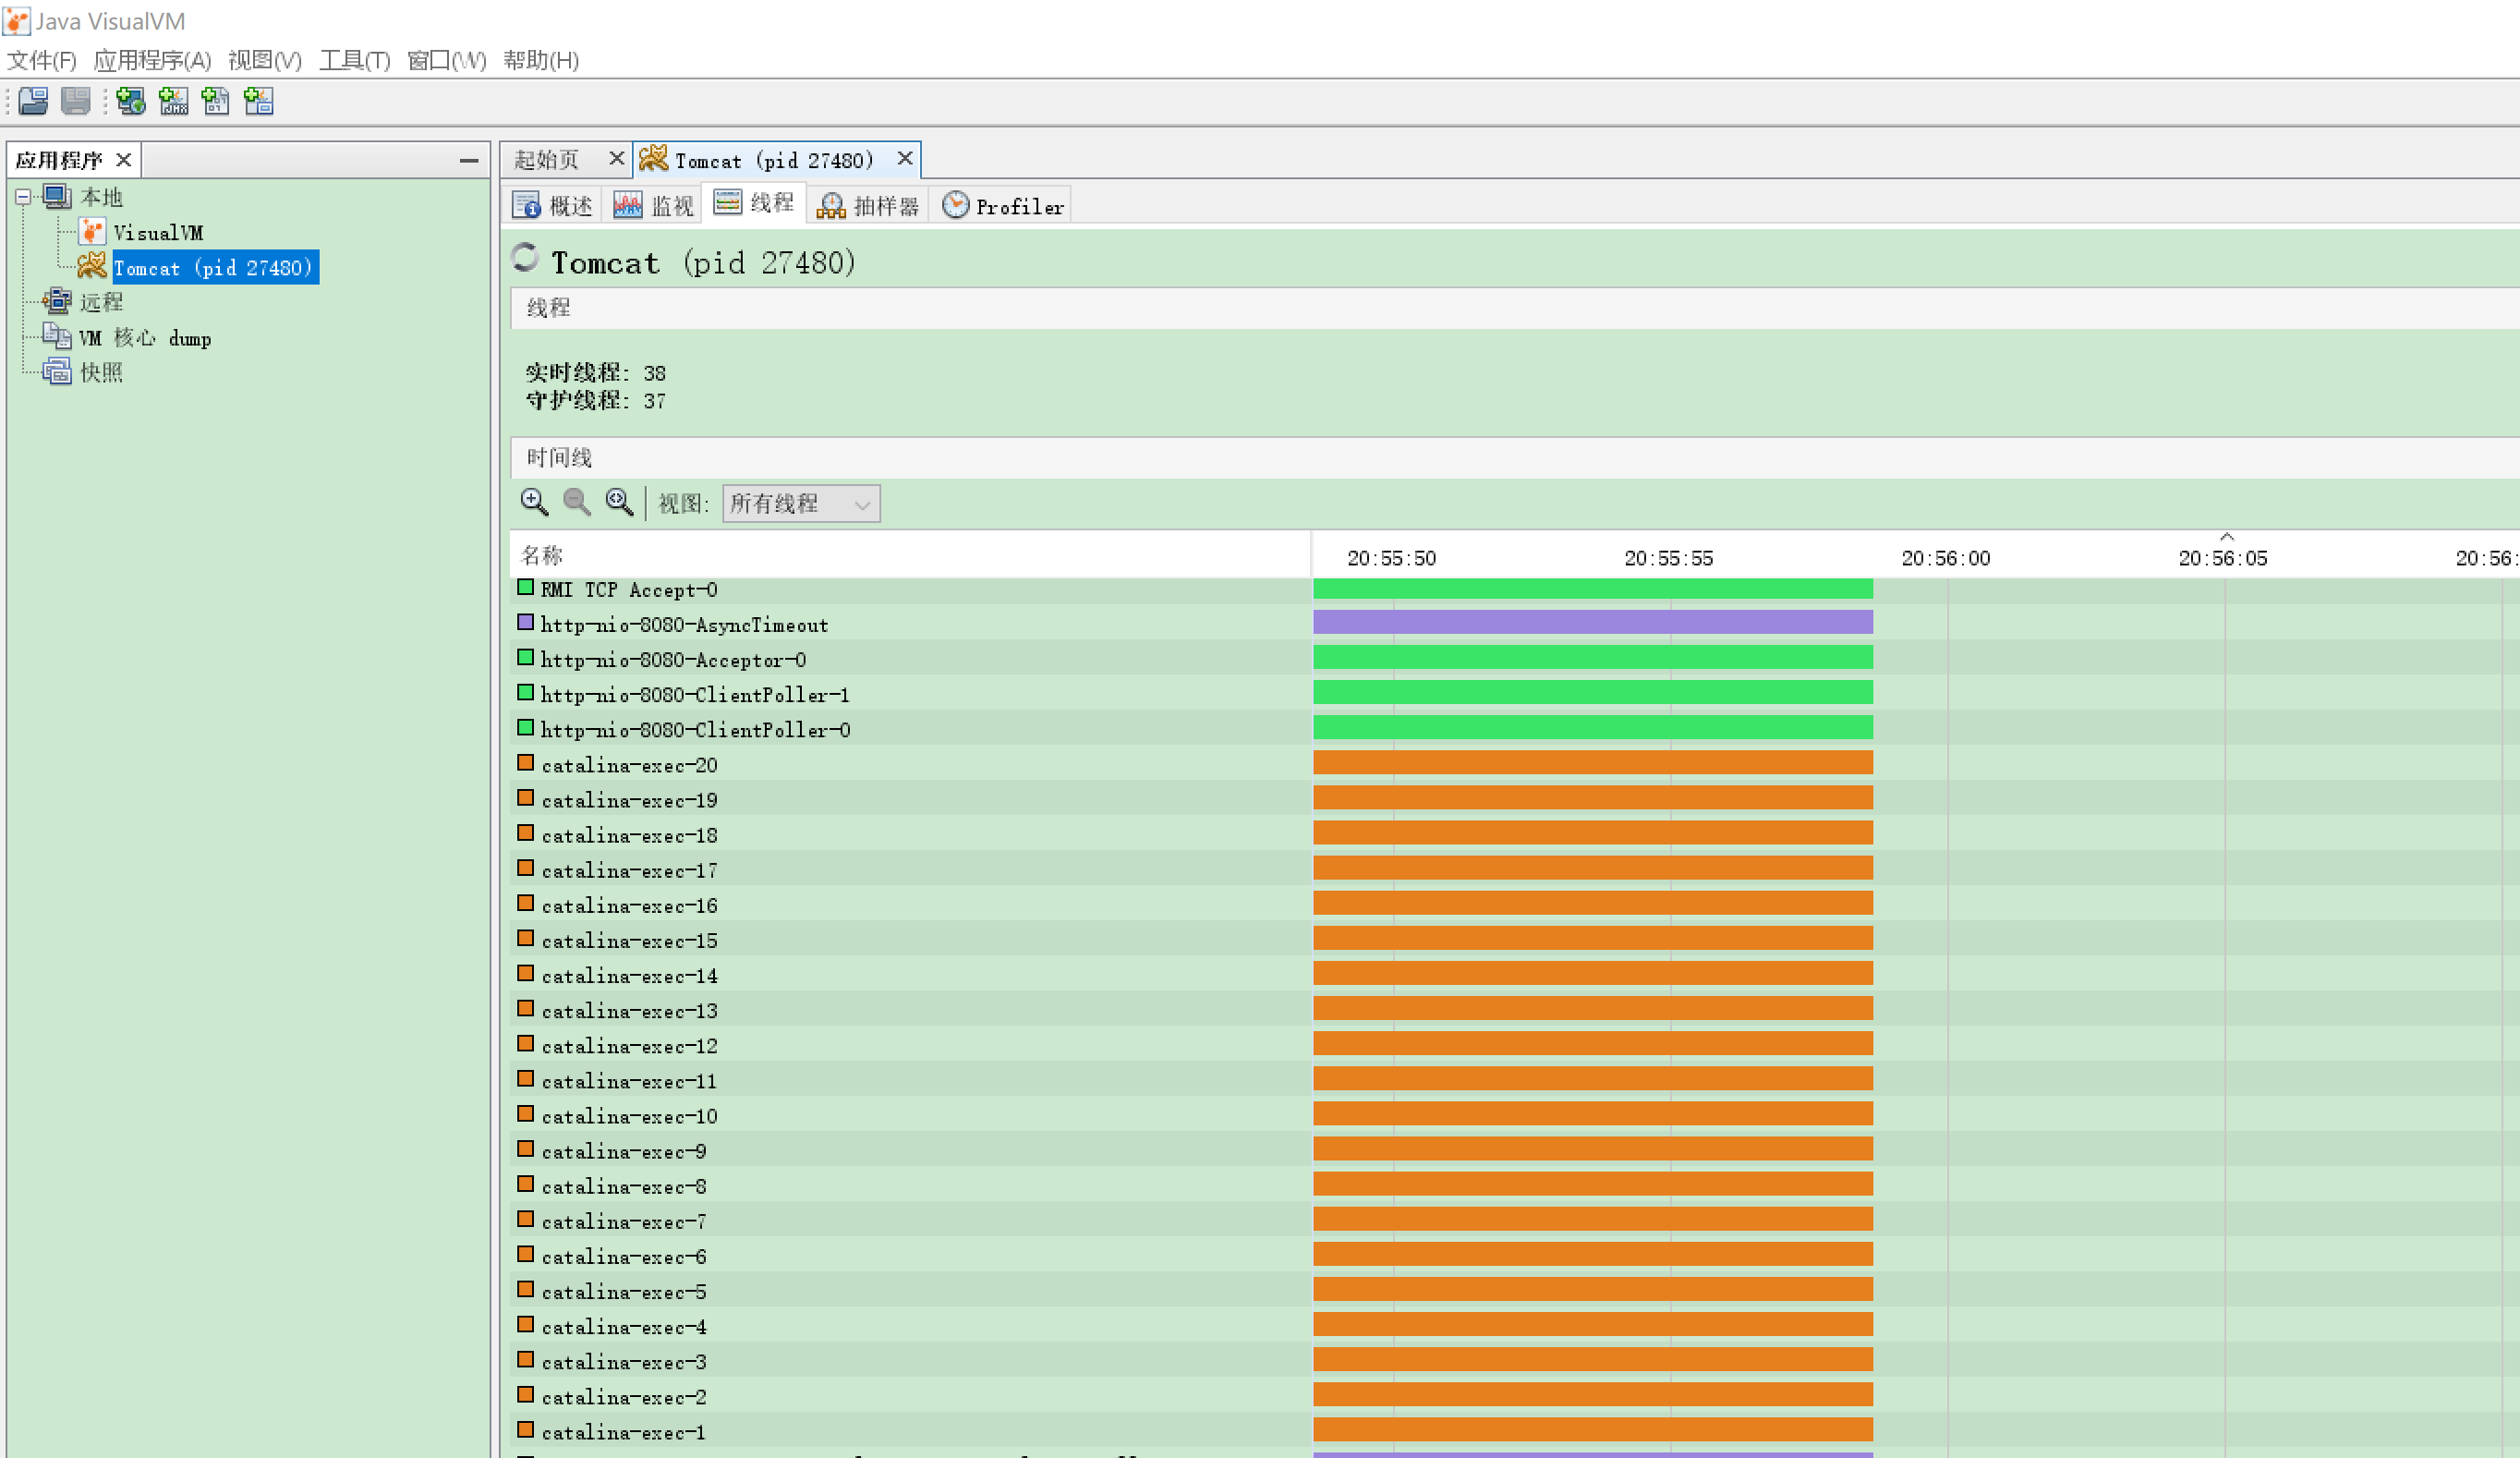
name:  Actuator name

maxThreads: The maximum concurrent number is 200 by default, and 500 is generally recommended ~ 1000,It needs to be combined with hardware pressure measurement configuration

namePrefix: Specifies the thread prefix name

minSpareThreads: Number of threads created during initialization
Using the jvisualvm tool to view
Modify operation mode
Tomcat has four operating modes
BIO: tradition Java I/O Operation, synchronous and blocked IO

NIO: Synchronous blocking or synchronous non blocking IO

AIO/NIO2: Asynchronous non blocking IO

APR: Tomcat with JNI Formal call Apache HTTP The core of the server is the dynamic link library to deal with file reading or network transmission operations, so as to greatly improve the efficiency Tomcat Processing performance of static files.
BIO has low performance and has not been optimized. Tomcat8 5. BIO mode has been abandoned at the beginning, and NIO mode is the default.

NIO is a buffer based and non blocking I/O operation. It has better concurrent performance than traditional I/O operation (BIO).
The essence of NIO2 asynchrony is that the process of data from kernel state to user state is asynchronous and divisible.
In NIO, this process must be completed before the next request can be executed, while NIO2 can execute the next request without waiting for this process to be completed. Therefore, NIO2 has higher performance than NIO.
Set NIO2 mode
    <!-- <Connector port="8080" protocol="HTTP/1.1"
               connectionTimeout="20000"
               redirectPort="8443" /> -->

        <Connector port="8080" protocol="org.apache.coyote.http11.Http11Nio2Protocol"
               connectionTimeout="20000"
               redirectPort="8443" />
APR solves the asynchronous IO problem from the operating system level and greatly improves the performance.
The start-up of APR mode is complex, and additional relevant software needs to be installed (gcc, Expat devel, perl-5, APR, APR util, openssl, Tomcat native, etc.).
Modify Catalina SH script file to enable tomcat to support apr configuration and apr library file
# Register custom URL handlers
# Do this here so custom URL handles (specifically 'war:...') can be used in the security policy
JAVA_OPTS="$JAVA_OPTS -Djava.protocol.handler.pkgs=org.apache.catalina.webresources"
# Point to lib directory of apr installation
JAVA_OPTS="$JAVA_OPTS -Djava.library.path=/usr/local/apr/lib"

# Set juli LogManager config file if it is present and an override has not been issued
Set APR mode
  <Connector port="8080" protocol="org.apache.coyote.http11.Http11AprProtocol"
               connectionTimeout="20000"
               redirectPort="8443" />

Adjust Tomcat related JVM parameters
Modify Catalina SH script
Set up serial garbage collector
Both the younger and older generations use serial collectors with an initial heap memory of 64 M,Maximum heap memory 512 M,Print gc Timestamp and other information, generated gc log file
JAVA_OPTS="-XX:+UseSerialGC -Xms64m -Xmx512m -XX:+PrintGCDetails -XX:+PrintGCTimeStamps -XX: +PrintGCDateStamps -XX:+PrintHeapAtGC -Xloggc:../logs/gc.log"
Set up parallel garbage collector
Both the younger and older generations use parallel garbage collectors with an initial heap memory of 64 M,Maximum heap memory 512 M,Print gc Timestamp and other information, generated gc log file
#JAVA_OPTS="-XX:+UseParallelGC -XX:+UseParallelOldGC -Xms64m -Xmx512m -XX:+PrintGCDetails -XX :+PrintGCTimeStamps -XX:+PrintGCDateStamps -XX:+PrintHeapAtGC -Xloggc:../logs/gc.log"
GC log analysis and comparison
visit https://gceasy.io/ Conduct online analysis of GC logs and upload them to GC Log for comparative analysis
Conclusion: the average execution time of parallel garbage collector is reduced, the throughput is increased, the exception rate is reduced, and the overall performance is improved
Resize younger generation
Both the younger generation and the older generation use parallel garbage collectors to increase the initial heap memory and the maximum heap memory, which are set to 128 respectively m And 1024 m,Print gc Timestamp and other information, generated gc log file
JAVA_OPTS="-XX:+UseParallelGC -XX:+UseParallelOldGC -Xms128m -Xmx1024m -XX:NewSize=64m -XX:M axNewSize=256m -XX:+PrintGCDetails -XX:+PrintGCTimeStamps -XX:+PrintGCDateStamps -XX:+PrintHe apAtGC -Xloggc:../logs/gc.log"
Upload GC Log analysis and conclusion: the performance has been improved again
Set G1 garbage collector (default G1 after Jdk9)
It is used by both young and old generations G1 Garbage collector, initial heap memory 128 M,Maximum heap memory 1024 M,Print gc Timestamp and other information, generated gc log file
JAVA_OPTS="-XX:+UseG1GC -Xms128m -Xmx1024m -XX:+PrintGCDetails -XX:+PrintGCTimeStamps -XX:+Pr intGCDateStamps -XX:+PrintHeapAtGC -Xloggc:../logs/gc.log"
Upload GC Log analysis and conclusion: the overall performance has been improved again
Compression property settings
Compression related attributes in http response header
1. Transmission content coding: content encoding
Content coding: how to encode the data on the server side, and then how to reverse process the data on the client side to get the original content

Content coding mainly refers to compression coding, that is, server-side compression and client-side decompression. Reference value: gzip,compress,deflate and identity

The usual compression method is gzip Format, when selected gzip When the whole html The text will be processed once gzip Compression of format
2. Transmission data coding: transfer encoding
Data coding refers to how to ensure the safe and successful transmission and processing of data during network transmission.

It can be segmented transmission or non segmented, and the original data can be directly used for transmission. Valid values are: chunked and Identity
3. Transmission content format: content type
Content format, in which form the received data is finally displayed in the browser

Additional support for optional parameters charset,That is, the character set of the actual content. Through the character set, the client can decode the data to finally display the understandable text
sendfile
sendfile is an optimization technology in linux system. It is used to reduce user state space and switch data with disk when sending files and network communication, and directly copy data at the kernel level.
Tomcat has different implementations and configurations based on different channels, but they are actually system calls of SendFile of the underlying operating system.
The useSendfile property is on by default in the NIO channel.
compression property settings
usesendfile and compression properties must be set at the same time and mutually exclusive
<Connector port="8080" protocol="HTTP/1.1"
               connectionTimeout="20000"
               redirectPort="8443"
			   usesendfile="false"
			   compression="on"
			   />
Remote jmx monitoring Tomcat
Configure Catalina sh
CATALINA_OPTS="$CATALINA_OPTS -Dcom.sun.management.jmxremote -Djava.rmi.server.hostname=112.74.X.X -Dcom.sun.management.jmxremote.port=9999 -Dcom.sun.management.jmxremote.rmi.port=9999 -Dcom.sun.management.jmxremote.ssl=false -Dcom.sun.management.jmxremote.authenticate=false"
JMeter pressure test
JMeter is an open source performance testing tool.
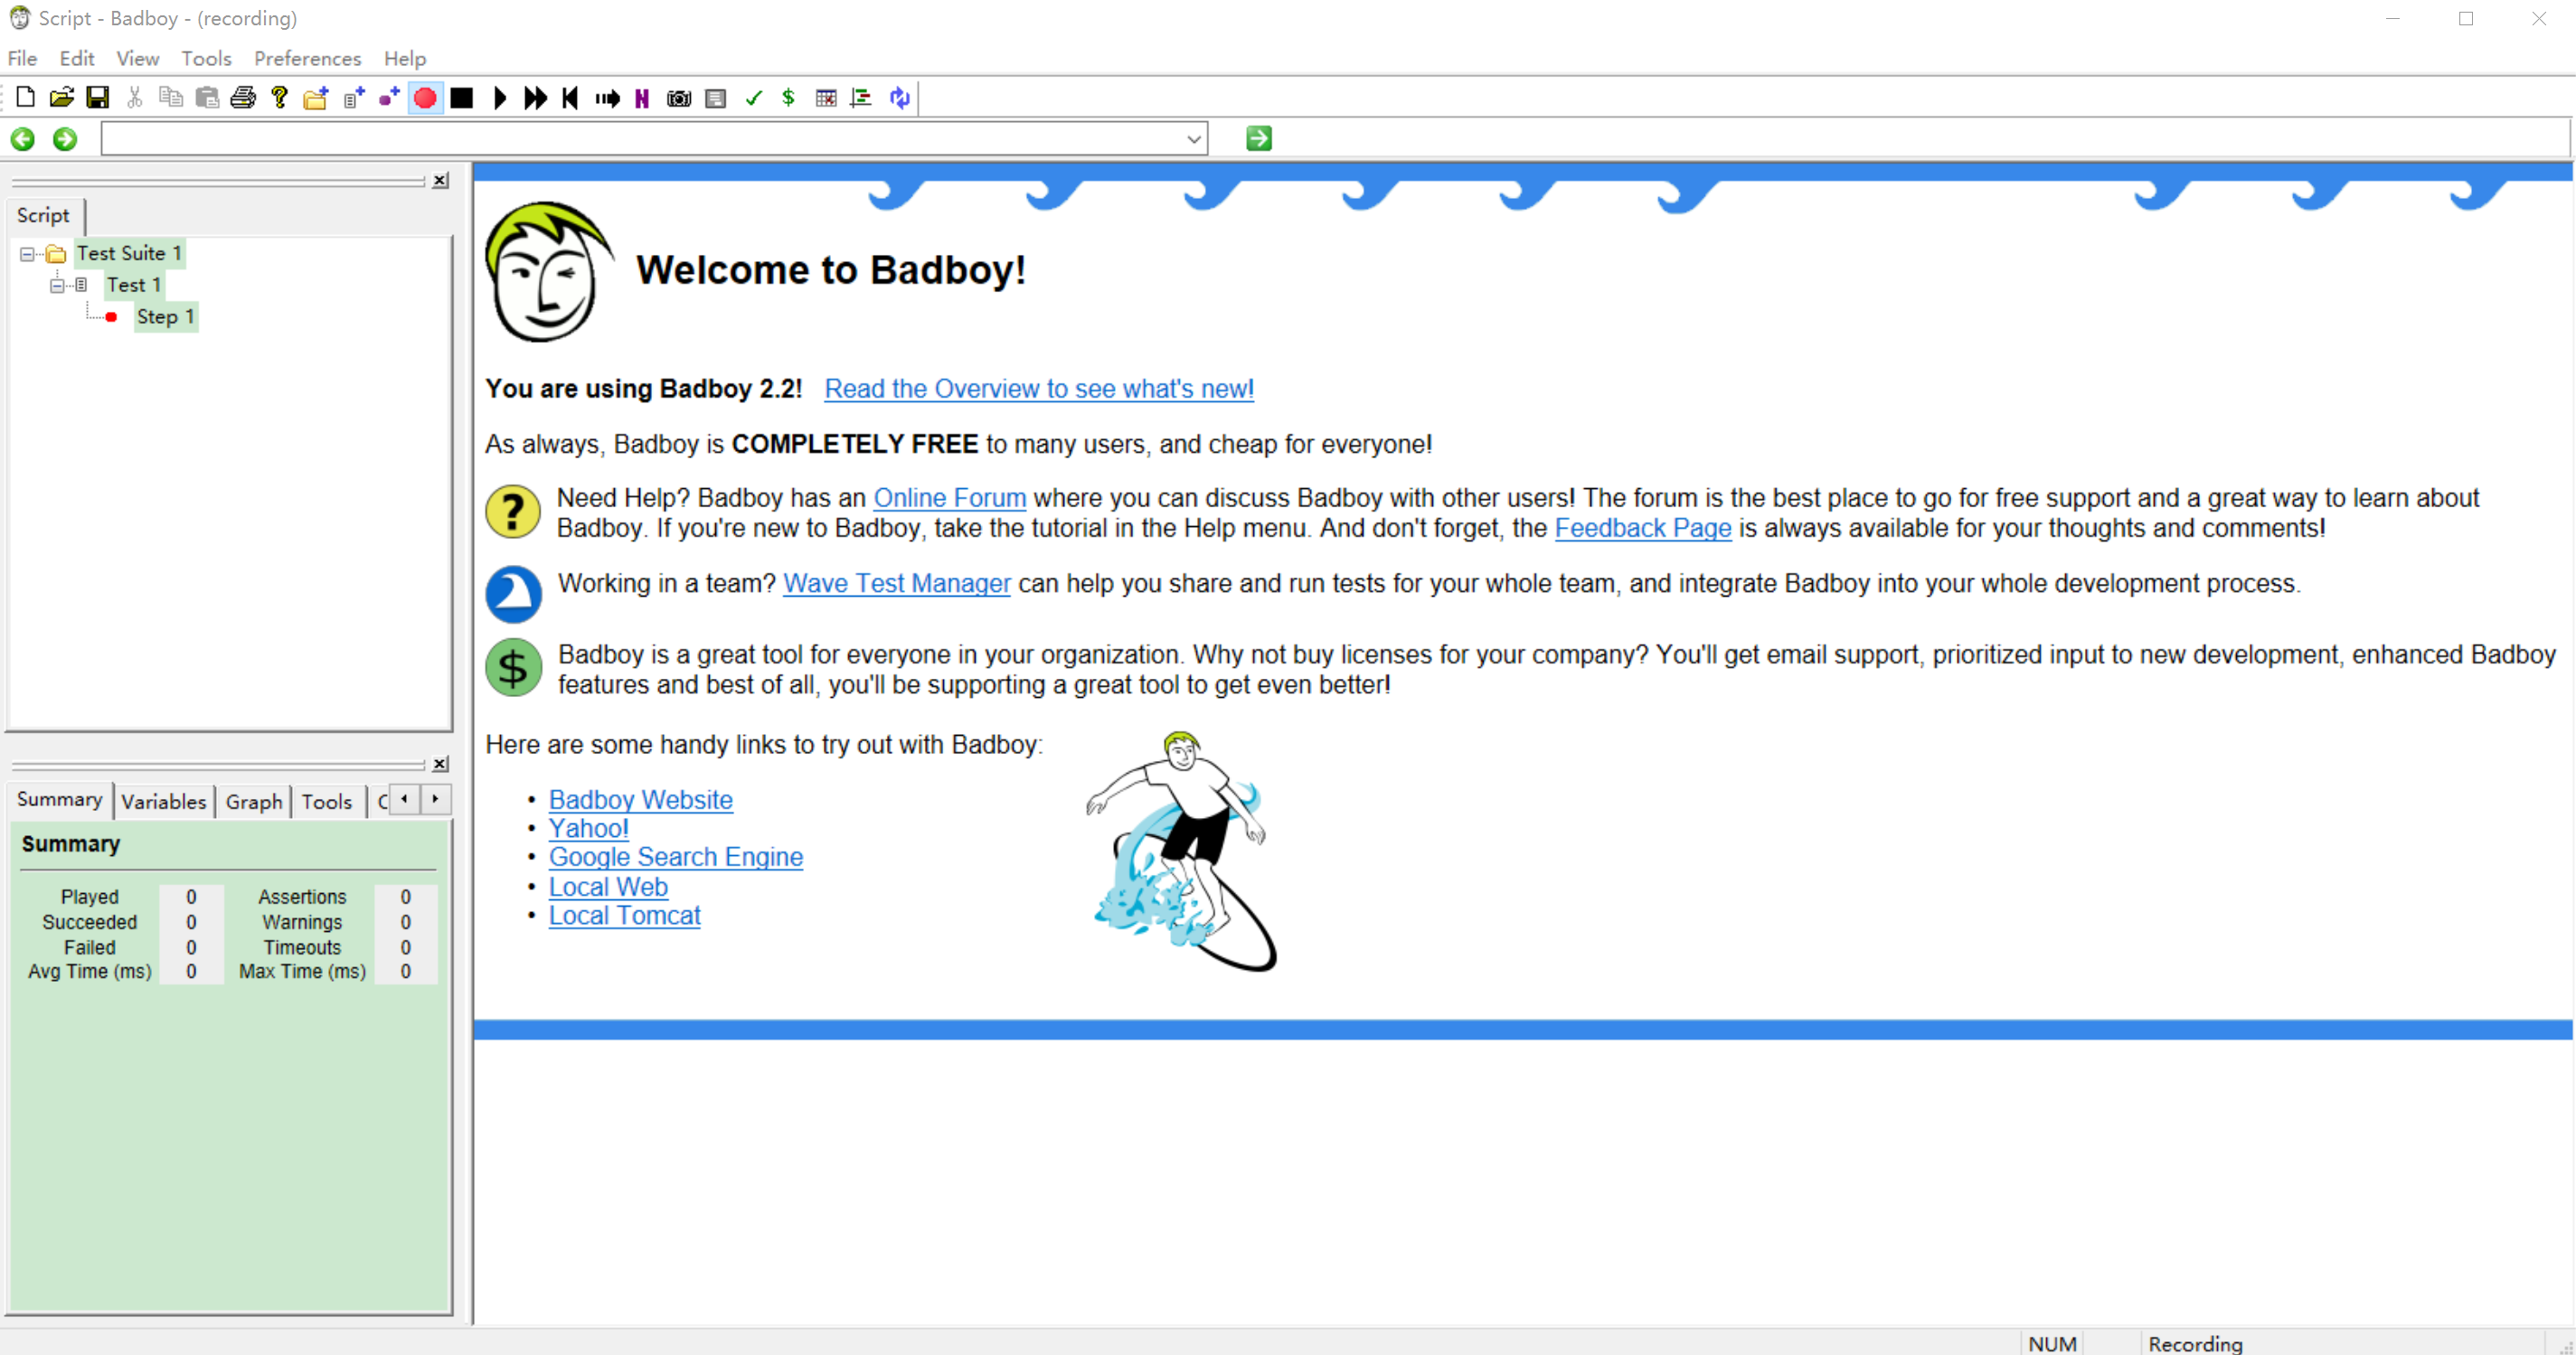
BadBoy
BadBoy is a free WEB automation testing tool. In fact, it is a browser simulation tool. It has recording and playback functions and supports debugging of recorded scripts. At the same time, it supports the function of capturing form data, so it can carry out automatic testing. However, at present, it is mostly used for script recording. BadBoy supports exporting scripts as JMeter scripts.
JMeter has many methods to record scripts, among which the most common method is to record with the third-party tool badboy. In addition, JMeter has its own settings (Http proxy server + IE browser settings) to record scripts, but most of them are recorded through badboy.
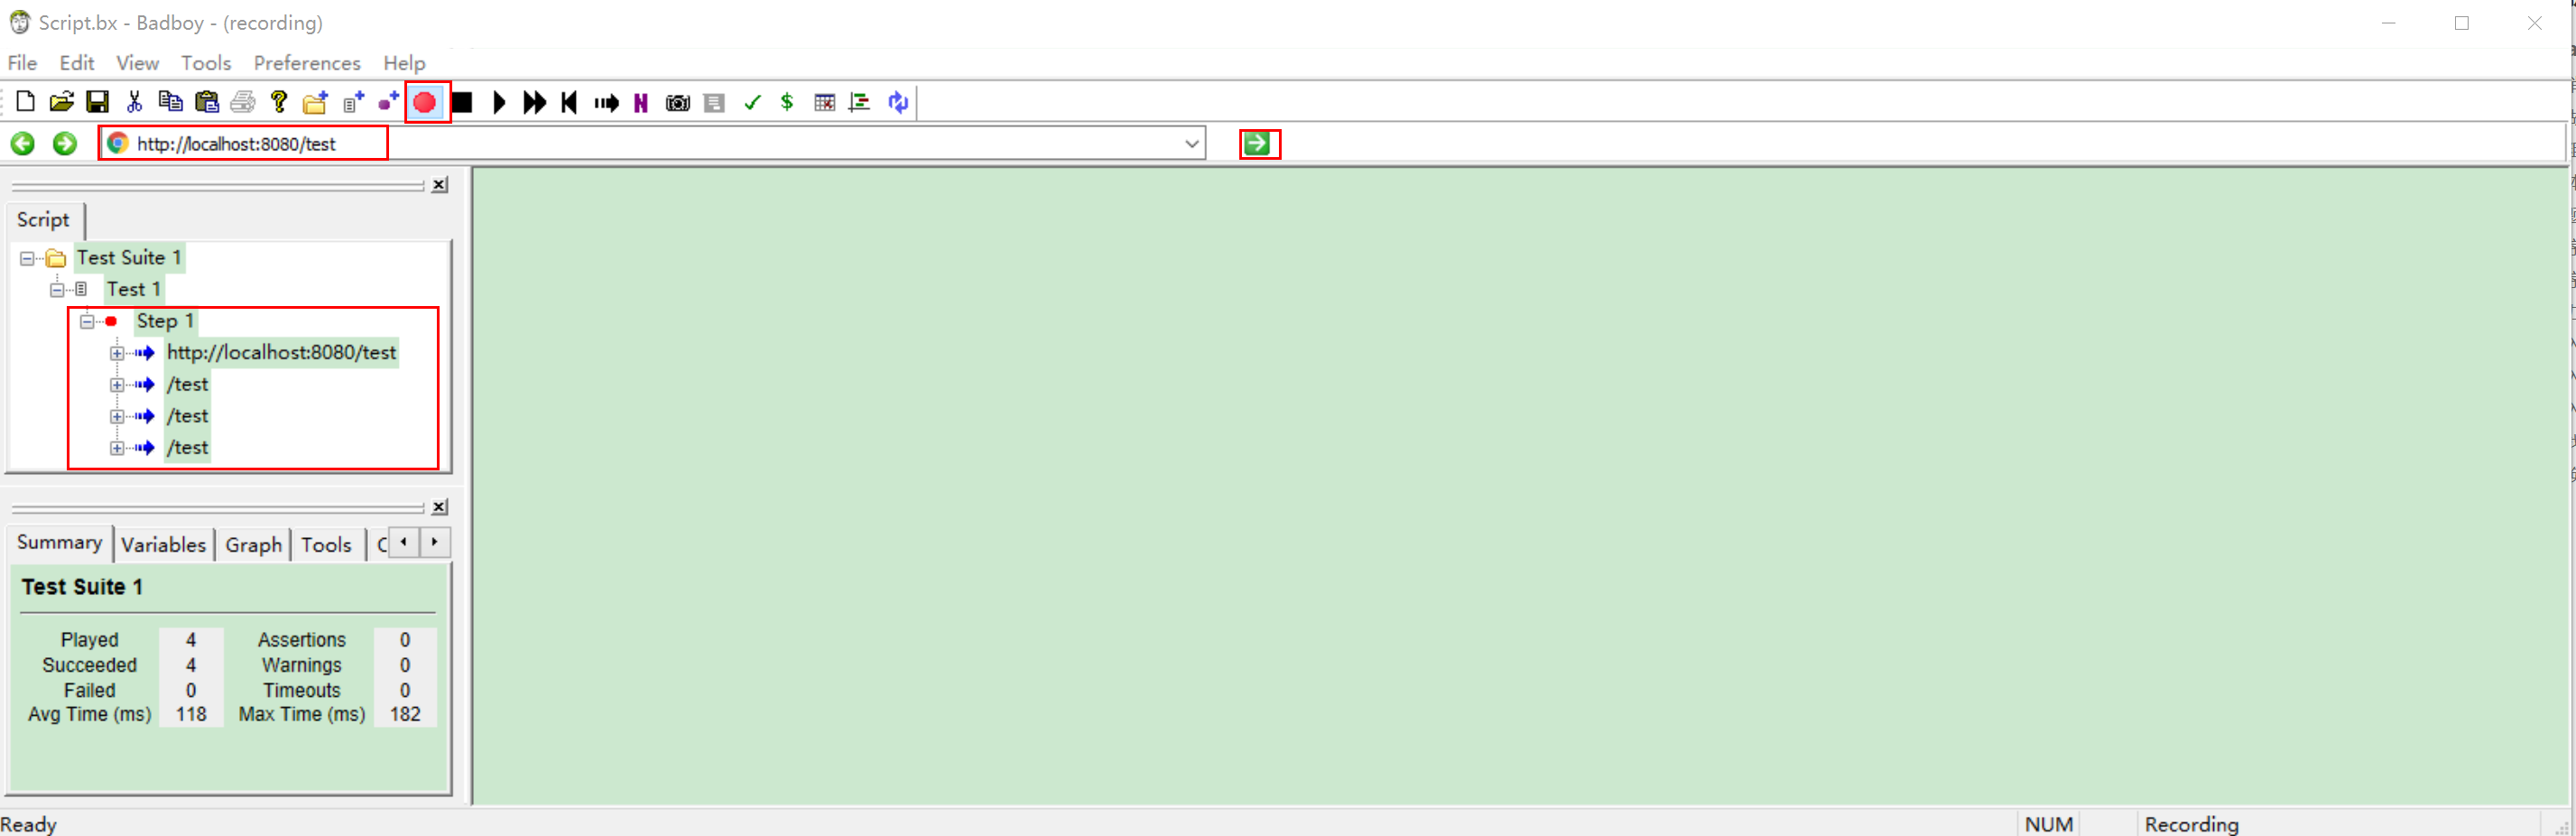
BadBoy script recording and use
After recording the operation, click file - > export to JMeter to save it as a JMeter script.
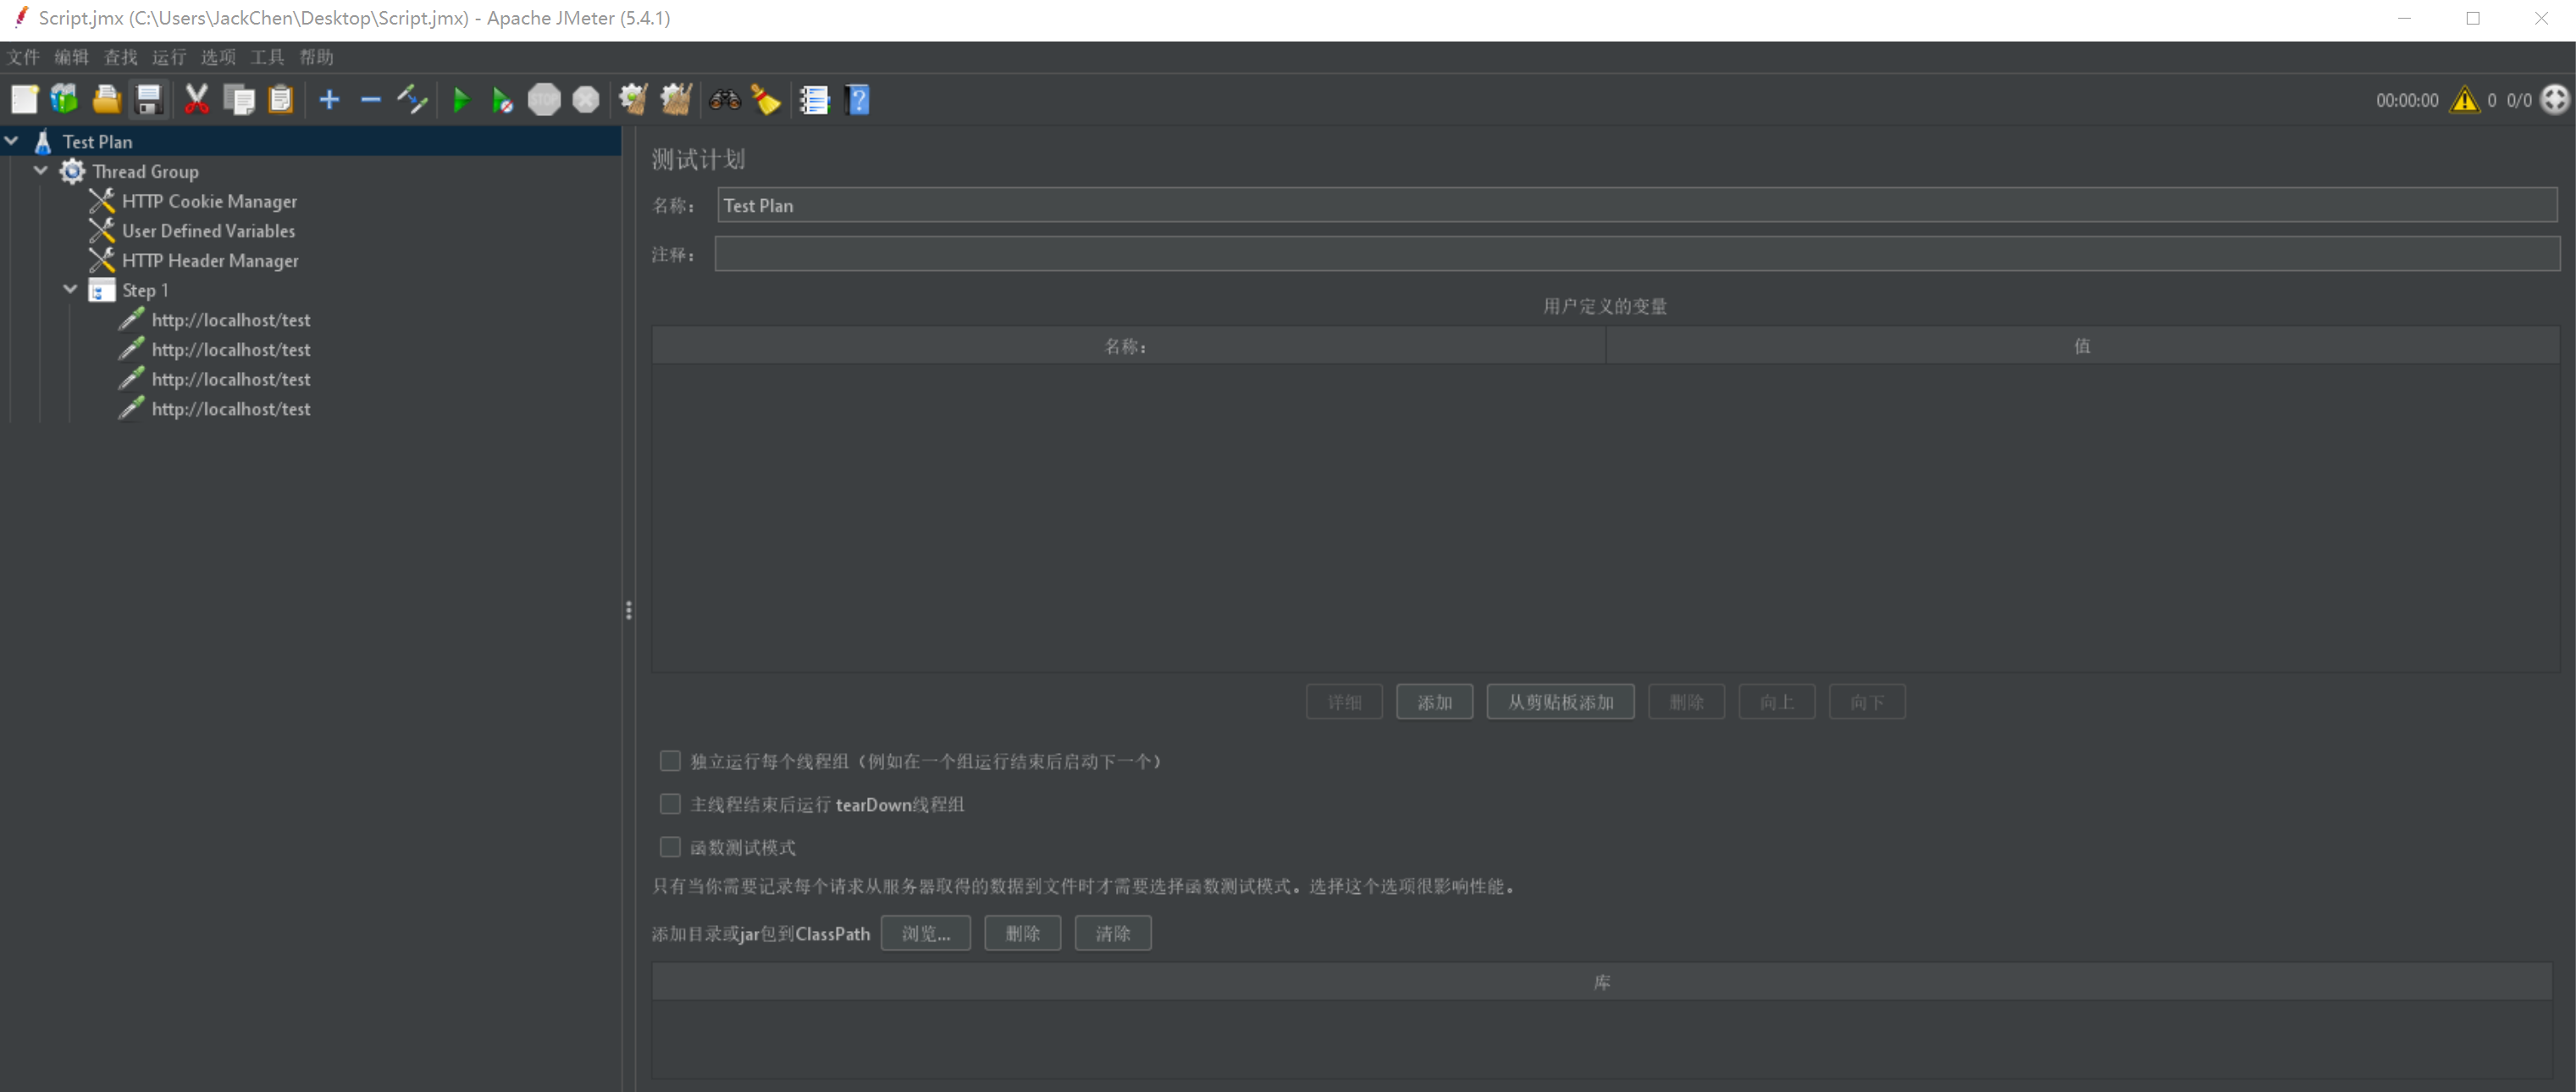
JMeter opens BadBoy recording script
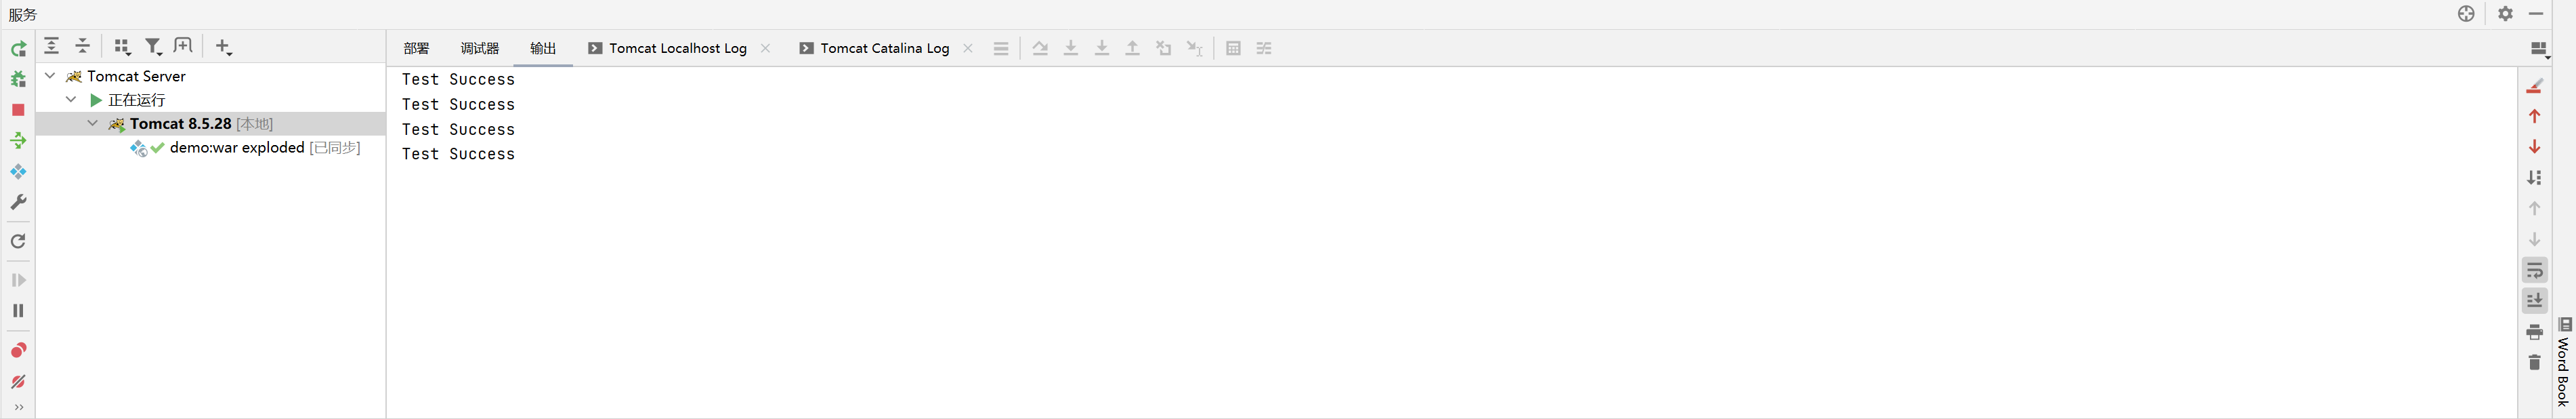
Start execution and get the corresponding request results in the background
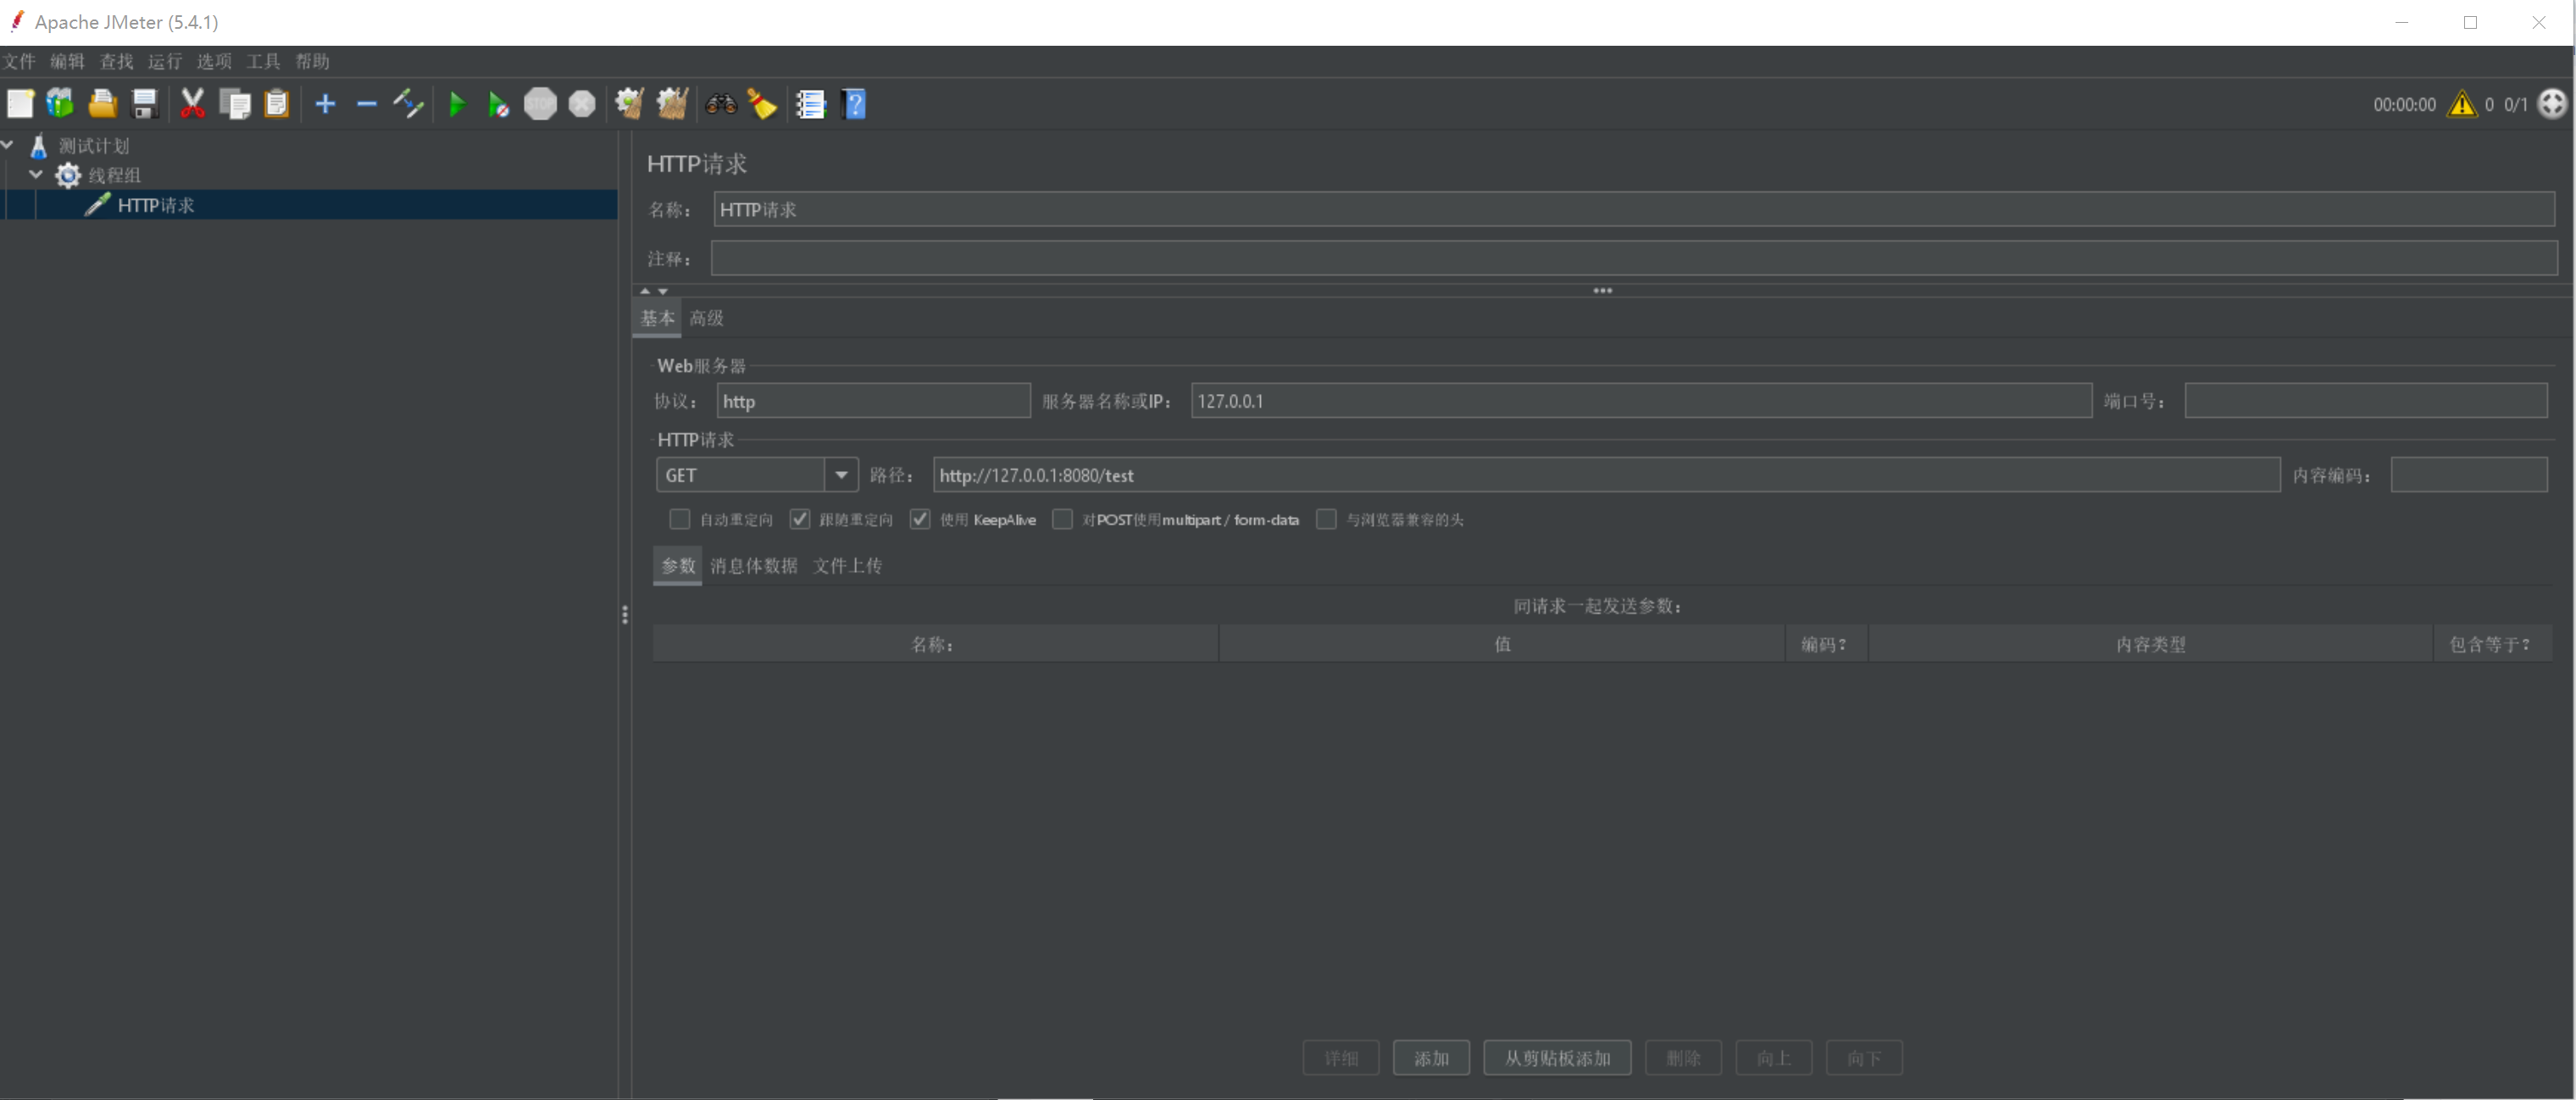
Self built test plan
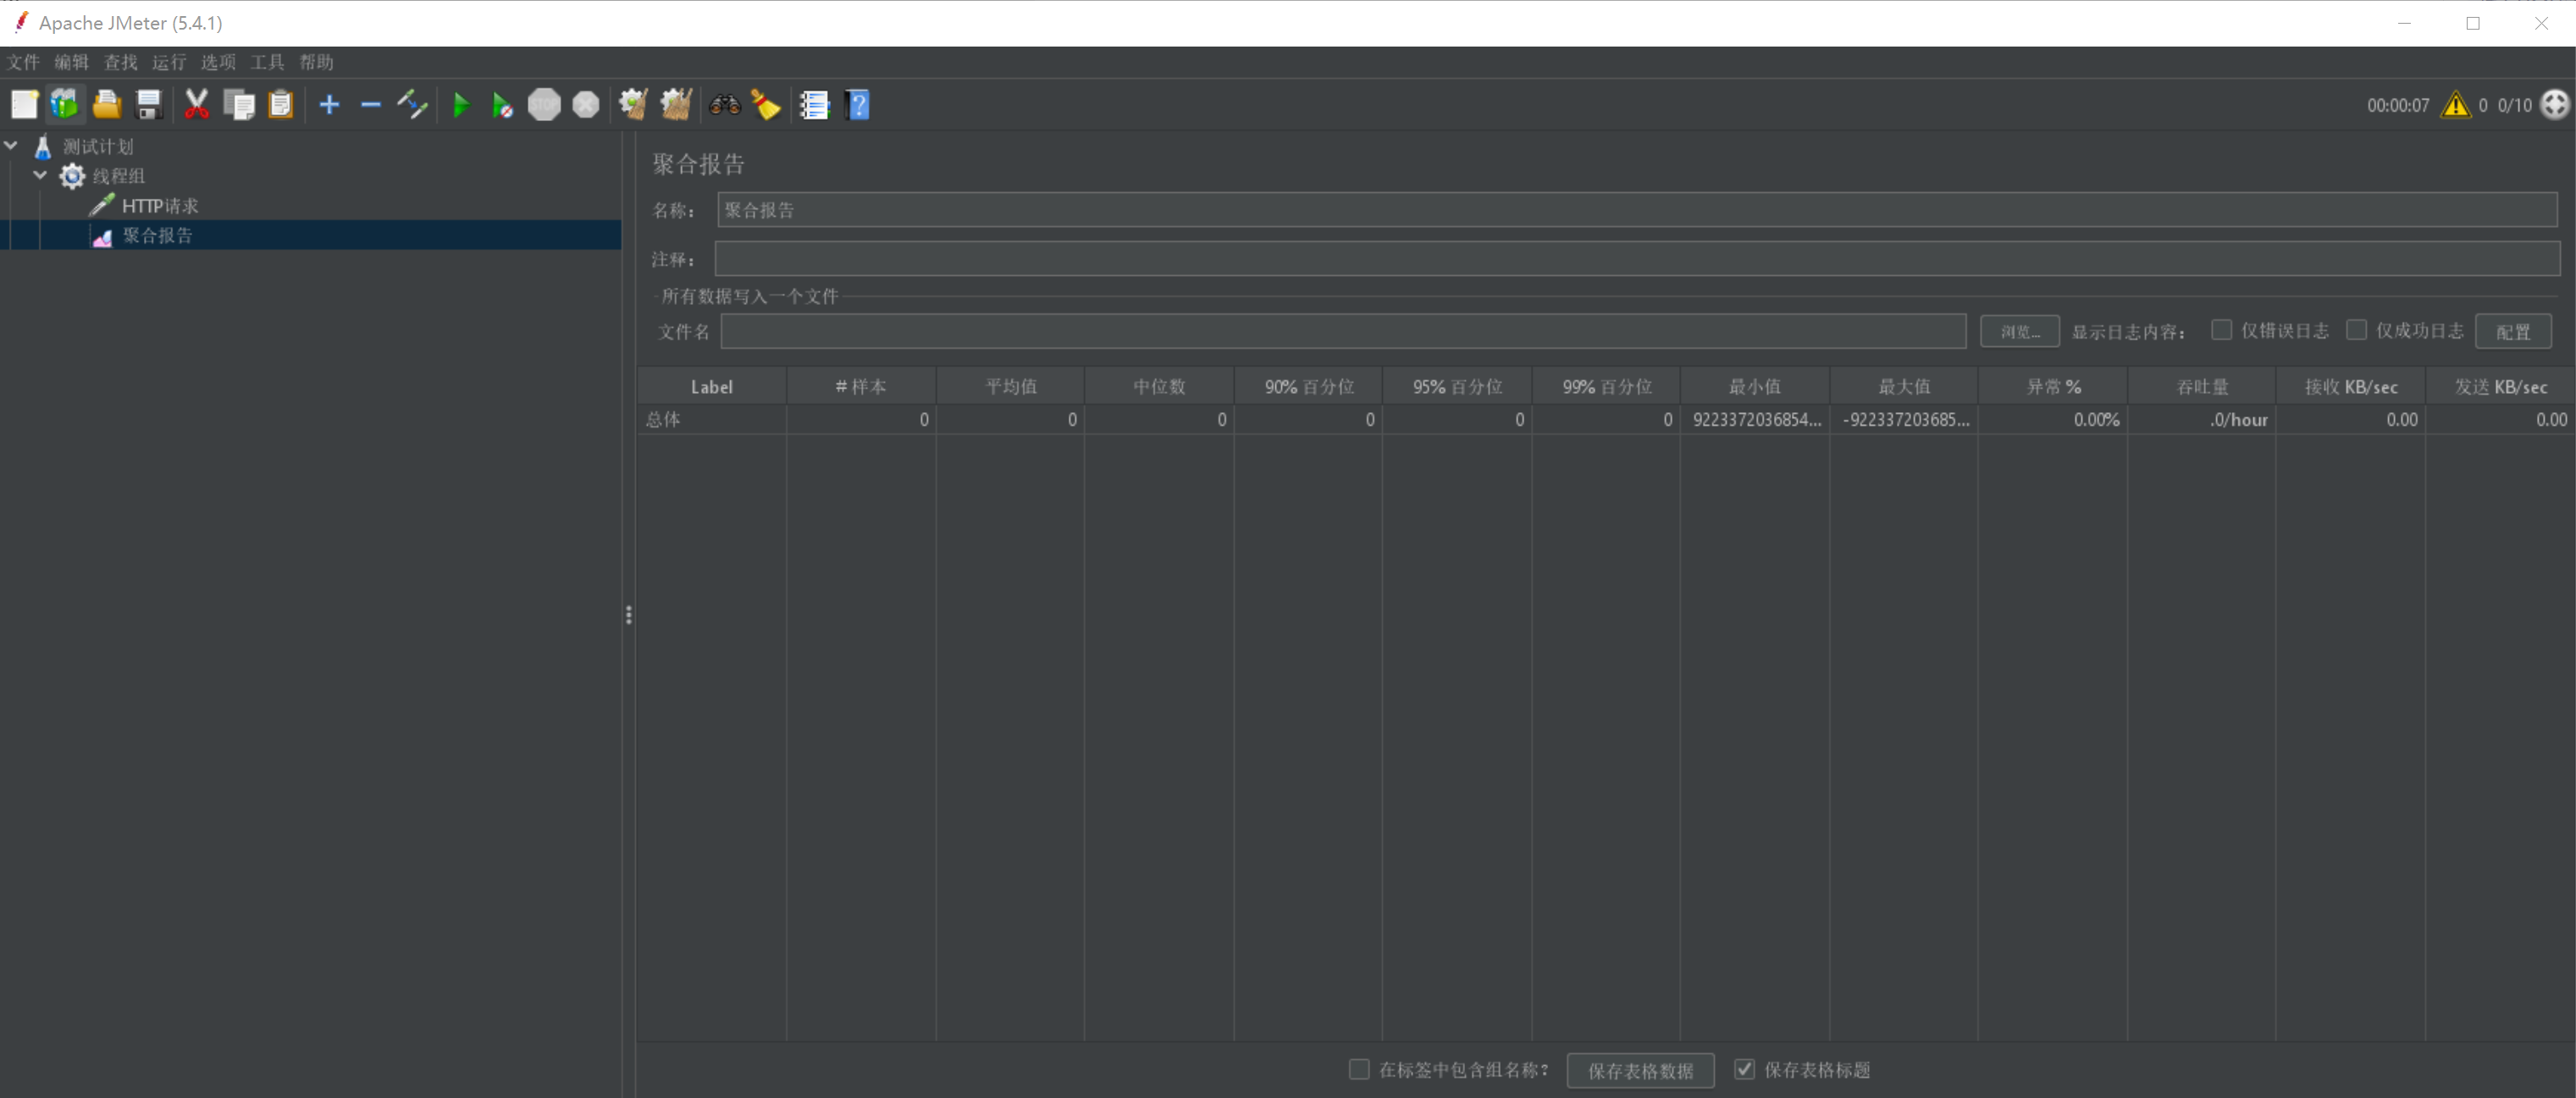
Create a new test plan and create a new thread group under the plan

Add sampler under thread group---HTTP request
Add listener under thread group---Aggregate Report