Write in front: when using Seurat, I feel it is still necessary to know how to realize each step. So I selected some functions according to the default parameter settings, extracted the main part of the calculation from the source code, omitted many details, basically realized the calculation function, and obtained the results consistent with the original function.
catalogue
Backbone code and comments that can realize basic functions
Some function usage / meaning of parameters
How to view source code
website:
seurat/differential_expression.R at master · satijalab/seurat · GitHub
plug-in unit:
It's not enough just to have the code. It's hard to find some other functions called in it, so I found a useful plug-in according to a blog.
Sourcegraph browser extension - Sourcegraph docs
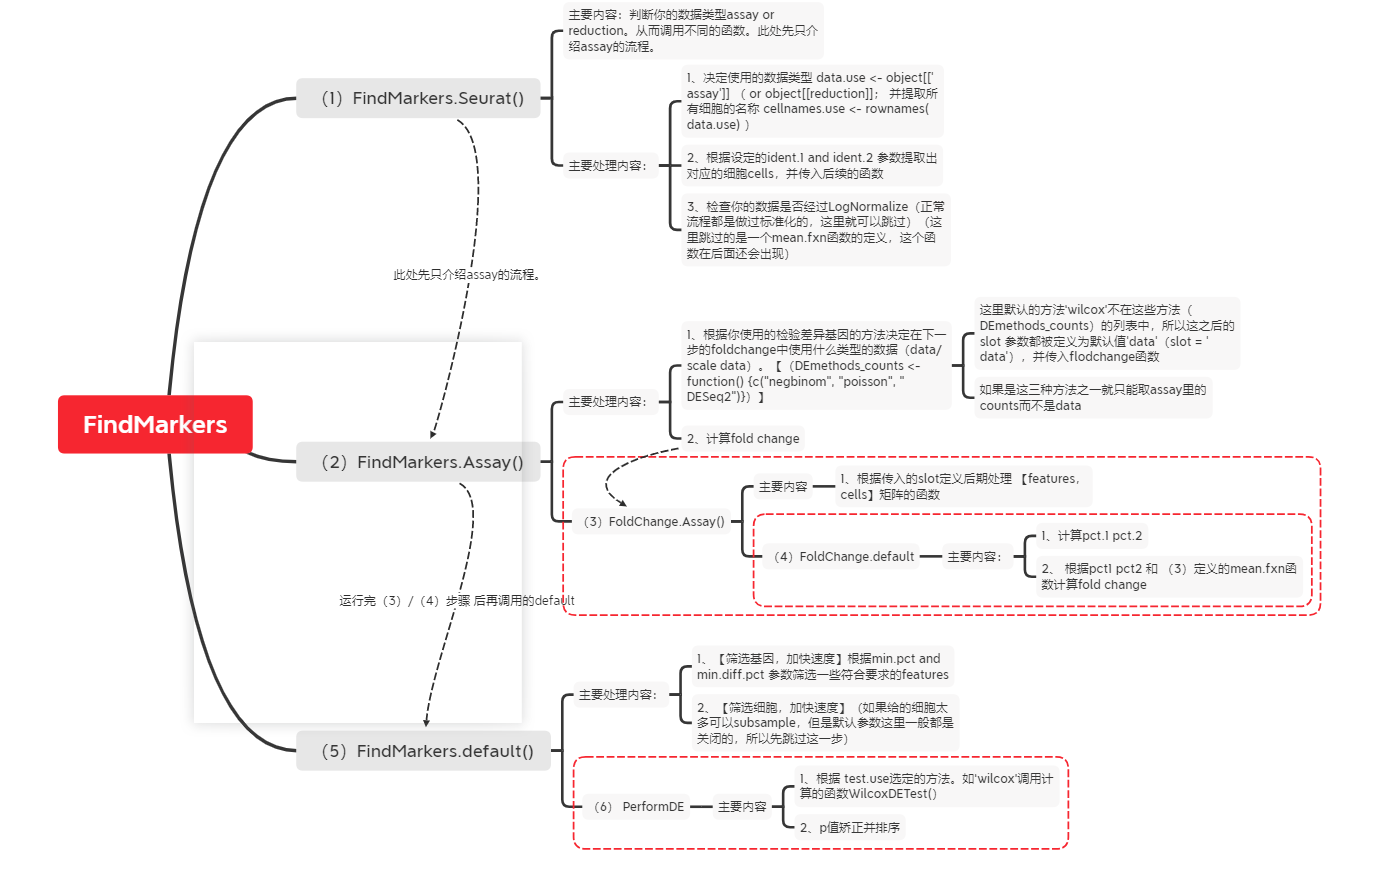
Function calling process
Backbone code and comments that can realize basic functions
Here: a_tnksets are Seurat objects
############################0. Data preparation (refer to the functions required by FindMarker)
# Cells were extracted according to idents
#
# data.use and cellnames.use
data.use <- a_tnksets@assays$RNA
cellnames.use <- colnames(data.use)

# IdentsToCells(): change the passed in ident into the corresponding cell name and return_ return(list(cells.1 = ident.1, cells.2 = ident.2))
ident.1 <- WhichCells(a_tnksets, idents = 3) # find the cells of the cluster 3
ident.2 <- setdiff(x = cellnames.use, y = ident.1) # When iden2 is not specified, but all cells except ident1
# ident.2 <- WhichCells(a_tnksets, idents = ident.2) # When ident2 is several special specified values, e.g. c(0,1,2)
# str(ident.2)
test <- list(cells.1 = ident.1, cells.2 = ident.2)

cells.1 <- test$cells.1
cells.2 <- test$cells.2

# Data extraction of assays -- data matrix
data <- GetAssayData(a_tnksets, 'data')
#data
#str(data)

# features extraction, not 2000, but all genes
features <- rownames(x = a_tnksets)

# Specify some parameters that will be used later, and basically use the default values
thresh.min <- 0
pseudocount.use = 1
base = 2
fc.name = "avg_log2FC"
min.pct <- 0.1
min.diff.pct = -Inf
logfc.threshold <- 0.25

############################ 1. Calculate pct.1 and pct.2
# Cells that express a gene are in ident 1 / ident. Percentage of all cells in 2

pct.1 <- round(
    x = rowSums(x = data[features, cells.1, drop = FALSE] > thresh.min) /
      length(x = cells.1),
    digits = 3 # Keep three decimal places
  )
  pct.2 <- round(
      x = rowSums(x = data[features, cells.2, drop = FALSE] > thresh.min) /
      length(x = cells.2),
    digits = 3
 )

############################ 2. Calculate foldchange
mean.fxn <- function(x) {
              return(log(x = rowMeans(x = expm1(x = x)) + pseudocount.use, base = base))
            }
# The reason for using expm1 is that when x is very close to zero, expm1 will be more accurate than exp1
# pseudocount is because when some genes are expressed as 0, 1) log0 is meaningless, and the occurrence of a gene in all cells in an observation is 0 does not mean that it is not really expressed in these cells. Add values to these to make up for the events that are not observed
# <https://www.zhihu.com/question/23405711>

data.1 <- mean.fxn(data[features, cells.1, drop = FALSE])
data.2 <- mean.fxn(data[features, cells.2, drop = FALSE])
data.1
fc <- (data.1 - data.2)
fc.results <- as.data.frame(x = cbind(fc, pct.1, pct.2))
colnames(fc.results) <- c(fc.name, "pct.1", "pct.2")
#expm1(x) = exp(x) - 1 . e.g. expm1(1) = 1.718 or expm1(0) = 0

############################ 3. Get a subset of features according to the default parameters or input parameters
# Subset of features: min.pct accelerated calculation - (take 0.1 as an example) as long as more than 0.1% of cells in cells1 and cells2 express the gene of this gene
# default value
min.pct <- 0.1
min.diff.pct = -Inf #Specifies the multiple of the difference that can be detected. The default is negative infinity

alpha.min <- pmax(fc.results$pct.1, fc.results$pct.2) # Take the maximum value of the corresponding position in the two vectors as a new vector
# pmax(c(1,2),(2,1)) -> c(2,2)

names(x = alpha.min) <- rownames(x = fc.results)
features <- names(x = which(x = alpha.min >= min.pct))
alpha.diff <- alpha.min - pmin(fc.results$pct.1, fc.results$pct.2)

features <- names(
  x = which(x = alpha.min >= min.pct & alpha.diff >= min.diff.pct)
)

# feature selection (based on logFC)
logfc.threshold <- 0.25
total.diff <- fc.results[, 1] #first column is logFC
 names(total.diff) <- rownames(fc.results)
  features.diff <- names(x = which(x = abs(x = total.diff) >= logfc.threshold)) # The default here is only Calculation with POS = false

# intersect intersection
# One is a complete set and the other is a subset greater than the threshold. If the intersection is 0, it indicates that there are no genes that meet the threshold requirements
features <- intersect(x = features, y = features.diff)

############################ 4. wilcox test
# Here we only take wilcox as an example. You can see the source code if you need others
# Parameter setting
latent.vars = NULL
test.use = 'wilcox'

   data.use <- data[features, c(cells.1, cells.2), drop = FALSE]
      de.results <- switch(
        EXPR = test.use,
        'wilcox' = WilcoxDETest(
          data.use = data.use,
          cells.1 = cells.1,
          cells.2 = cells.2,
          verbose = TRUE
        ),
        'bimod' = DiffExpTest(
          data.use = data.use,
          cells.1 = cells.1,
          cells.2 = cells.2,
          verbose = verbose
        ),
        stop("Unknown test: ", test.use)
      )
        ############################ 4.1 wilcoxDETest definition
        # First, load some required packages
        library(future)
        library(pbapply)
        library(stats)
        # Define function
        WilcoxDETest <- function(
          data.use,
          cells.1,
          cells.2,
          verbose = TRUE,
          ...
        ) {
          data.use <- data.use[, c(cells.1, cells.2), drop = FALSE]
          j <- seq_len(length.out = length(x = cells.1))
          my.sapply <- ifelse(
            test = verbose && nbrOfWorkers() == 1,
            yes = pbsapply,
            no = future_sapply
          ) # The functions in the future package are similar to the corresponding functions of base, that is, they can support local parallel or distributed computing on clusters

          overflow.check <- ifelse(
            test = is.na(x = suppressWarnings(length(x = data.use[1, ]) * length(x = data.use[1, ]))),
            yes = FALSE,
            no = TRUE
          )

          limma.check <- PackageCheck("limma", error = FALSE)
          if (limma.check[1] && overflow.check) {
            p_val <- my.sapply(
              X = 1:nrow(x = data.use),
              FUN = function(x) {
                return(min(2 * min(limma::rankSumTestWithCorrelation(index = j, statistics = data.use[x, ])), 1))
              }
            )
          } else {
            if (getOption('Seurat.limma.wilcox.msg', TRUE) && overflow.check) {
              message(
                "For a more efficient implementation of the Wilcoxon Rank Sum Test,",
                "\\n(default method for FindMarkers) please install the limma package",
                "\\n--------------------------------------------",
                "\\ninstall.packages('BiocManager')",
                "\\nBiocManager::install('limma')",
                "\\n--------------------------------------------",
                "\\nAfter installation of limma, Seurat will automatically use the more ",
                "\\nefficient implementation (no further action necessary).",
                "\\nThis message will be shown once per session"
              )
              options(Seurat.limma.wilcox.msg = FALSE)
            }
            group.info <- data.frame(row.names = c(cells.1, cells.2))
            group.info[cells.1, "group"] <- "Group1"
            group.info[cells.2, "group"] <- "Group2"
            group.info[, "group"] <- factor(x = group.info[, "group"])
            data.use <- data.use[, rownames(x = group.info), drop = FALSE]
            p_val <- my.sapply(
              X = 1:nrow(x = data.use),
              FUN = function(x) {
                return(wilcox.test(data.use[x, ] ~ group.info[, "group"], ...)$p.value)
              }
            )
          }
          return(data.frame(p_val, row.names = rownames(x = data.use)))
        }

############################ 5. p-value correction and ranking
  de.results <- cbind(de.results, fc.results[rownames(x = de.results), , drop = FALSE])

    de.results <- de.results[order(de.results$p_val, -de.results[, 1]), ]
    de.results$p_val_adj = p.adjust(
      p = de.results$p_val,
      method = "bonferroni",
      n = nrow(x = data)
    )
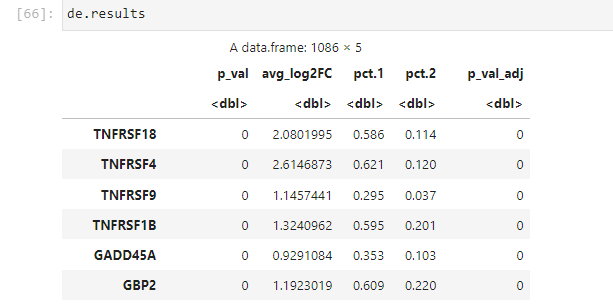
Result test
Using the Seurat function

The backbone code extracted in this paper
Some function usage / meaning of parameters
-
%||%
"%||%" <- function(a, b) if (!is.null(a)) a else b
What does %||% do in R? - Stack Overflow
devtools:::%||%``
Is a function outside the package. If you want to use it without loading the package, you should define it yourself
The specific meaning is: if the previous a is empty, then b is returned
e.g.
From <https://github.com/hadley/devtools/blob/master/R/utils.r>

"%||%" <- function(a, b) if (!is.null(a)) a else b
It's an internal function, so you probably need to redefine it for yourself if you want to use it outside the package.

"%||%" <- devtools:::`%||%`
1 %||% NULL
## [1] 1
NULL %||% 2
## [1] 2
-
setdiff
-
pmax
Take the maximum value from the corresponding position of the vector
pmax and pmin R Function | 3 Example Codes (Warning & Handling NA)
-
intersect()
-
Meaning of pct.1 and pct.2
FindAllMarkers function helps to identify gene markers for each cluster relative to all other clusters. The expression for a given gene among cells in a given cluster is compared against the expression of that gene among cells in all other clusters. In the output, pct.1 is the percentage of cells in the cluster where the gene is detected, cA gene to be considered as an IDEAL cluster marker is expected to be expressed exclusively in that cluster and silenced in all others and thus pct.1 will be more towards 1 and pct.2 towards 0.
pct.1 is the percentage of cells in the cluster where the gene was detected
pct.2 is the average percentage of cells in all other clusters where the gene was detected.
(referring to the top difference gene in the last difference gene) a gene considered as an ideal cluster marker is expected to be uniquely expressed in this cluster and silent in all other clusters. Therefore, pct.1 will be closer to 1 and PCT. 2 will be closer to 0.
-
expm1
-
Calculation principle of foldchage
-
tryCatch
tryCatch in R language:
How to use tryCatch in sciencenet-R language: judge the blog posts of Warning and Error - Deng Fei
tt <- tryCatch(
    expr = {
      aaaaa
    },warning = function(w){
        2
        print("warning")
    },
    error = function(e){
        3
        print("error, because this command return error")
    }
)
tt
###############
#output
[1] "error, because this command return error"
'error, because this command return error'

implement expr If the result type of the command itself is error,Then the error message will become error Function.
Instead of reporting normal errors:

Error in eval(expr, envir, enclos): object 'aaaaa' not found
Traceback: