innodb monitor overview
innodb monitor is a built-in monitoring module of innodb. You can view it with show engine innodb status.
innodb monitor output can be output in the error log
To view finer grained innodb lock information, you need to open innodb_status_output_locks
Type of innodb monitor
There are two types of innodb monitor: innodb standard monitor and innodb lock monitor
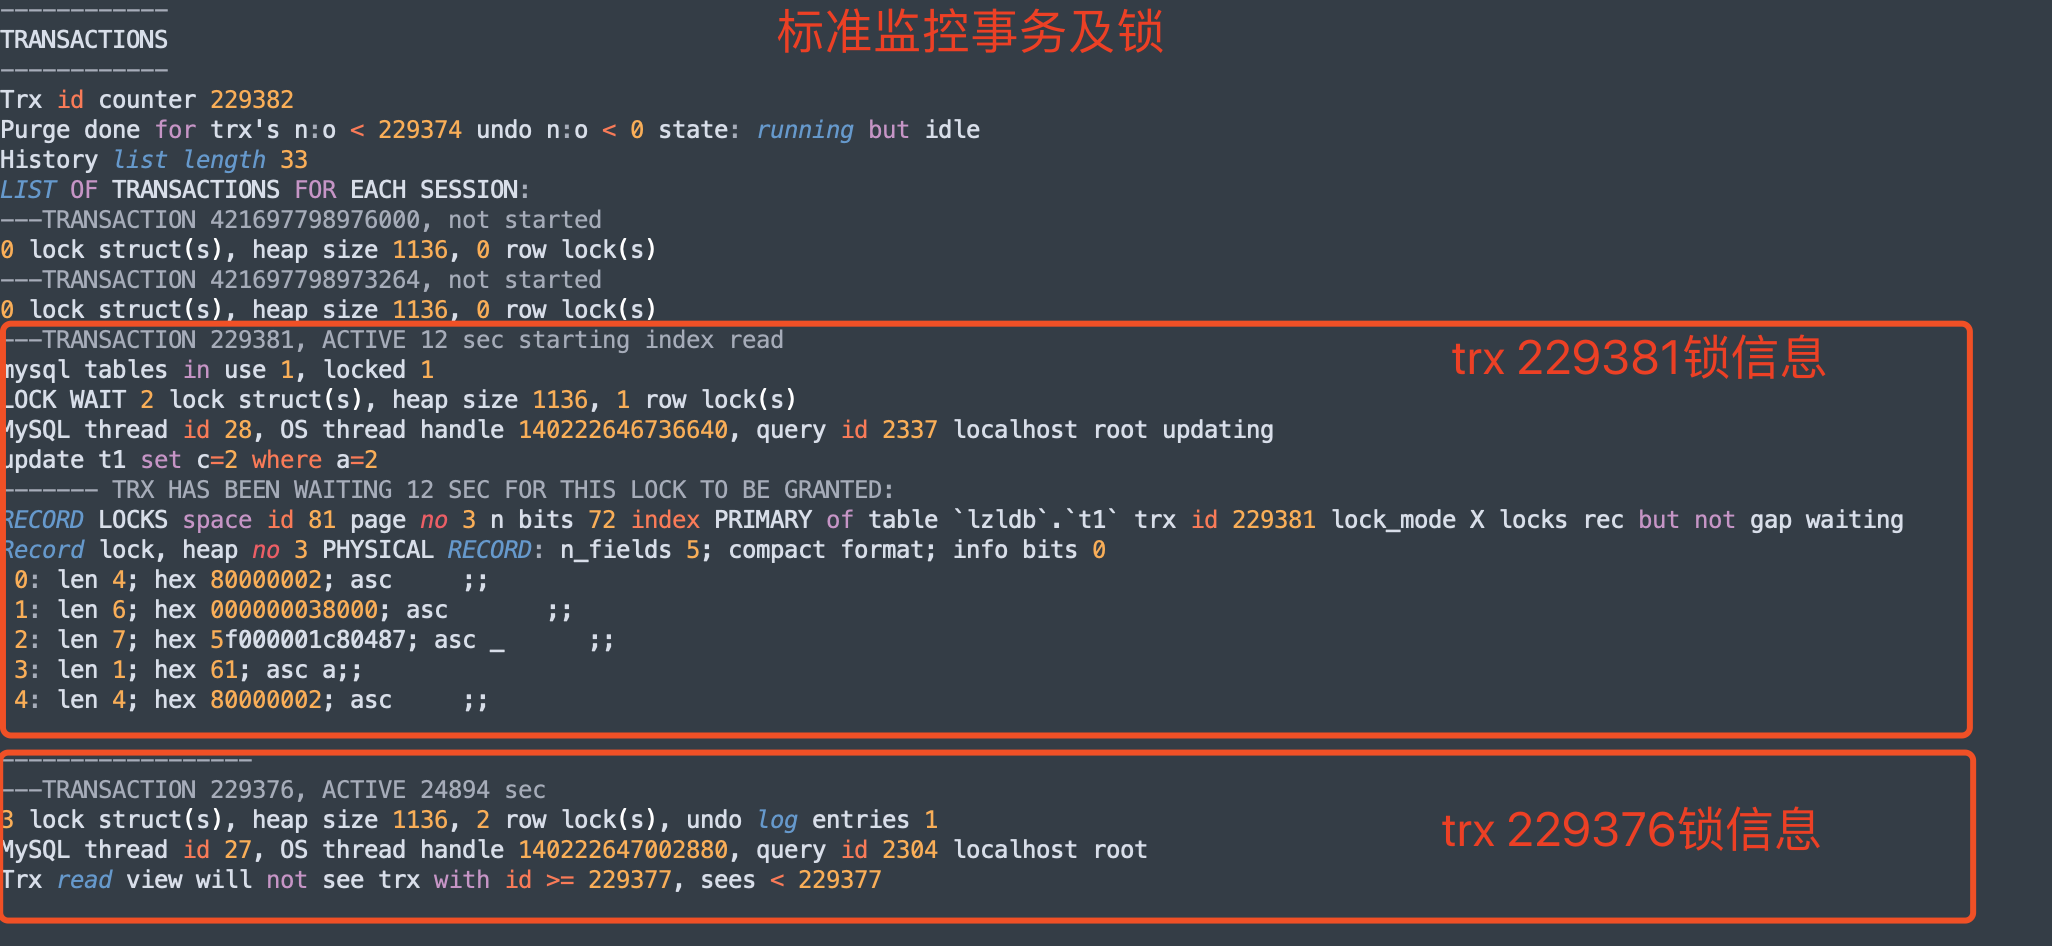
innodb standard monitor
In fact, the default output of show engine is nodb.
Note that the innodb standard monitoring output has lock information. The innodb lock monitoring only inputs more lock information on the standard output
mysql> show engine innodb status\G

=====================================
2021-05-10 09:04:13 0x7f8821084700 INNODB MONITOR OUTPUT    --Standard output, 2021-05-10 09:04:13 Monitoring time
=====================================
Per second averages calculated from the last 33 seconds     --The monitoring data is near xx Average in seconds
-----------------
BACKGROUND THREAD                                           --srv_master_thread Background thread information
-----------------
srv_master_thread loops: 66 srv_active, 0 srv_shutdown, 201928 srv_idle
srv_master_thread log flush and writes: 201964
----------
SEMAPHORES                                                  --wait for mutex,lock Signal information, thread spin information
----------
OS WAIT ARRAY INFO: reservation count 200
OS WAIT ARRAY INFO: signal count 184
RW-shared spins 0, rounds 170, OS waits 88
RW-excl spins 0, rounds 91, OS waits 4
RW-sx spins 0, rounds 0, OS waits 0
Spin rounds per wait: 170.00 RW-shared, 91.00 RW-excl, 0.00 RW-sx
------------
TRANSACTIONS                                                --Transaction information, including lock information. Lock information is output by default
------------
Trx id counter 229376
Purge done for trx's n:o < 229374 undo n:o < 0 state: running but idle
History list length 33
LIST OF TRANSACTIONS FOR EACH SESSION:
---TRANSACTION 421697798973264, not started
0 lock struct(s), heap size 1136, 0 row lock(s)
--------
FILE I/O                                                   --IO thread ,aio Other information
--------
I/O thread 0 state: waiting for completed aio requests (insert buffer thread)
I/O thread 1 state: waiting for completed aio requests (log thread)
I/O thread 2 state: waiting for completed aio requests (read thread)
I/O thread 3 state: waiting for completed aio requests (read thread)
I/O thread 4 state: waiting for completed aio requests (read thread)
I/O thread 5 state: waiting for completed aio requests (read thread)
I/O thread 6 state: waiting for completed aio requests (write thread)
I/O thread 7 state: waiting for completed aio requests (write thread)
I/O thread 8 state: waiting for completed aio requests (write thread)
I/O thread 9 state: waiting for completed aio requests (write thread)
Pending normal aio reads: [0, 0, 0, 0] , aio writes: [0, 0, 0, 0] ,
 ibuf aio reads:, log i/o's:, sync i/o's:
Pending flushes (fsync) log: 0; buffer pool: 0
910 OS file reads, 1607 OS file writes, 755 OS fsyncs
0.00 reads/s, 0 avg bytes/read, 0.00 writes/s, 0.00 fsyncs/s
-------------------------------------
INSERT BUFFER AND ADAPTIVE HASH INDEX                     --change buffer Adaptive indexing
-------------------------------------
Ibuf: size 1, free list len 0, seg size 2, 3 merges
merged operations:
 insert 0, delete mark 0, delete 0
discarded operations:
 insert 0, delete mark 0, delete 0
Hash table size 34673, node heap has 0 buffer(s)
Hash table size 34673, node heap has 0 buffer(s)
Hash table size 34673, node heap has 0 buffer(s)
Hash table size 34673, node heap has 0 buffer(s)
Hash table size 34673, node heap has 1 buffer(s)
Hash table size 34673, node heap has 1 buffer(s)
Hash table size 34673, node heap has 0 buffer(s)
Hash table size 34673, node heap has 0 buffer(s)
0.00 hash searches/s, 0.00 non-hash searches/s
---
LOG                                                      --innodb log information
---
Log sequence number 67886692
Log flushed up to   67886692
Pages flushed up to 67886692
Last checkpoint at  67886683
0 pending log flushes, 0 pending chkp writes
312 log i/o's done, 0.00 log i/o's/second
----------------------
BUFFER POOL AND MEMORY                                   --buffer pool And memory pool
----------------------
Total large memory allocated 137428992
Dictionary memory allocated 322053
Buffer pool size   8191
Free buffers       7581
Database pages     608
Old database pages 206
Modified db pages  0
Pending reads      0
Pending writes: LRU 0, flush list 0, single page 0
Pages made young 43, not young 156
0.00 youngs/s, 0.00 non-youngs/s
Pages read 872, created 413, written 955
0.00 reads/s, 0.00 creates/s, 0.00 writes/s
No buffer pool page gets since the last printout
Pages read ahead 0.00/s, evicted without access 0.00/s, Random read ahead 0.00/s
LRU len: 608, unzip_LRU len: 0
I/O sum[0]:cur[0], unzip sum[0]:cur[0]
--------------
ROW OPERATIONS                                           --Data row operation statistics
--------------
0 queries inside InnoDB, 0 queries in queue
0 read views open inside InnoDB
Process ID=2134, Main thread ID=140222417331968, state: sleeping
Number of rows inserted 17905, updated 1, deleted 0, read 18652
0.00 inserts/s, 0.00 updates/s, 0.00 deletes/s, 0.00 reads/s
----------------------------
END OF INNODB MONITOR OUTPUT                            --innodb monitor ending
============================
InnoDB Lock Monitor - InnoDB Lock Monitor
InnoDB Lock Monitor will output more lock information in the standard monitoring output
Turn on InnoDB Lock Monitor
SET GLOBAL innodb_status_output_locks=ON;
innodb_status_output_locks is a dynamic parameter. It is off by default. If you want to see more fine-grained lock information, you need to turn this parameter on.
(note that when innodb_status_output_locks=off, there is still lock information in show engine innodb status, but it is not so detailed)
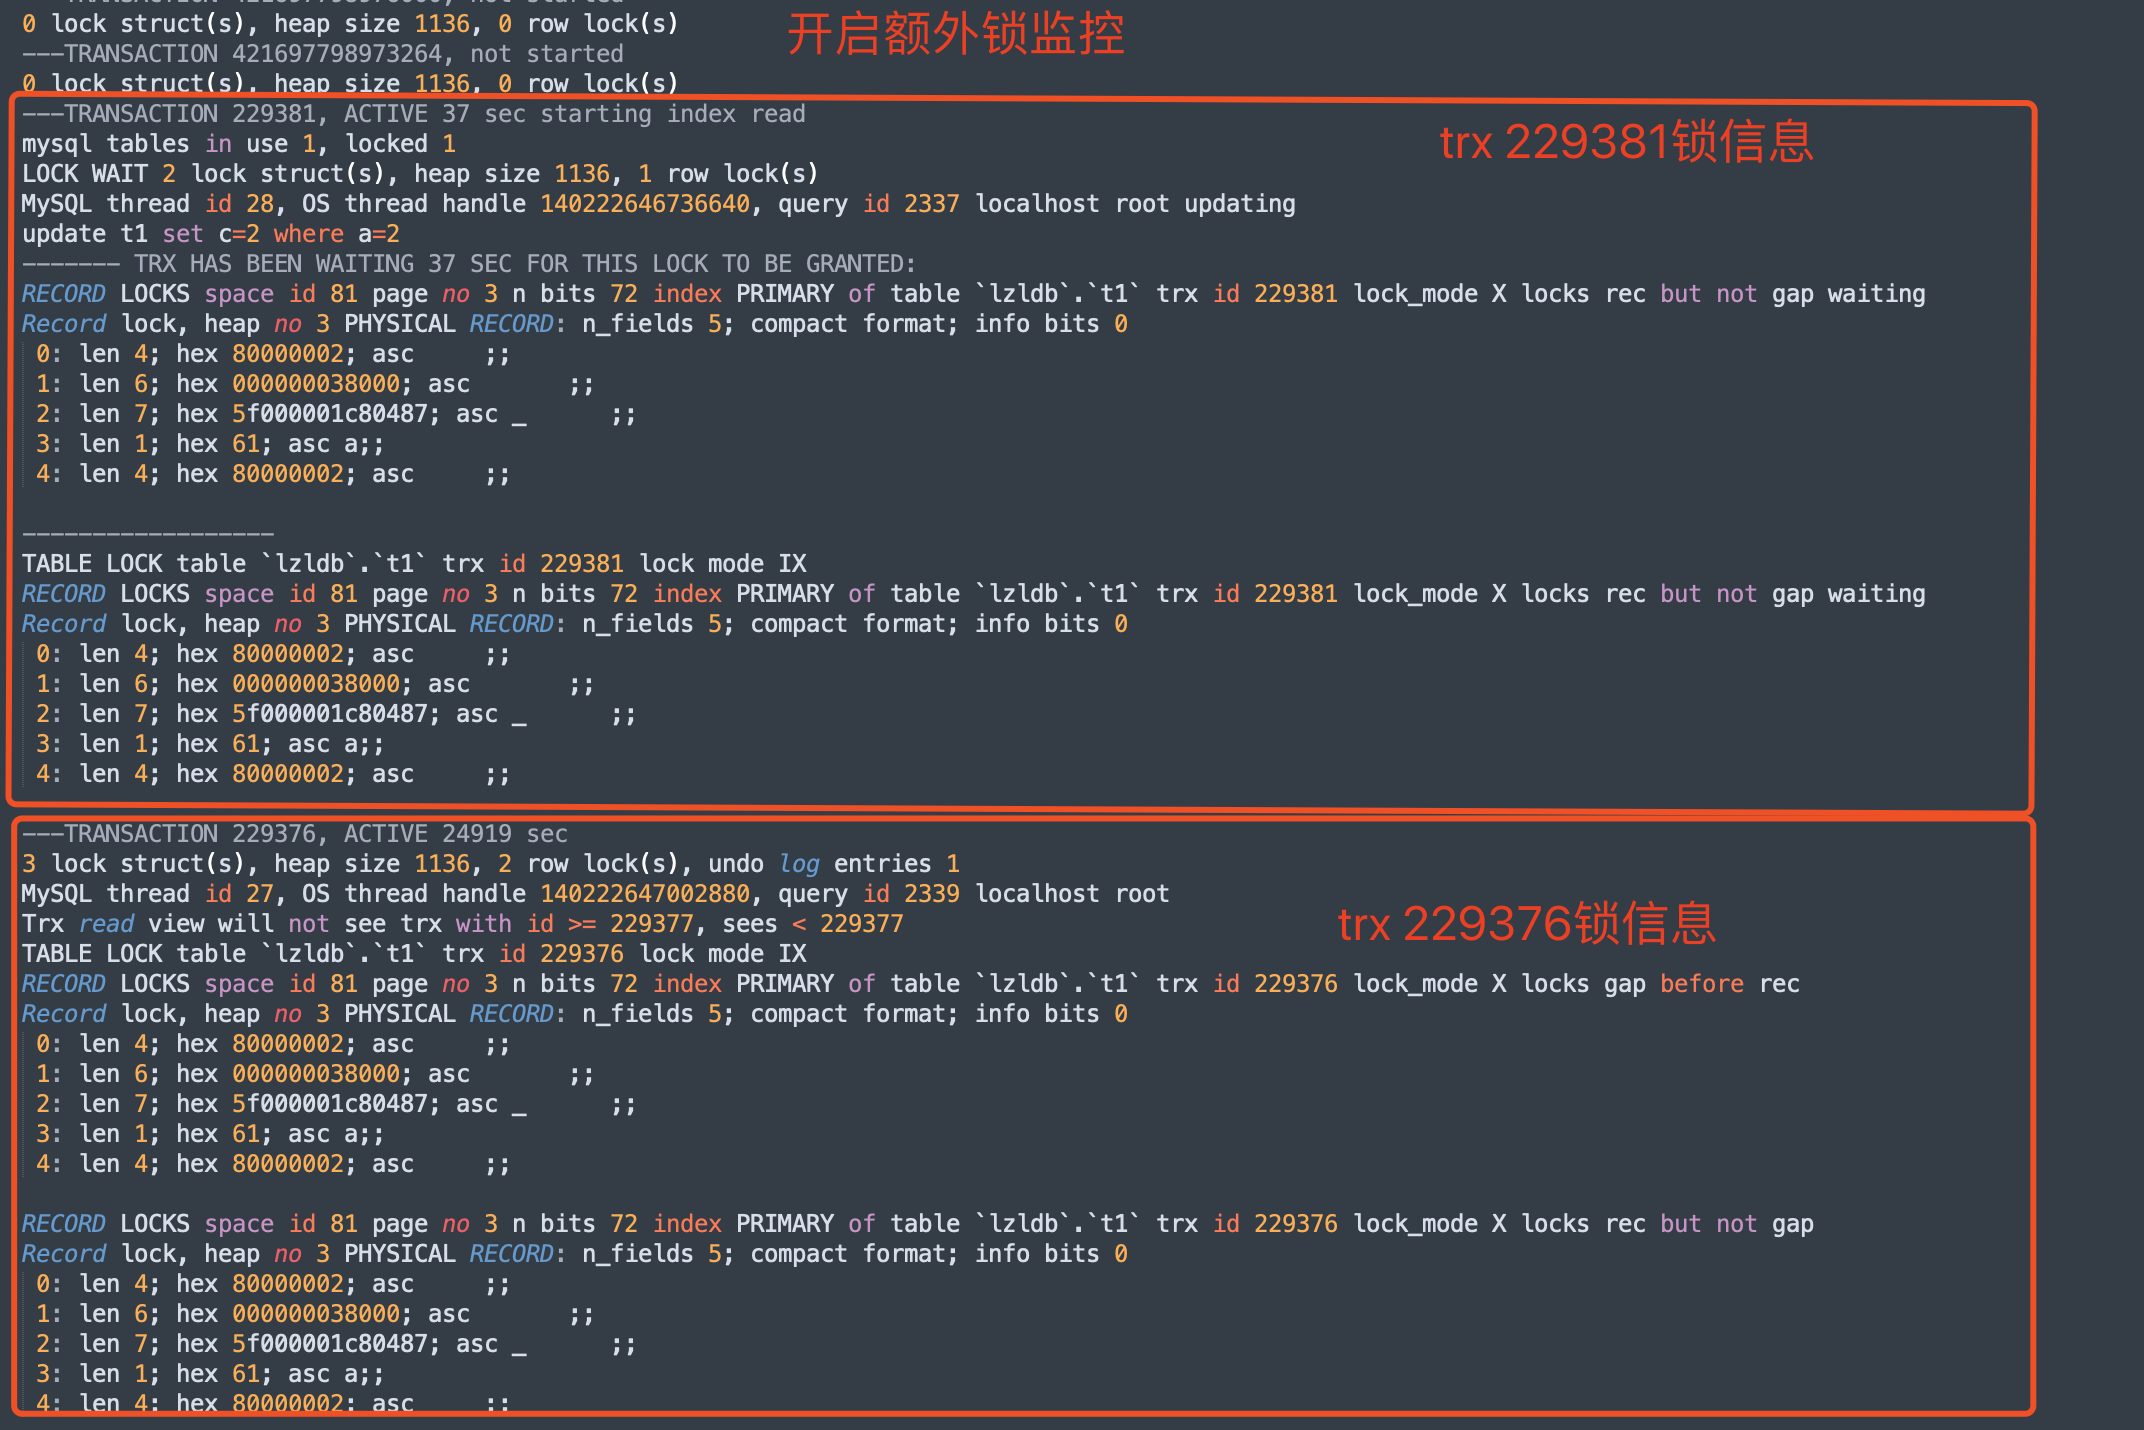
InnoDB Lock Monitor monitoring information
Compared with the output after standard monitoring and lock opening monitoring, the lock information of lock monitoring transaction is significantly more
In this test, only 2 sessions competed for row locks
innodb monitor output persistence
Output to error log
innodb_ status_ The output parameter controls whether show engine innodb status is output to the error log
This parameter is a dynamic parameter and is off by default.
SET GLOBAL innodb_status_output=ON;
When this function is enabled, innodb will output stderr of mysqld to log every 15 seconds_ In error, show engine innodb status is actually written to the log every 15s_ error
If you want to print out the additional lock monitoring, you need to print innodb_status_output_locks open
be careful:
1.innodb_status_output is the result of controlling show engine innodb status to print to the error log
2.innodb_status_output_locks is to output additional lock information to show engine innodb status
Output to InnoDB status file
InnoDB status file is the startup parameter of mysqld, - InnoDB status file controls to print show engine innodb status information to InnoDB every 15s_ status. PID file
When the mysql service is shut down normally, InnoDB_ status. The PID file will be deleted. If it is closed abnormally, it may need to be deleted manually
show engine innodb status can be output to the error log or innodb_status.pid file, no matter which way, will consume a small amount of performance. To enable these functions, you need to pay attention to the use of space.
In fact, writing a script and running show engine innodb status regularly has the same effect
innodb monitor Version Description
In mysql5 7 and later are innodb monitor. Related configurations do not need to create tables
In mysql 5.6, start innodb_status_output or innodb_status_output_locks requires create table,
CREATE TABLE innodb_monitor (a INT) ENGINE=INNODB;
CREATE TABLE innodb_lock_monitor (a INT) ENGINE=INNODB;
5.6 there are also Table Monitor and Tablespace Monitor, and 5.7 is no longer available
https://dev.mysql.com/doc/refman/5.7/en/innodb-enabling-monitors.html
https://www.xaprb.com/blog/2007/09/18/how-to-debug-innodb-lock-waits/