1, Configure node node
1. Change the names of several servers (easy to identify)
Server 1: hostnamectl set hostname node1
Server 2: hostnamectl set hostname node2
Server 3: hostnamectl set hostname Apache
After completion, refresh again to see if it is successful
vim /etc/hosts				#Enter the configuration file, add the host name and IP address, and bind them

192.168.75.51 node1
192.168.75.52 node2
192.168.75.53 apache

#After configuration, use the host name specified by ping to check whether it can connect
2. Install elasticsearch
java -version				#Check the current JAVA environment
#openjdk version "1.8.0_131"
#OpenJDK Runtime Environment (build 1.8.0_131-b12)
#OpenJDK 64-Bit Server VM (build 25.131-b12, mixed mode)

rpm -ih elasticsearch-5.5.0.rpm		#rpm installer
After elasticsearch is successfully installed, several directories and configuration files will be generated under the / etc/elasticsearch / file. Elasticsearch YML, modify the configuration file
cd /etc/elasticsearch/
cp elasticsearch.yml{,.bak}				#The configuration file shall be backed up first to prevent problems in subsequent configurations for recovery and renaming
Load daemon
systemctl daemon-reload
systemctl enable elasticsearch.service
After completion, modify the configuration file
vim elasticsearch.yml
17 cluster.name: my-elk-cluster
#Modify the name of the cluster
23 node.name: node1
#Once enabled, configure it as the corresponding host name
33 path.data: /data/elk_data
#Specify data directory
37 path.logs: /var/log/elasticsearch
#Specify log directory
43 bootstrap.memory_lock: false
#Front end frame memory, cancel
55 network.host: 0.0.0.0
#Listen to all addresses
59 http.port: 9200
#Listening port
68 discovery.zen.ping.unicast.hosts: ["node1", "node2"]
#Discover the member addresses in the cluster in the form of unicast

After that, check it again
grep -v "^#" ./elasticsearch.yml

cluster.name: my-elk-cluster
node.name: node1
path.data: /data/elk_data
path.logs: /var/log/elasticsearch
bootstrap.memory_lock: false
network.host: 0.0.0.0
http.port: 9200
discovery.zen.ping.unicast.hosts: ["node1", "node2"]
mkdir -p /data/elk_data		#Create the data directory specified above
chown elasticsearch.elasticsearch /data/elk_data/
#Change the primary group permissions of the directory
systemctl enable --now elasticsearch.service		#Start service
netstat -ntap|grep 9200					#Check whether the port is started
http://192.168.75.51(52):9200/ # View node information
{
"name" : "node1",
"cluster_name" : "my-elk-cluster",
"cluster_uuid" : "GIkCf1XXT7qVqBCNElrSUg",
"version" : {
"number" : "5.5.0",
"build_hash" : "260387d",
"build_date" : "2017-06-30T23:16:05.735Z",
"build_snapshot" : false,
"lucene_version" : "6.6.0"
},
"tagline" : "You Know, for Search"
}
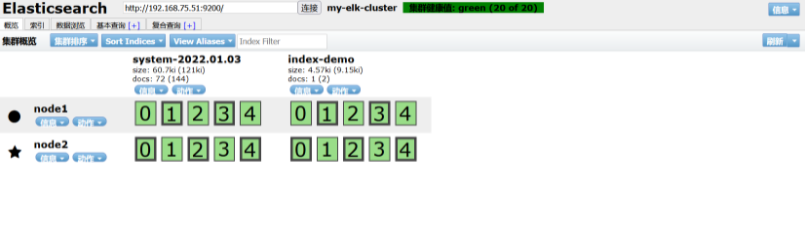
http://192.168.75.51:9200/_cluster/health?pretty # View cluster information
cluster_name "my-elk-cluster"
status "green"
timed_out false
number_of_nodes 2
number_of_data_nodes 2
active_primary_shards 0
active_shards 0
relocating_shards 0
initializing_shards 0
unassigned_shards 0
delayed_unassigned_shards 0
number_of_pending_tasks 0
number_of_in_flight_fetch 0
task_max_waiting_in_queue_millis 0
active_shards_percent_as_number 100
curl http://192.168.75.51:9200/_cluster/stats?pretty # View the cluster status of the detail point
3. Install elasticsearch head plug-in and phantom JS
After Elasticsearch version 5.0, Elasticsearch head plug-in needs to be installed as an independent service and npm Installation of tools (package management T tools of Wodeas).
yum install gcc gcc-c++ make -y #Installation dependent environment
Unzip node and compile the installation
tar zxf node-v8.2.1.tar.gz
cd node-v8.2.1/
./configure
make -j2 && make install
Install phantomjs
tar jxvf phantomjs-2.1.1-linux-x86_64.tar.bz2 -C /usr/local/src/
#Extract the installation package and specify the installation directory
cd /usr/local/src/phantomjs-2.1.1-linux-x86_64/

ln -s /usr/local/src/phantomjs-2.1.1-linux-x86_64/bin/* /usr/local/bin/
#Make a soft connection to the cache command directory for later use
Install elasticsearch head
tar zxvf elasticsearch-head.tar.gz -C /usr/local/src/	#Unzip the file to the specified directory
cd /usr/local/src/elasticsearch-head/

npm install			#erection sequence

vi /etc/elasticsearch/elasticsearch.yml
#Enter the configuration file and add the following statement on the last line
http.cors.enabled: true			#Enable cross domain access support. The default value is false
http.cors.allow-origin: "*"		#Specify that the domain names and addresses allowed for cross domain access are all
systemctl restart elasticsearch.service
#Restart service
systemctl status elasticsearch.service
#View service information
ss -natp | grep 9200
#View port information
Start the server
cd /usr/local/src/elasticsearch-head/
#You must start the service in the installation directory, otherwise the service startup may fail
npm run start &
#Start the service and put it to run in the background
After the above statement is executed, port 9100 will be used. You can view the port information first. The view statement is omitted here
After execution, you can test the web address on the client website
http://192.168.75.51:9100/ # After logging in, the address of the cluster in the my elk cluster line displays the bit localhost:9200, which needs to be modified to add 9100 to the IP address of your cluster
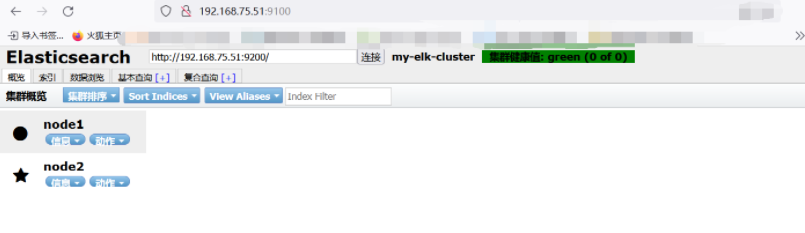
It has not been accessed yet, so now it shows that there is no access record
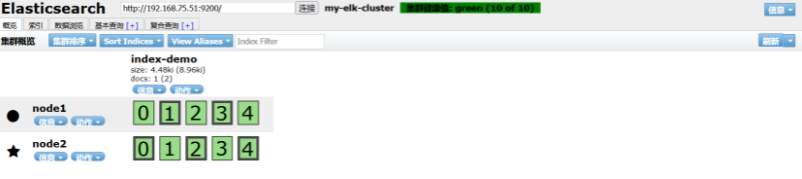
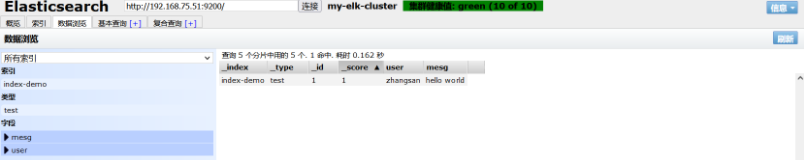
curl -X PUT 'localhost:9200/index-demo/test/1?pretty&pretty' -H 'content-Type: application/json' -d '{"user":"zhangsan","mesg":"hello world"}'
#Add an access record
After adding, refresh the page. You can find that it has changed. It is a copy and five pieces. You can see the access record we just added on the data browsing page
2, Configuring apache nodes
1. Install logstash
Install environment configuration first
yum install httpd -y
rpm -ivh logstash-5.5.1.rpm		#rpm installation software
cd /usr/share/logstash/			#Move to the installation directory of the program
ln -s /usr/share/logstash/bin/logstash /usr/local/bin/
#Make a soft connection to the cache command directory for later use
systemctl start httpd		#Start httpd
netstat -natp | grep 80		#Check whether it is on
format conversion
logstash -e 'input { stdin{} } output { stdout{} }'
#The input adopts standard input and is converted to another standard output display
logstash -e 'input { stdin{} } output { stdout{ codec=>rubydebug } }'
#Input results www.baidu.com com
{
    "@timestamp" => 2022-01-03T10:57:30.972Z,
      "@version" => "1",
          "host" => "apache",
       "message" => "www.baidu.com"
}
#Set the format of the input web address to the format of Rubydebug, so that the next component can receive it.
2. Modify profile
Modify file permissions
chmod o+r /var/log/messages #Add read permissions for other users
Customize a file to define the captured and output objects
vim system.conf

input {
#Define a grab object
       file{
       #Captured file form
        path => "/var/log/messages"
        #Location is system log
        type => "system"
        #Log type
        start_position => "beginning"
        #Start at the beginning
        }
      }

output {
#output
        elasticsearch {
        #Output to es database
          hosts => ["192.168.75.51:9200"]
          #Server location for output
          index => "system-%{+YYYY.MM.dd}"
          #Output index and timestamp
          }
        }
systemctl restart logstash.service #Restart it
After restarting, go back to the website to check:
New records have been added to the index, data browsing, etc. Don't take screenshots one by one
3, Visual data
1. Install kibana
Install kibana on node1 host
rpm -ivh kibana-5.5.1-x86_64.rpm
cd /etc/kibana/
cp kibana.yml kibana.yml.bak		#Copy a configuration file for backup
vim /etc/kibana/kibana.yml		#Enter the configuration file and open the following command

2 server.port: 5601
7 server.host: "0.0.0.0"		#When on, set the bit to listen to all
21 elasticsearch.url: "http://192.168.75.51:9200"
	#Where kibana and es dock
30 kibana.index: ".kibana"		#Open kibana's own index
Open kibana
systemctl start kibana.service
systemctl enable kibana.service
Visit kibana
http://192.168.75.51:5601/
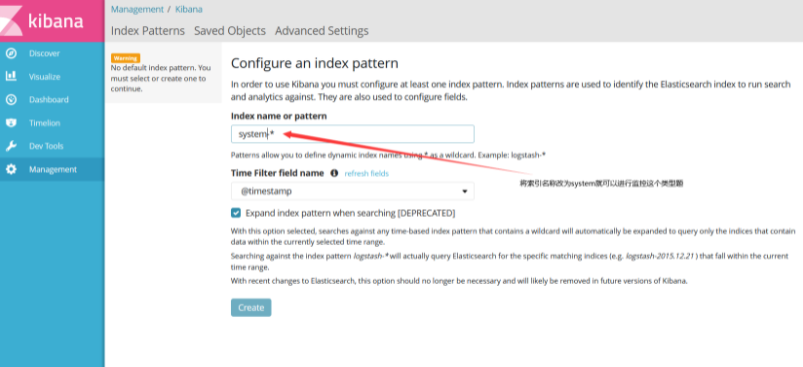
When the input is complete, click create
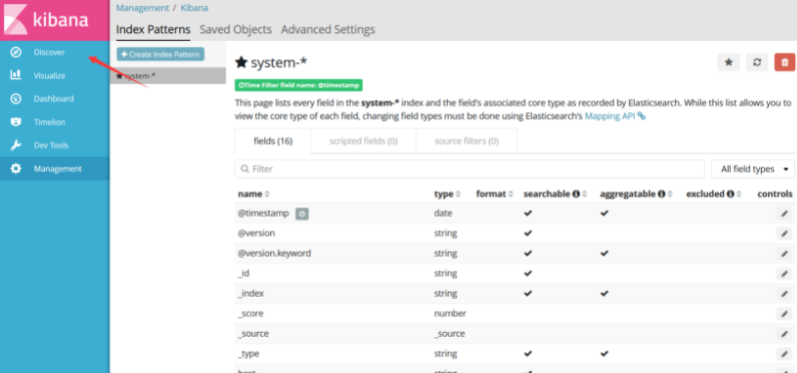
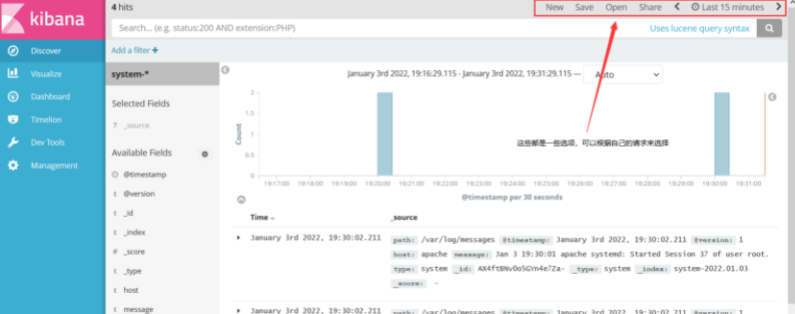
Click discover to see the discovered data source
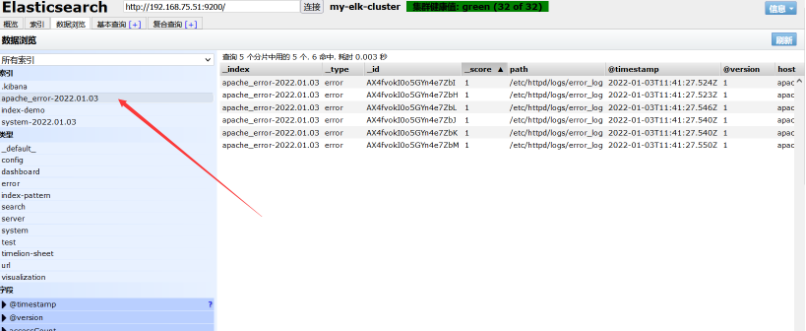
2. View the log file of apache host
Configure on apache server
cd /etc/logstash/conf.d/
vim apache_log.conf
input {
       file{
        path => "/etc/httpd/logs/access_log"
        type => "access"
        start_position => "beginning"
        }
       file{
        path => "/etc/httpd/logs/error_log"
        type => "error"
        start_position => "beginning"
        }

      }
output {
        if [type] == "access" {
        elasticsearch {
          hosts => ["192.168.75.51:9200"]
          index => "apache_access-%{+YYYY.MM.dd}"
          }
        }
        if [type] == "error" {
        elasticsearch {
          hosts => ["192.168.75.51:9200"]
          index => "apache_error-%{+YYYY.MM.dd}"
          }
		}
		}
After apache log collection is enabled, perform the following operations
/usr/share/logstash/bin/logstash -f apache_log.conf
#Specify logstash to collect apache logs
After returning to the page, you can see that apache logs have been recorded in the log information