summary
Rendering, data can be panned to view history

build.gradle
implementation 'com.github.lecho:hellocharts-library:1.5.8@aar'
layout
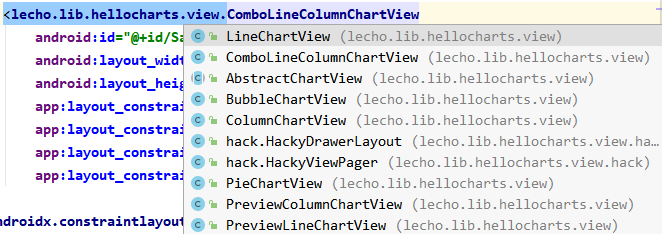
Add corresponding chart controls directly to the layout
<lecho.lib.hellocharts.view.LineChartView
    android:id="@+id/ChartLine"
    android:layout_width="0dp"
    android:layout_height="300dp"
    android:padding="6dp"/>
Common chart types

LineChartView
PointValue
Data pointvalue of each point on the chart (float x, float y)
The first parameter represents the position of the point, and the second parameter represents the data on the point. If there are multiple polylines, you need to define different pointvalues for the same position of each polyline
PointValue point1 = new PointValue(0, 1000);
PointValue point2 = new PointValue(1, 1500);
PointValue point1 = new PointValue(0, 1200);
PointValue point2 = new PointValue(1, 1600);
setLabel() can define display text for data points
point1.setLabel("202101");
example
List<PointValue> valuesR = new ArrayList<>();
List<PointValue> valuesS = new ArrayList<>();
for (int i = 0; i < dataEntities.size(); i++) {
    DataEntity dataEntity = dataEntities.get(i);
    if (dataEntity.getDataR() < 3000 || dataEntity.getDataS() < 3000)
        continue;
    valuesR.add(new PointValue(i, dataEntity.getDataR()).setLabel(String.valueOf(dataEntity.getDataR())));
    valuesS .add(new PointValue(i, dataEntity.getDataS()).setLabel(String.valueOf(dataEntity.getDataS())));
}
Skip if the data is too small. The data is not loaded into the data point set, but the i index will increase and large intervals will appear on the polyline. If you don't want this to happen, replace the for loop with a foreach loop, and then manually control the growth of i.
Line
Define the data and color on the line
Constructor passes in a list containing PointValue. If there are several polylines, create several and bind different point data lists
List<Line> lines = new ArrayList<>();
lines.add(new Line(valuesR).setColor(Color.RED).setCubic(false).setHasLabelsOnlyForSelected(true));
lines.add(new Line(valuesS).setColor(Color.BLUE).setCubic(false).setHasLabelsOnlyForSelected(true));
Common attribute methods
- setColor() # sets the polyline color
- setCubic(true) # polyline is smooth, that is, curve or polyline
- setShape() # polyline has three kinds of data point shapes: valueshape Square valueshape Circle valueshape Diamond (diamond)
- setFilled(false) # whether to fill the area of the curve
- Whether to add remarks to the data coordinates of setHasLabels(true) # curve
- setHasLabelsOnlyForSelected(true) # same as above, but only click the data coordinate to prompt the data, but if this property is set, the above property will become invalid
- setHasLines(true) # whether to display lines. If it is false, only points will be displayed
- setHasPoints(true) # whether to display dots. If false, each data point is a large dot
Axis
X axis
List<AxisValue> xValue = new ArrayList<>();
for(int i = 0; i < dataEntities.size(); i++){
    DataEntity dataEntity = dataEntities.get(i);
    xValue.add(new AxisValue(i).setLabel(dataEntity .getDate()));
}
Axis axisX = new Axis();
axisX.setHasTiltedLabels(true);
axisX.setTextColor(Color.GRAY);
axisX.setValues(xValue);
Y axis
List<AxisValue> yValue = new ArrayList<>();
for(int i = 0; i < 8000; i = i + 1000){
    yValue.add(new AxisValue(i).setLabel(String.valueOf(i)));
}
Axis axisY  = new Axis();
axisY.setTextColor(Color.GRAY);
axisY.setValues(yValue);
axisY.setHasLines(true);
LineChartData data = new LineChartData();
data.setLines(lines);
data.setAxisXBottom(axisX);
data.setAxisYLeft(axisY);
AxisValue
Create instance
AxisValue v = new AxisValue(i).setLabel(String.valueOf(i));
Common attribute methods
- setHasTiltedLabels(true) # axis font is italic
- setValues() # populates the data list
- setHasLines(true) # whether to display guides
LineChartData
Add the above polyline containing the point data list to LineChartData and bind it to the chart control
Chart
//Set whether translation is allowed and the direction of translation
bindingView.chartLine.setContainerScrollEnabled(true, ContainerScrollType.HORIZONTAL);
//Fill data
bindingView.chartLine.setLineChartData(data);
You must set the view size to pan
//Instantiate a new ViewPort constructor and pass in the default maximum view after filling data
Viewport viewport = new Viewport(bindingView.chartLine.getMaximumViewport());
//Sets the display of the y-axis
viewport.top = MyApplication.getSharedPreferences().getInt("max", 8000);
viewport.bottom = MyApplication.getSharedPreferences().getInt("min", 3000);
//Be sure to set the maximum view range first
bindingView.chartLine.setMaximumViewport(viewport); //Chart maximum view
//Sets the display of the x-axis
viewport.right = MyApplication.getSharedPreferences().getInt("chart_right", 7);
viewport.left = 0;
//Finally, set the currently displayed view range
bindingView.chartLine.setCurrentViewport(viewport); //Chart current view
Complete code
private void initChart(List<DataEntity> dataEntities) {
    List<PointValue> valuesR = new ArrayList<>();
    List<PointValue> valuesS = new ArrayList<>();
    List<AxisValue> xValue = new ArrayList<>();
    List<AxisValue> yValue = new ArrayList<>();
    for (int i = 0; i < dataEntities.size(); i++) {
        DataEntity dataEntity = dataEntities.get(i);
        if (dataEntity.getDataR() < MyApplication.getSharedPreferences().getInt("min", 3000) || dataEntity.getDataS() < MyApplication.getSharedPreferences().getInt("min", 3000))
            continue;
        valuesR.add(new PointValue(i, dataEntity .getDataR()).setLabel(String.valueOf(dataEntity .getDataR())));
        valuesS.add(new PointValue(i, dataEntity .getDataS()).setLabel(String.valueOf(dataEntity .getDataS())));
        xValue.add(new AxisValue(i).setLabel(dataEntity .getDate()));
    }
    for (int i = 0; i < MyApplication.getSharedPreferences().getInt("salary_max", 8000); i = i + 500) {
        yValue.add(new AxisValue(i).setLabel(String.valueOf(i)));
    }
    List<Line> lines = new ArrayList<>();
    lines.add(new Line(valuesR).setColor(Color.RED).setCubic(false).setHasLabelsOnlyForSelected(true));
    lines.add(new Line(valuesS).setColor(Color.BLUE).setCubic(false).setHasLabelsOnlyForSelected(true));
    Axis axisX = new Axis();
    axisX.setHasTiltedLabels(true);
    axisX.setTextColor(Color.GRAY);
    axisX.setValues(xValue);
    Axis axisY = new Axis();
    axisY.setTextColor(Color.GRAY);
    axisY.setValues(yValue);
    axisY.setHasLines(true);


    LineChartData data = new LineChartData();
    data.setLines(lines);
    data.setAxisXBottom(axisX);
    data.setAxisYLeft(axisY);
    bindingView.chartLine.setContainerScrollEnabled(true, ContainerScrollType.HORIZONTAL);
    bindingView.chartLine.setLineChartData(data);
    //Sets the size of the chart display
    Viewport viewport = new Viewport(bindingView.chartLine.getMaximumViewport()); //Default maximum view after filling data
    viewport.top = MyApplication.getSharedPreferences().getInt("max", 8000);
    viewport.bottom = MyApplication.getSharedPreferences().getInt("min", 3000);
    bindingView.chartLine.setMaximumViewport(viewport); //Chart maximum view
    viewport.right = MyApplication.getSharedPreferences().getInt("chart_right", 7);
    viewport.left = 0;
    bindingView.chartLine.setCurrentViewport(viewport); //Chart current view
}