php-ml is a machine learning library written in PHP. Although we know that Python or C++ provides more libraries for machine learning, in fact, most of them are slightly more complex and configurable, which makes many novices desperate. php-ml is a machine learning library, although it does not have a very large algorithm, but it has the most basic machine learning, classification and other algorithms, our small company to do some simple data analysis, prediction and so on are enough. In our project, the pursuit should be cost-effective, rather than excessive efficiency and precision. Some algorithms and libraries seem very powerful, but complex code and configuration can drag our projects down if we consider speeding up and our technicians don't have machine learning experience. And if we are a simple machine learning application, then the cost of studying complex libraries and algorithms is obviously higher. Moreover, the project has strange problems. Can we solve them? What if demand changes? I believe that everyone has had this experience: doing, the program suddenly reported errors, how can they not understand the reasons, go to Google or Baidu search, only to find a qualified question, asked five or ten years ago, and then zero reply... Therefore, it is necessary to choose the simplest, most efficient and cost-effective method. php-ml is not slow (change php7 quickly), and the accuracy is good, after all, the algorithm is the same, and PHP is based on C. What bloggers are most unaccustomed to is comparing python with Java and PHP in terms of performance and scope of application. Really want performance, please take C development. If you really want to pursue the scope of application, please use C, or even compile...
First, we need to download the library to use it. This library file can be downloaded from GitHub (https://github.com/php-ai/php-ml). Of course, composer is more recommended to download the library and configure it automatically.
When downloaded, we can take a look at the library's documents, which are all simple examples. We can build a file ourselves and try it out. It's easy to understand. Next, let's test the actual data. One data set is Iris stamen data set, the other one is lost records, so I don't know what the data is about...
There are three different classifications of Iris stamen data:
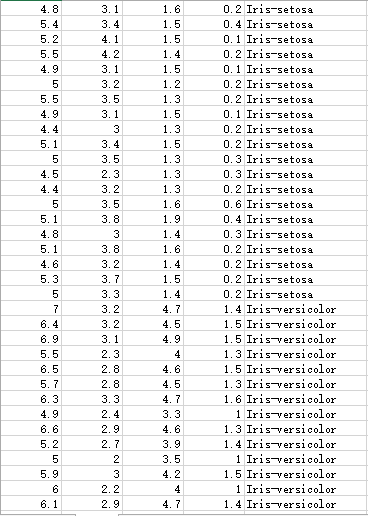
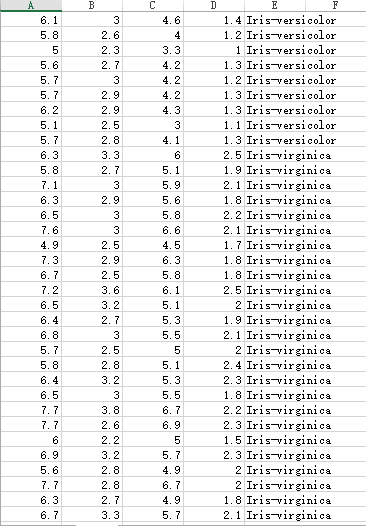
The decimal point of an unknown data set is comma, so it needs to be processed when calculating:

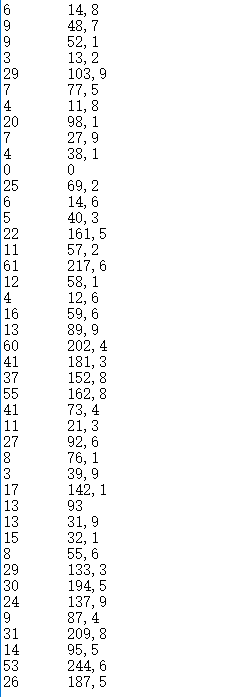
Let's deal with unknown data sets first. First, the file name of our unknown dataset is data.txt. This data set can be plotted as an x-y line graph. Therefore, we first draw the original data into a broken line graph. Because the x-axis is relatively long, we only need to see its approximate shape.
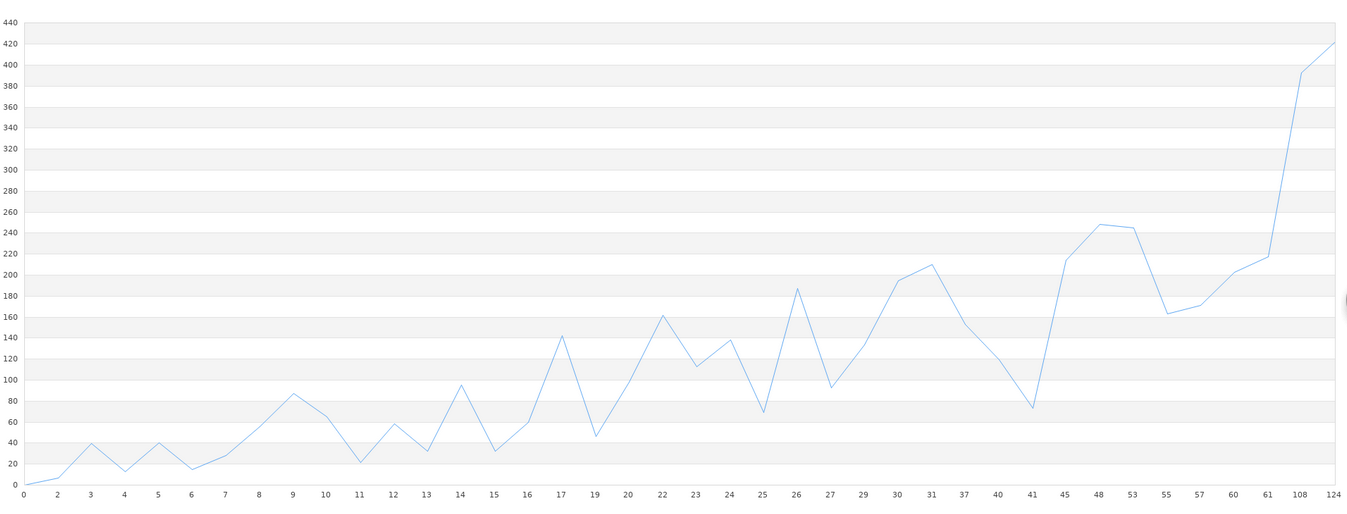
The drawing is based on the jpgraph Library of php, and the code is as follows:
 1 <?php
 2 include_once './src/jpgraph.php';
 3 include_once './src/jpgraph_line.php';
 4
 5 $g = new Graph(1920,1080);//jpgraph Drawing operation of
 6 $g->SetScale("textint");
 7 $g->title->Set('data');
 8
 9 //Processing of documents
10 $file = fopen('data.txt','r');
11 $labels = array();
12 while(!feof($file)){
13     $data = explode('    ',fgets($file));
14     $data[1] = str_replace(',','.',$data[1]);//Data processing, the comma in the data is amended to decimal point
15     $labels[(int)$data[0]] = (float)$data[1];//Here, the data is stored in an array in the form of keys, which makes it easy for us to sort by keys.
16 }
17
18 ksort($labels);//Ranking of key sizes
19
20 $x = array();//x Axis Representation Data
21 $y = array();//y Axis Representation Data
22 foreach($labels as $key=>$value){
23     array_push($x,$key);
24     array_push($y,$value);
25 }
26
27
28 $linePlot = new LinePlot($y);
29 $g->xaxis->SetTickLabels($x);
30 $linePlot->SetLegend('data');
31 $g->Add($linePlot);
32 $g->Stroke();
Comparing with the original map, let's study it next. We use Least Squars in php-ml to learn. The output of our test needs to be stored in a file so that we can draw a comparison chart. The learning code is as follows:
 1 <?php
 2     require 'vendor/autoload.php';
 3
 4     use Phpml\Regression\LeastSquares;
 5     use Phpml\ModelManager;
 6
 7     $file = fopen('data.txt','r');
 8     $samples = array();
 9     $labels = array();
10     $i = 0;
11     while(!feof($file)){
12         $data = explode('    ',fgets($file));
13         $samples[$i][0] = (int)$data[0];
14         $data[1] = str_replace(',','.',$data[1]);
15         $labels[$i] = (float)$data[1];
16         $i ++;
17     }
18     fclose($file);
19
20     $regression = new LeastSquares();
21     $regression->train($samples,$labels);
22
23     //this a Arrays are processed according to our original data. x Values given, for testing purposes.
24     $a = [0,2,3,4,5,6,7,8,9,10,11,12,13,14,15,16,17,18,20,22,23,24,25,26,27,29,30,31,37,40,41,45,48,53,55,57,60,61,108,124];
25     for($i = 0; $i < count($a); $i ++){
26         file_put_contents("putput.txt",($regression->predict([$a[$i]]))."\n",FILE_APPEND); //File in an additional form
27     }
After that, we will read out the data stored in the file and draw a graph. First, we will paste the final effect map.
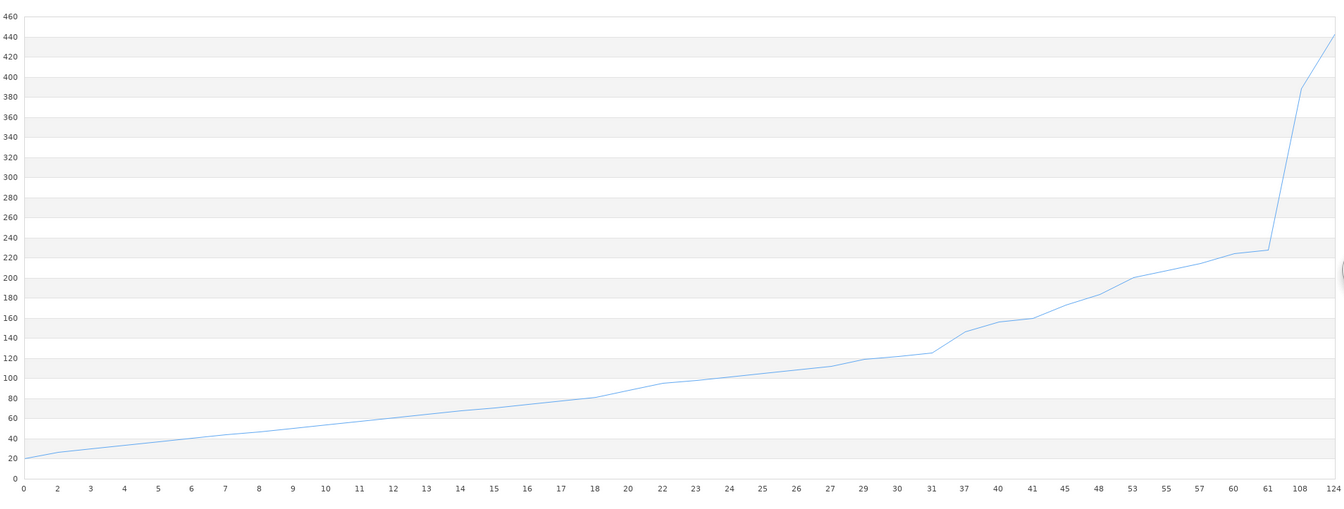 The code is as follows:
 1 <?php
 2 include_once './src/jpgraph.php';
 3 include_once './src/jpgraph_line.php';
 4
 5 $g = new Graph(1920,1080);
 6 $g->SetScale("textint");
 7 $g->title->Set('data');
 8
 9 $file = fopen('putput.txt','r');
10 $y = array();
11 $i = 0;
12 while(!feof($file)){
13     $y[$i] = (float)(fgets($file));
14     $i ++;
15 }
16
17 $x = [0,2,3,4,5,6,7,8,9,10,11,12,13,14,15,16,17,18,20,22,23,24,25,26,27,29,30,31,37,40,41,45,48,53,55,57,60,61,108,124];
18
19 $linePlot = new LinePlot($y);
20 $g->xaxis->SetTickLabels($x);
21 $linePlot->SetLegend('data');
22 $g->Add($linePlot);
23 $g->Stroke();
It can be found that the graphics are still quite large, especially in the part where the graphics have more jagged teeth. However, after all, this is 40 sets of data, we can see that the general trend of graphics is consistent. The accuracy of general libraries is very low when the amount of data is low. In order to achieve high accuracy, a large amount of data is needed, and more than ten thousand data are necessary. If this data requirement is not met, it would be futile for us to use any library. Therefore, in the practice of machine learning, the real difficulty lies not in the low accuracy, complex configuration and other technical problems, but in the insufficient amount of data or the low quality (too much useless data in a group of data). Pre-processing of data is also necessary before machine learning.
Next, let's test the stamen data. There are three kinds of classifications. Since we downloaded CSV data, we can use php-ml officially provided method to manipulate CSV files. This is a classification problem, so we choose the SVC algorithm provided by the library to classify. We named the filename of the stamen data Iris.csv. The code is as follows:
 1 <?php
 2 require 'vendor/autoload.php';
 3
 4 use Phpml\Classification\SVC;
 5 use Phpml\SupportVectorMachine\Kernel;
 6 use Phpml\Dataset\CsvDataset;
 7
 8 $dataset = new CsvDataset('Iris.csv' , 4, false);
 9 $classifier = new SVC(Kernel::LINEAR,$cost = 1000);
10 $classifier->train($dataset->getSamples(),$dataset->getTargets());
11
12 echo $classifier->predict([$argv[1],$argv[2],$argv[3],$argv[4]]);//$argv Is a command line parameter, debugging this program is more convenient to use the command line
Is it simple? Just 12 lines of code. Next, let's test it. According to the figure we posted above, when we input 5.3.3 1.4 0.2, the output should be Iris-setosa. Let's take a look at:

Look, at least we input an existing data and get the right result. But what about the data we didn't have in the original data set? We tested two groups:

From the data of the two graphs we posted before, we can see that the data we entered does not exist in the data set, but the classification is reasonable according to our preliminary observation.
Therefore, this machine learning library is adequate for most people. And most people who despise this library, despise that library, talk about performance, are basically not big bulls. The real Daniel has been busy fishing for money, or is doing academic research and so on. We should master the algorithm more, understand the truth and mystery, rather than exaggerate. Of course, this library is not recommended for large projects, but for small projects or individual projects.
jpgraph relies only on GD libraries, so it can be used after downloading references, and a lot of code is put on drawing graphics and initial data processing. Because of the excellent encapsulation of libraries, learning code is not complicated. The small partners who need all the code or test data set can leave messages or private messages, etc. I provide the complete code, decompression is ready to use (blog park space is too small, not suitable for uploading files). Bloggers are also learning and working with you.