1, Monitoring management
By introducing Spring Boot starter actor, we can use the application monitoring and management functions in the quasi production environment provided by Spring Boot. We can operate through HTTP, JMX and SSH protocols to automatically obtain audit, health and index information.
Steps:
1. Introduce spring boot starter actuator
<dependency>
    <groupId>org.springframework.boot</groupId>
    <artifactId>spring-boot-starter-actuator</artifactId>
</dependency>
2. Access the monitoring endpoint through http
Create the project, introduce the actor, and start the project
Project POM XML configuration file:
<?xml version="1.0" encoding="UTF-8"?>
<project xmlns="http://maven.apache.org/POM/4.0.0" xmlns:xsi="http://www.w3.org/2001/XMLSchema-instance"
         xsi:schemaLocation="http://maven.apache.org/POM/4.0.0 https://maven.apache.org/xsd/maven-4.0.0.xsd">
    <modelVersion>4.0.0</modelVersion>
    <parent>
        <groupId>org.springframework.boot</groupId>
        <artifactId>spring-boot-starter-parent</artifactId>
        <version>1.5.12.RELEASE</version>
        <relativePath/> <!-- lookup parent from repository -->
    </parent>
    <groupId>com.njf</groupId>
    <artifactId>spring-boot-16-actuator</artifactId>
    <version>0.0.1-SNAPSHOT</version>
    <name>spring-boot-16-actuator</name>
    <description>Demo project for Spring Boot</description>
    <properties>
        <java.version>1.8</java.version>
    </properties>
    <dependencies>
        <dependency>
            <groupId>org.springframework.boot</groupId>
            <artifactId>spring-boot-starter-actuator</artifactId>
        </dependency>
        <dependency>
            <groupId>org.springframework.boot</groupId>
            <artifactId>spring-boot-starter-web</artifactId>
        </dependency>

        <dependency>
            <groupId>org.springframework.boot</groupId>
            <artifactId>spring-boot-devtools</artifactId>
            <scope>runtime</scope>
            <optional>true</optional>
        </dependency>
        <dependency>
            <groupId>org.springframework.boot</groupId>
            <artifactId>spring-boot-starter-test</artifactId>
            <scope>test</scope>
        </dependency>
    </dependencies>

    <build>
        <plugins>
            <plugin>
                <groupId>org.springframework.boot</groupId>
                <artifactId>spring-boot-maven-plugin</artifactId>
            </plugin>
        </plugins>
    </build>

</project>
Start project:

After using the actor, many mappings will be automatically added, which are the request information for monitoring and management.
2, Monitoring and managing endpoints
Monitoring and managing endpoints:

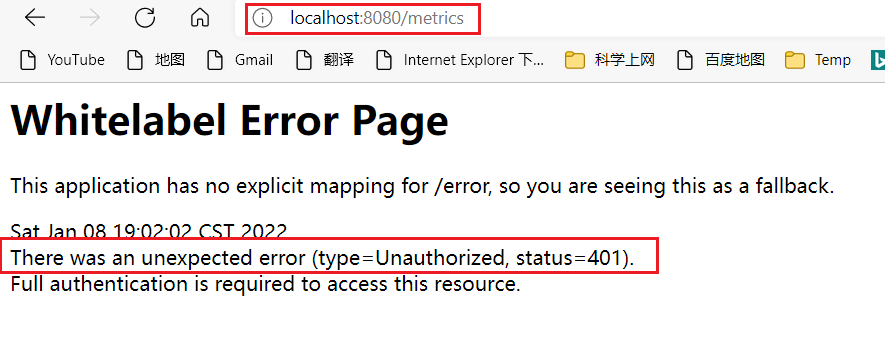
By default, these accesses are protected and cannot be accessed directly. They can be accessed in application You can access it by setting the following properties in properties.

management.security.enabled=false
(1) health: monitor the health status of the application

(2) auditevents: audit events

(3) beans: information of all beans

(4) info: current application information

It can be found in application Configure info information in properties
info.app.id=Hello
info.app.verion=1.0.0
You can also configure git information (you can refer to GitProperties class)
Create GIT Properties and configuration information;
git.branch=master
git.commit.id=njf
git.commit.time=2022-01-08 12:12:56
(5) dump: thread status information in the application

(6) autoconfig: all autoconfig information


(7) heapdump: download the current memory snapshot
(8) trace: tracking information (latest http request)

(9) mappings: apply @ RequestMapping mapping mapping path, which Controller handles it

(10) metrics: applied indicators

(11) env: current environmental information

(12) loggers: log related information

(13) configprops: all configuration attributes

(14) shutdown: remotely close the current application (closed by default)
In application Enable this function in properties: (shutdown and POST submission can be performed, and this endpoint is closed by default)
#To close the application remotely, you need to send a post request
endpoints.shutdown.enabled=true
You can use Postman to send a POST} request to test:
http://localhost:8080/shutdown
3, Custom endpoint information
Custom endpoints are generally set through endpoints + endpoint name + attribute name
Modify Endpoints  id(endpoints.beans.id=mybeans)
Enable remote application shutdown function( endpoints.shutdown.enabled=true)
Close endpoint( endpoints.beans.enabled=false)
Example:
#Customized endpoint information. Only one id and path can take effect
endpoints.beans.id=mybean
endpoints.beans.path=/bean
#Disable endpoint information
endpoints.beans.enabled=false
Custom endpoint access root path:
#Custom endpoint access root path
management.context-path=/manage
The endpoint access path is http://localhost:8080/manage/beans .
This allows permission control in combination with Spring Security.
Access port of custom endpoint:
#Customize the access port of the endpoint. If it is - 1, it means that the endpoint access is closed
management.port=8181
Close all endpoints and start endpoints on demand:
#Close all endpoints and start endpoints on demand
endpoints.enabled=false
endpoints.beans.enabled=true
4, Customize HealthIndicator
1. health endpoint

By default, there is only the health status of components in the current application. Spring Boot also provides some good component health status by default.

2. Take Redis as an example
(1) add Redis scenario initiator
<dependency>
    <groupId>org.springframework.boot</groupId>
    <artifactId>spring-boot-starter-data-redis</artifactId>
</dependency>
(2) Redis configuration information
#Configure the host address of redis (the configuration is wrong)
spring.redis.host=localhost
(3) start service

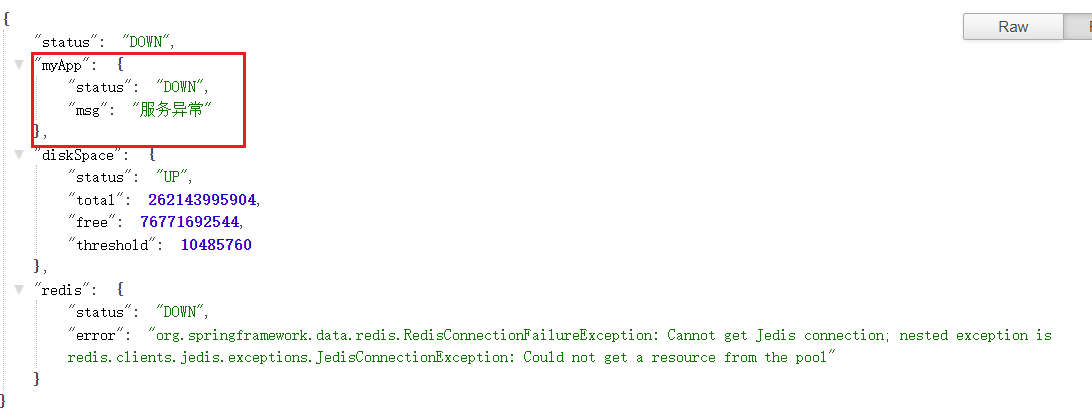
You can see that the Redis connection is abnormal.
SpringBoot provides the RedisHealthIndicator class to check the connection status of Redis.
3. Custom health status indicator
(1) steps to customize the health status indicator:
1,To write an indicator, you must implement HealthIndicator Interface
2,The name of the indicator  xxxHealthIndicator
3,Add to container
(2) custom health status indicator:
@Component
public class MyAppHealthIndicator implements HealthIndicator {


    @Override
    public Health health() {
        //Custom check method

        //Health.up().build(); Represents application health
        Health build = Health.down().withDetail("msg", "Service exception").build();

        return build;
    }
}
Test:
