Sleuth, Zipkin and Brave
Let's talk about the relationship among spring cloud, sleuth, Zipkin and brake.
First of all, you may have more contact with Spring Cloud Sleuth, which is the Spring framework family (why not call it the Spring Cloud framework family here? In fact, this is because Sleuth, like other components in the Spring framework, is very flexible, that is, it can cooperate with other Spring Cloud components, or it can not be used with other Spring Cloud components, but only be used as a trace tracking system framework for trial.) It provides trace tracking for the whole microservice framework system.
About the difference between Trace and Log, two articles are recommended:
Logging vs Tracing vs Monitoring
Logging vs. tracing
Secondly, Zipkin is a complete framework for collecting, analyzing and presenting Trace data. The overall architecture of Zipkin is shown in the figure:
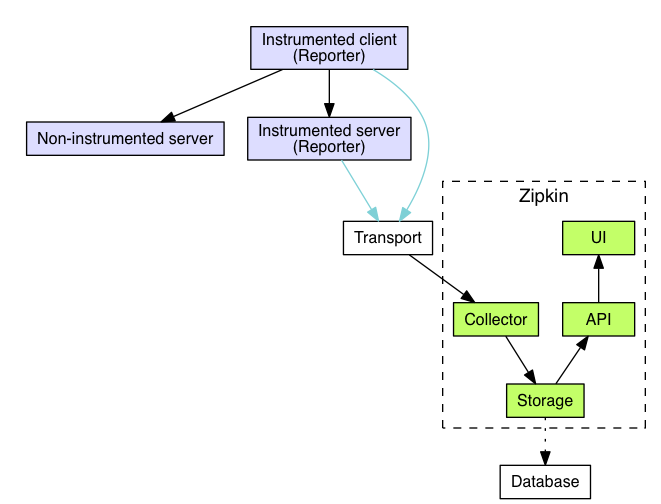
On the way, it can be seen that if ELK stack is used as the framework for log storage and analysis, Zipkin plays a role very similar to that of Logstash and Kibana, that is, 1) complete the collection of trace data, and 2) realize the visual tracking of trace.
Finally, brave. Brave's official statement is:
Brave is a library used to capture latency information about distributed operations. It reports this data to Zipkin as spans.
From the literal meaning of this sentence, brake is a front end of Zipkin, which is similar to the Instrumented Client on the way of Zipkin architecture. However, there is another sentence in brave's official statement:
Brave's dependency-free tracer library works against JRE6+.
This shows that, first of all, brake is a tracer library that provides a tracer interface. For its background, Zipkin can be used or extended to other backend.
After all this, what is the relationship between Sleuth, Zipkin and Brave? Their relationship is as follows:
- Sleuth uses brake as the tracer library
- Sleuth may not use Zipkin
be careful: Sleuth involved in this article is version 2.0 +, and sleuth earlier than version 2.0 does not use brake. Basically, except for annotations, all the underlying interfaces involved in customization are inconsistent with this article.
Some basic concepts in brake
Basic concepts
Generally speaking, trace tracking involves two concepts, one is trace and the other is span. Tracer can be regarded as the whole chain in the process of logic execution. For example, the collection of all processing logic in a login process is a tracer, and span is the basic unit of trace tracking. For example, the process of accessing the database in the login process can be regarded as a span. Refer to the following example code:
1 2 3 4 5 6 7 8 9 | |
Suppose the above code is a login process. We want to track the performance of the whole login process. For each login() process, it is a trace we want to track, while for the dbAccess() and saveSession() functions, it is two spans in a trace; For dbAccess(), the saveObject() function is its child span. However, for the above basic concepts, we describe a trace that we want to track. Why do we use the expression that we want to track? This is because trace represents an execution process and a collection of all spans. If expressed in a graph, a trace can be expressed as:
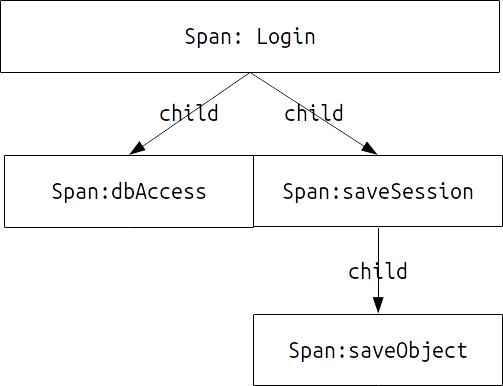
As shown in the figure, a trace can be regarded as a tree. Each trace has a starting point, that is, a root span, that is, the process we want to track. All other traces are the child span of the root span.
Common data structures and their descriptions in brake
Brake provides a set of tracer tools for trace tracking. Then, the commonly used important classes involved in brake mainly include: Tracing, tracer, Span, TraceContext and Propagation. The important functions of these five categories are as follows:
- Tracing, a tool class, is used to generate an instance of Tracer class. Compared with the Log system, it can be regarded as the LogFactory class in self4j.
- Tracer, also a tool class, is used to generate a span. Compared with the Log system, it is very similar to the Logger class.!! But!!, Different from the Logger, when using brake, it is OK to have a global tracer object in the general system, because in practice, each specific trace is represented by a tree composed of a span.
- Span, a class that actually records the execution information of each function block.
- TraceContext, which records the metadata information class during the execution of trace. In the process of creating a span, the Tracer instance maintains the relationship between spans through the operation of TraceContext. The main information contained in TraceContext includes traceId,spanId, parentId and sampled, respectively, indicate the current trace, the current span, and the parent span of the current span, and whether to sample.
- Propagation is a tool class used to implement TraceContext transfer in trace tracking in distributed environment or cross process conditions.
Create trace and Span in Sleuth
Create a new trace
As mentioned in the previous section, a trace is actually a tree with a span, so creating a trace is actually the process of creating a root span.
Create a new span
The process of creating a Span is particularly simple in Sleuth. Generally speaking, @ NewSpan can be used. For example, the following code
1 2 3 4 5 6 7 8 9 10 11 12 13 14 15 16 17 18 19 20 21 22 23 | |
In the above example, line 19 starts a new span. Meanwhile, since run is the entry code, line 19 actually starts a root span
!!!@ Special instructions for NewSpan!!!
Given the following code:
1 2 3 4 5 6 7 8 9 10 11 12 13 14 15 16 17 18 19 20 21 22 23 24 25 26 27 28 29 | |
In the above code, the run function calls the dbAccess function. Intuitively, the span where the dbAccess function is located should be the child span of the span where the run function is located. But in fact, the actual execution result of the above code is that the span where the dbAccess function and the run function are located is the same span.
TODO: I haven't seen the implementation code of @ NewSpan carefully, but according to the urine of Spring, the proxy should be used. Because it is the same bean, the process of executing the two functions is executed inside the proxy, which bypasses the annotation of dbAccess. This problem is mentioned in the issuse of sleuth's official github. reference resources @NewSpan annotation doesn't work · Issue #617 · spring-cloud/spring-cloud-sleuth · GitHub
So, the question is, how can the dbAccess function be put into a separate Span? The answer is a Scoped Span. See the following code:
1 2 3 4 5 6 7 8 9 10 11 12 13 14 15 16 17 18 19 20 21 22 23 24 25 26 27 28 29 30 31 32 33 34 35 36 37 38 39 40 41 42 43 | |
Lines 29-36 of the code define that a local span is manually created, and the implementation puts the execution process of dbAccess() into another span.
Cross process trace
Finally, sleuth provides an implementation of cross service trace in distributed system environment. How is this cross service trace implemented? What should we do when we implement a cross service trace?
be careful: sleuth and Brake provide support for many different distributed frameworks, such as gRPC, kafka, etc. the official libraries can be preferred. However, for some features, for example, when implementing your own communication protocol based on TCP protocol, if you want to realize trace tracking for the whole link of data processing, you need to implement relevant functions yourself.
Basic principles
The core of brake to realize cross service (or cross thread) trace tracking is through the transmission of core information in TraceContext, that is, traceId, spanId, parentId, If the four attributes of sampled are passed between different services (or processes), cross service tracking can be realized. There is a diagram on the official description of brake and Spring Cloud Sleuth 2.0 + to illustrate how these four attributes are passed. The figure is as follows:
1 2 3 4 5 6 7 8 9 10 11 12 13 14 15 | Client Span Server Span ┌──────────────────┐ ┌──────────────────┐ │ │ │ │ │ TraceContext │ Http Request Headers │ TraceContext │ │ ┌──────────────┐ │ ┌───────────────────┐ │ ┌──────────────┐ │ │ │ TraceId │ │ │ X─B3─TraceId │ │ │ TraceId │ │ │ │ │ │ │ │ │ │ │ │ │ │ ParentSpanId │ │ Extract │ X─B3─ParentSpanId │ Inject │ │ ParentSpanId │ │ │ │ ├─┼─────────>│ ├────────┼>│ │ │ │ │ SpanId │ │ │ X─B3─SpanId │ │ │ SpanId │ │ │ │ │ │ │ │ │ │ │ │ │ │ Sampled │ │ │ X─B3─Sampled │ │ │ Sampled │ │ │ └──────────────┘ │ └───────────────────┘ │ └──────────────┘ │ │ │ │ │ └──────────────────┘ └──────────────────┘ |
This figure is the standard flow of brave's Context delivery for HTTP services. That is, when the client passes the Span, it will fill the above four attributes into the Header of the HTTP Request. The Server side will generate an instance of TraceContext according to the information of these headers, and then pass it to the Span on the Server side. In this way, the delivery of TraceContext is realized, so as to complete cross service tracking.
Simple implementation
1 2 3 4 5 6 7 8 9 10 11 12 13 14 15 16 17 18 19 20 21 22 23 24 25 26 27 28 29 30 31 32 33 34 35 36 37 38 39 40 41 42 43 44 45 46 47 48 49 50 51 52 53 54 55 56 57 58 59 | |
The above code is a simple implementation. The function of the implementation is very simple, that is, the controller obtains the relevant parameters from the request parameters of get, calls the parseTraceContext function to construct a TraceContextOrSamplingFlags, and then creates a new span through the nextSpan(TraceContextOrSamplingFlags) method of Tracer class to complete the transfer.
Complex implementation
The above simple implementation is simple and crude. Each implementation requires the user to parse the relevant data, and then manually create the span. Is there any automation? have It is to implement the Propagation interface by yourself. For the reference implementation of the Propagation interface, you can refer to the built-in function of brake B3Propagation Class. The specific development will not be repeated.