Distributed tracking allows you to track requests in a distributed system. This article does this by understanding how to use Spring Cloud Sleuth and Zipkin.

For a large application that does everything (we usually call it a monolithic application), it's easy to track incoming requests within the application. We can track the log and find out how the request is processed. We don't need to look at anything other than the application log itself.
Over time, individual applications become difficult to scale, handle a large number of requests, and provide customers with new functions as the size of the code base continues to expand. This leads to the decomposition of the monolithic architecture into microservices, which helps to extend individual components and facilitate faster delivery.
But not all that glitters is gold, right? The same is true of microservices. We split the whole single system into micro services, and each request processed by a set of local function calls is now replaced by a set of distributed services. In this way, we lose track of requests that are easy to complete in a single application. Now, to track each request, we have to look at the log of each service and it's hard to correlate.
Therefore, in the case of distributed systems, the concept of distributed tracking helps to track requests.
What is distributed tracking?
Distributed tracking is a mechanism that we can use to track specific requests in the whole distributed system. It allows us to track how requests progress from one system to another to complete user requests.
Key concepts of distributed tracking
Distributed tracking includes two main concepts:
- Tracking ID
- Span number
The tracking id is used to track the incoming request and track it in all composite services to meet the request. Span id spans service calls to track each request received and response issued.
Let's look at the chart.
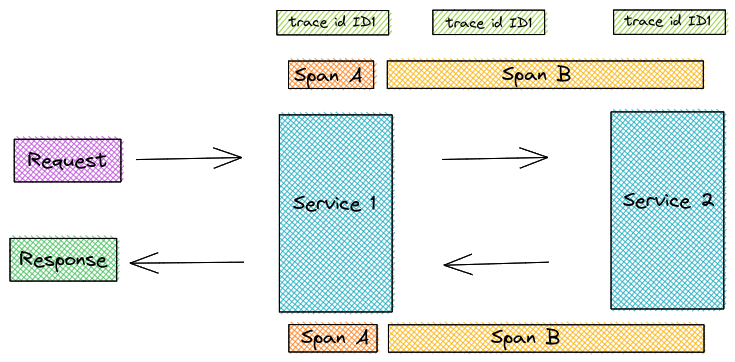
The incoming request does not have any trace ID. The first service that intercepts the call generates the trace ID "ID1" and its span id "A". span id "B" covers the time from the client of server 1 sending A request to server 2 receiving, processing and sending A response.
Spring Boot example with Spring Cloud Sleuth
Let's create an application that integrates Spring Cloud Sleuth. First, let's visit https://start.spring.io/ And use the dependency "Spring" Web "and" Spring Cloud Sleuth "create an application.
Now let's create a simple controller with two request mappings.
public class Controller {

 private static final Logger logger = LoggerFactory.getLogger(Controller.class);
 private RestTemplate restTemplate;

 @Value("${spring.application.name}")
 private String applicationName;

 public Controller(RestTemplate restTemplate) {
    this.restTemplate = restTemplate;
 }

 @GetMapping("/path1")
 public ResponseEntity path1() {

  logger.info("Request at {} for request /path1 ", applicationName);
  String response = restTemplate.getForObject("http://localhost:8090/service/path2", String.class);
  return ResponseEntity.ok("response from /path1 + "+ response);
 }

@GetMapping("/path2")
public ResponseEntity path2(){
  logger.info("Request at {} at /path2", applicationName);
  return ResponseEntity.ok("response from /path2 ");
}
Here, I create two paths. Path1 calls Path2 fixed port 8090. The idea here is to run two separate instances of the same application.
Now, in order to allow detectives to inject headers into outgoing requests, we need to inject RestTemplate as a bean instead of initializing it directly. This will allow detectives to add an interceptor to the RestTemplate to inject headers with trace IDs and span IDS into outgoing requests.
@Bean
   public RestTemplate restTemplate(RestTemplateBuilder builder) {
      return builder.build();
   }
Now, let's start two instances. To do this, first build the application, mvn clean verify, and then run the following command to start "service 1".
java -jar \
target/Distributed-Service-0.0.1-SNAPSHOT.jar \
--spring.application.name=Service-1 \
--server.port=8080
Then run "service 2" on different terminals as follows:
java -jar \
target/Distributed-Service-0.0.1-SNAPSHOT.jar \
--spring.application.name=Service-2 \
--server.port=8090
After the application starts, call "Service 1". /path1 is as follows:
curl -i http://localhost:8080/service/path1
Now let's look at the log of "service 1".
INFO [Service-1,222f3b00a283c75c,222f3b00a283c75c] 41114 --- [nio-8080-exec-1] c.a.p.distributedservice.Controller : Incoming request at Service-1 for request /path1
The log contains square brackets, including three parts [Service Name, Trace Id, Span Id]. For the first incoming request, because there is no incoming trace id, span id is the same as trace id.
Looking at the log of "service 2", we see that we have a new span id for this request.
INFO [Service-2,222f3b00a283c75c,13194db963293a22] 41052 --- [nio-8090-exec-1] c.a.p.distributedservice.Controller : Incoming request at Service-2 at /path2
I intercepted the request from "service 1" to "service 2" and found that the following header already exists in the outgoing request.
x-b3-traceid:"222f3b00a283c75c",
x-b3-spanid:"13194db963293a22",
x-b3-parentspanid:"222f3b00a283c75c
Here, we see that the span of the next operation (the} call to "service 2") has been injected into the header. These are injected by service 1 when the client makes a request. This means that the span of the next call to "service 2" has started from the client of "service 1". In the title shown above, the span id of "service 1" is now the parent span id of the next span.
To make things easier to understand, we can use the name Zipkin Our interceptor tool visually views the trace.
Visual tracking using Zipkin
To integrate Zipkin with the application, we need to add Zipkin client dependencies to the application.
<dependency>
   <groupId>org.springframework.cloud</groupId>
   <artifactId>spring-cloud-sleuth-zipkin</artifactId>
</dependency>
After adding this dependency, the Zipkin client sends the trace to port 9411 of the Zipkin server by default. Let's start the Zipkin server with its docker image. I created a simple docker compose file for this purpose.
version: "3.1"
services:
  zipkin:
    image: openzipkin/zipkin:2
    ports:
      - "9411:9411"
We can now start the server using the docker compose up command. You can then access the UI at http://localhost:9411/
Since we use the default port, we do not need to specify any properties, but if you plan to use a different port, you need to add the following properties.
spring:
  zipkin:
    baseUrl: http://localhost:9411
When finished, let's start both applications with the same command as above. When making a request to "service 1" in the path, / path1 we get the following trace.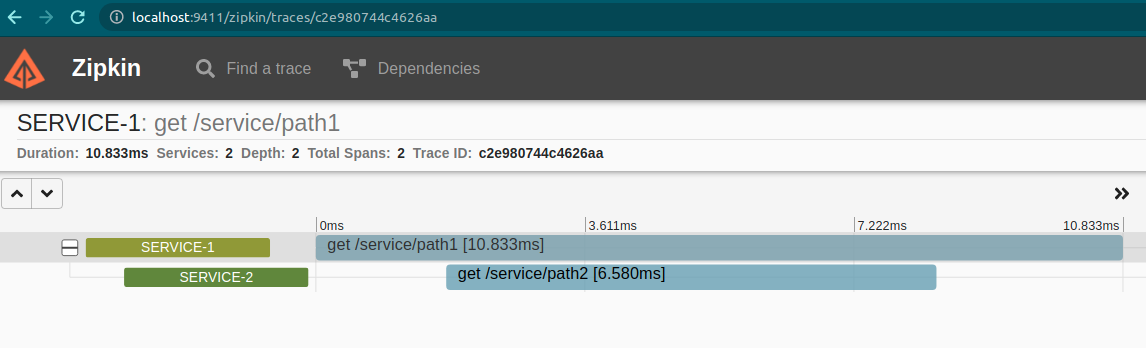
The span of the two services is shown here. We can dig deeper by looking at the span.
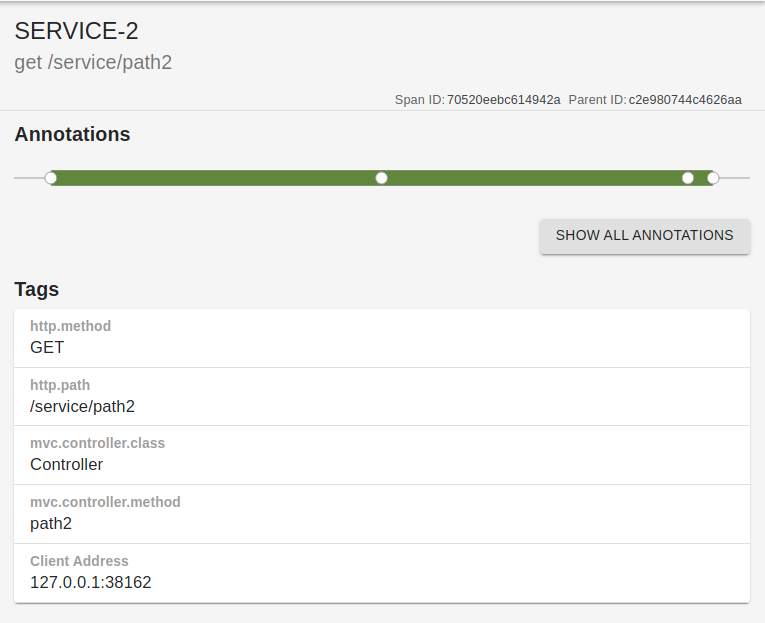
The span of "service 1" is a normal span, covering the requests it receives to return a response. Interestingly, the second span.
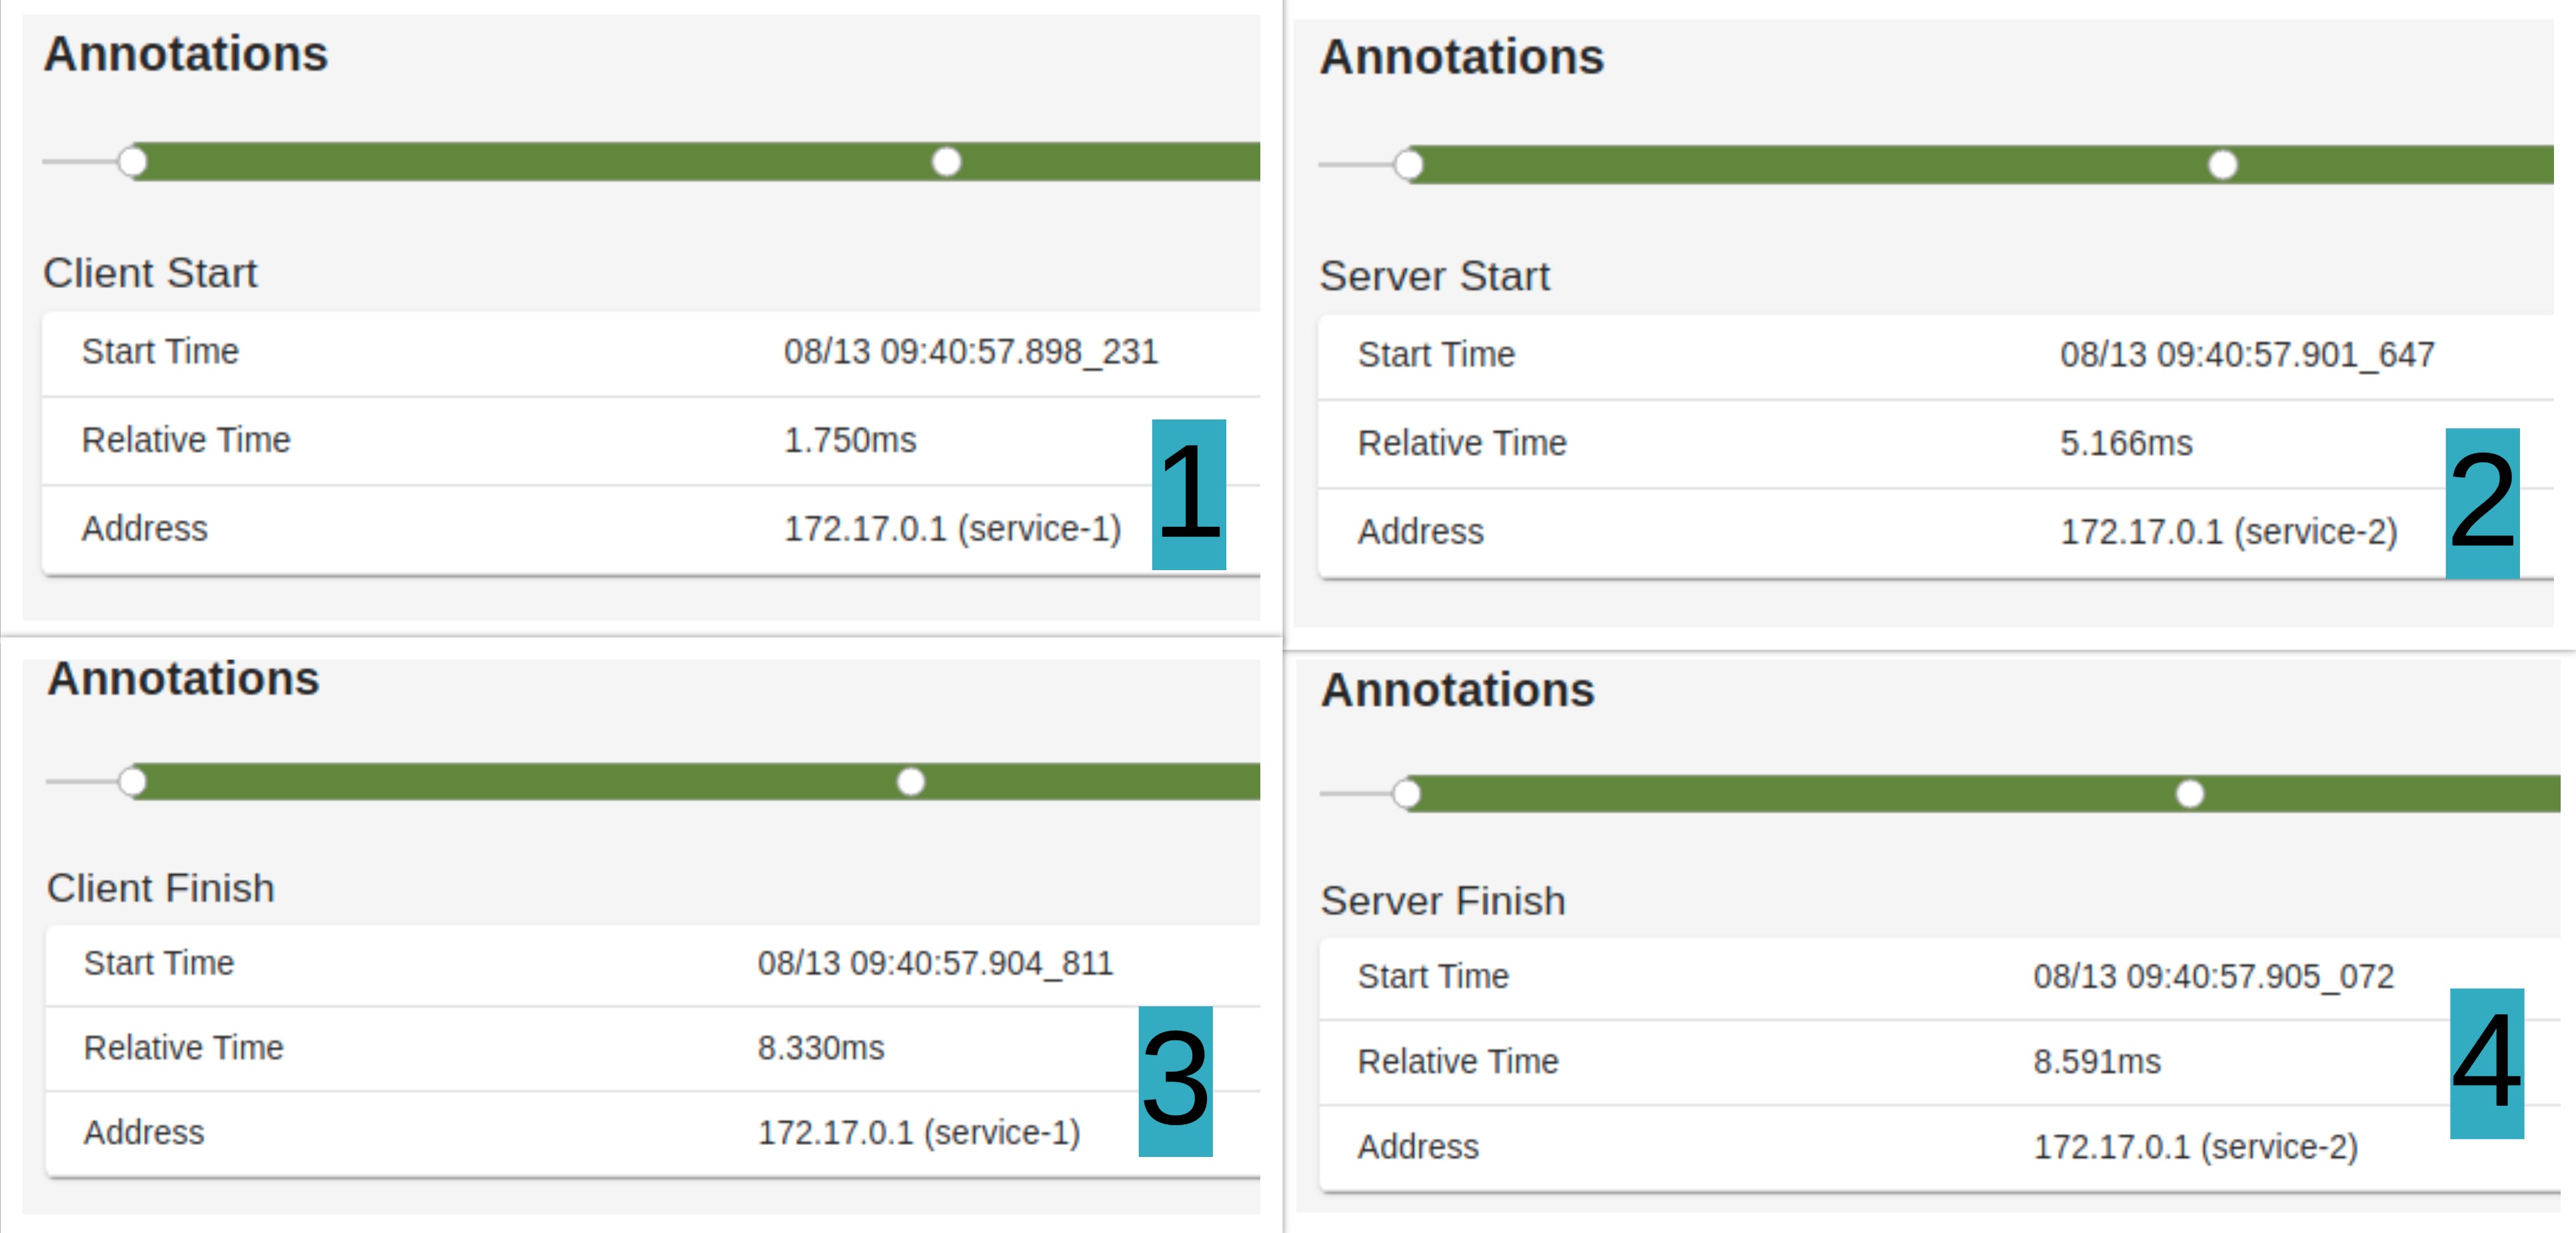
Here, there are four points in the span.
- The first point refers to when the client from "service 1" starts the request.
- The second point is when service 2 starts processing requests.
- The third point is the time when the client on "Server 1" completes receiving the response.
- Finally, server 2 completes the last point.
Therefore, we learned how to integrate distributed tracing with Spring Cloud Sleuth and use Zipkin to visualize tracing.
Code in Github Available on.