1. Introduction to data: Tianchi Taobao User Data
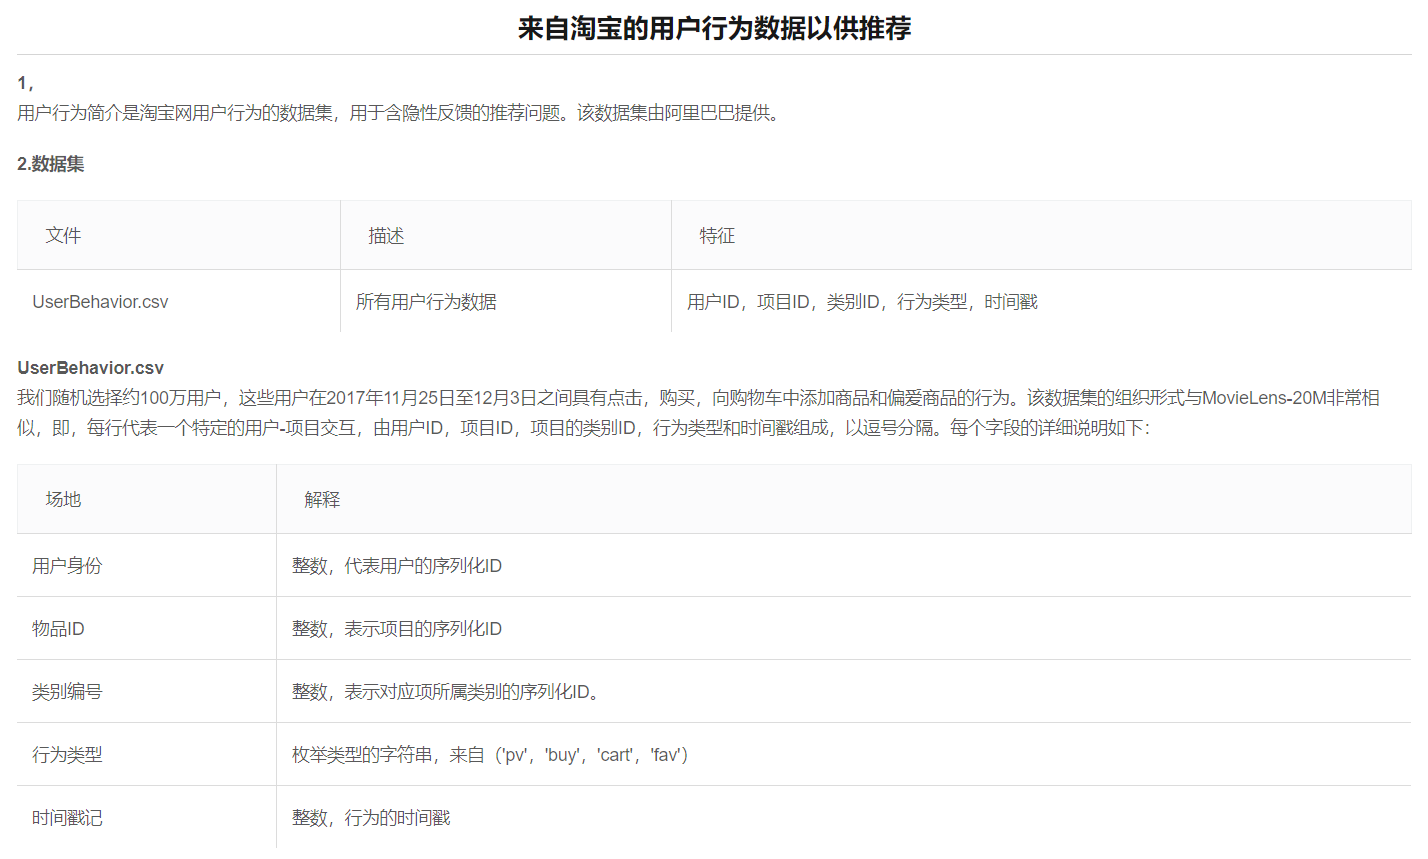
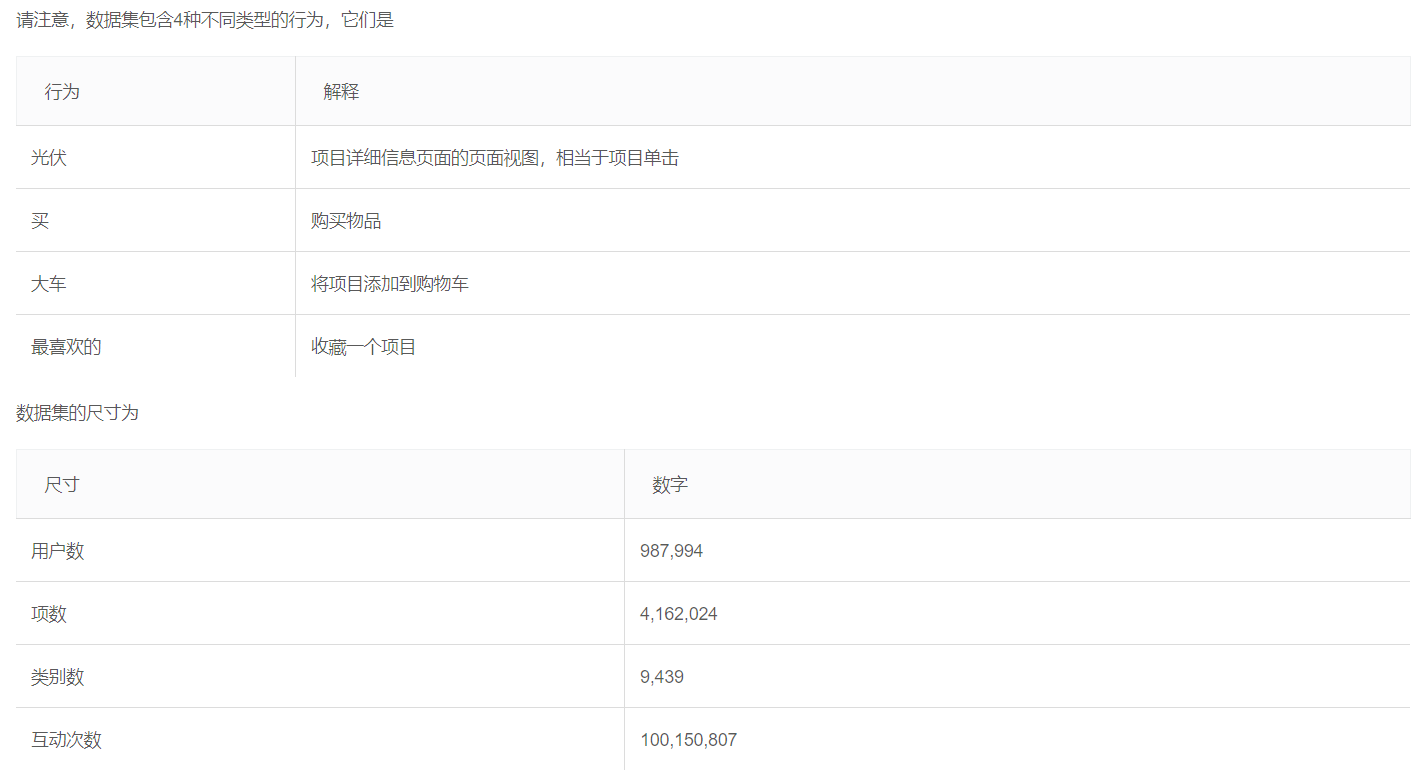
2. Data Import and Cleaning
SQL interface tool used this time - SQL workbench
2.1 Importing data
create table userbehavior(
userID int,
itemID int,
categoryID int,
bahaviortype text,
timestamp int
);

load data infile "C:/ProgramData/MySQL/MySQL Server 8.0/Uploads/UserBehavior.csv"
into table userbehavior
fields terminated by ','
lines terminated by '\n';
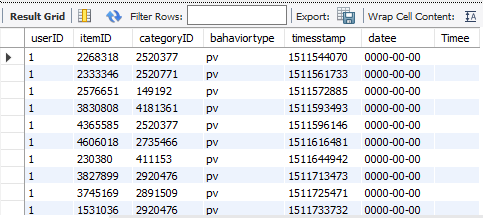
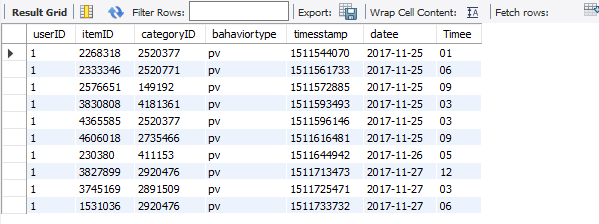
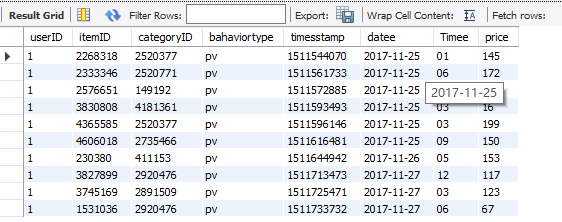
Let's take a look at what this data looks like:
select * from userbehavior limit 10;
2.2 Data cleaning
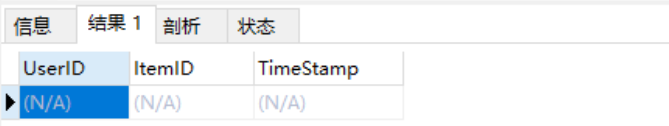
After analysis based on the content of the field, set UserID, ItemID, TimeStamp as the union primary key, and verify that there is no data duplication.
select UserID,ItemID,TimeStamp from userbehavior
GROUP BY UserID,ItemID,TimeStamp having count(1)>1;
2.3 View missing values for data
 select count(userID), count(itemID), count(categoryID), count(bahaviortype), count(timesstamp)
 from userbehavior;
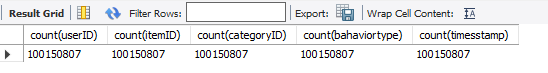
The data here is really too big, reaching 100150807. For fast completion, only 500000 is used here
2.4 Time processing of data
The data here is a timestamp and we need to convert it to the time format we use every day
create table usertest2(
	select * from userbehavior limit 500000
);
# Time Conversion to Daily Format
UPDATE usertest set datee = FROM_UNIXTIME(timesstamp,'%Y-%m-%d'), Timee = FROM_UNIXTIME(timesstamp,'%h');
#Add two columns
alter table userbehavior change Date datee date;
alter table userbehavior change Timee Timee varchar(10);
2.5 Outlier Handling
select max(datee), min(datee) from usertest;
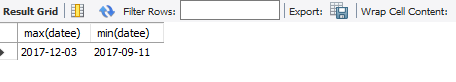
The time here is data from 2017-12-03 to 2017-09-11
3. Data Analysis
3.1 Here's a look at the distribution of user behavior
create view user_p as
select userID, itemID,
sum(case when bahaviortype = 'pv' then 1 else 0 end) as click,
sum(case when bahaviortype = 'fav' then 1 else 0 end) as favor,
sum(case when bahaviortype = 'buy' then 1 else 0 end) as buy,
sum(case when bahaviortype = 'cart' then 1 else 0 end) as buycar from usertest group by userID,  itemID
;
SELECT * FROM day01.user_p;
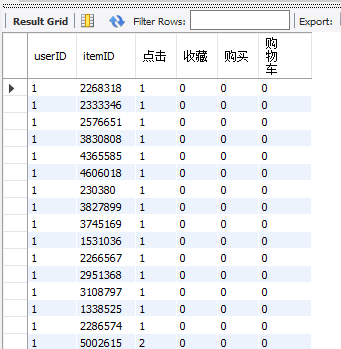
Here is a view created to simplify and manipulate the data. You can read the following two articles about views:
View 1: https://www.w3school.com.cn/sql/sql_view.asp
The role of the SQL view: https://blog.csdn.net/weixin_34037515/article/details/92609031
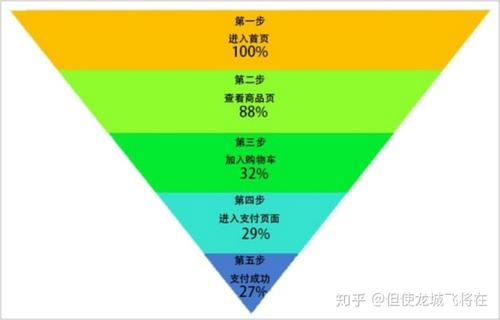
3.2 Funnel transformation at data level (based on funnel analysis)
Funnel analysis: Detailed introduction
# Analysis of conversion rates in each case
create view user_p as
select userID, itemID,
sum(case when bahaviortype = 'pv' then 1 else 0 end) as click,
sum(case when bahaviortype = 'fav' then 1 else 0 end) as favor,
sum(case when bahaviortype = 'buy' then 1 else 0 end) as buy,
sum(case when bahaviortype = 'cart' then 1 else 0 end) as buycar from usertest group by userID,  itemID
;
#click amount 449357
select sum(click) from user_p;

# Number of behaviors with buy quantity 5066
select sum(buy) from user_p where click>0 and buy>0 and favor=0 and buycar=0;
# Number of behaviors with buycar 11956
select sum(buycar) from user_p where click>0 and buy=0 and favor=0 and buycar>0;
# Number of favor behaviors 4482
select sum(favor) from user_p where click>0 and buy=0 and favor>0 and buycar=0;

# Have favor and buy 443
select sum(buy) from user_p where click>0 and buy>0 and favor>0 and buycar=0;

#Have plus buycar and buy behavior 1467
select sum(buycar) from user_p where click>0 and buy>0 and favor=0 and buycar>0;

# Number of plus and favor: 298
select sum(favor)+sum(buy) from user_p where click>0 and buy=0 and favor>0 and buycar>0;

# Number of plus and favor s: 145
select sum(favor)+sum(buy) from user_p where click>0 and buy>0 and favor>0 and buycar>0;
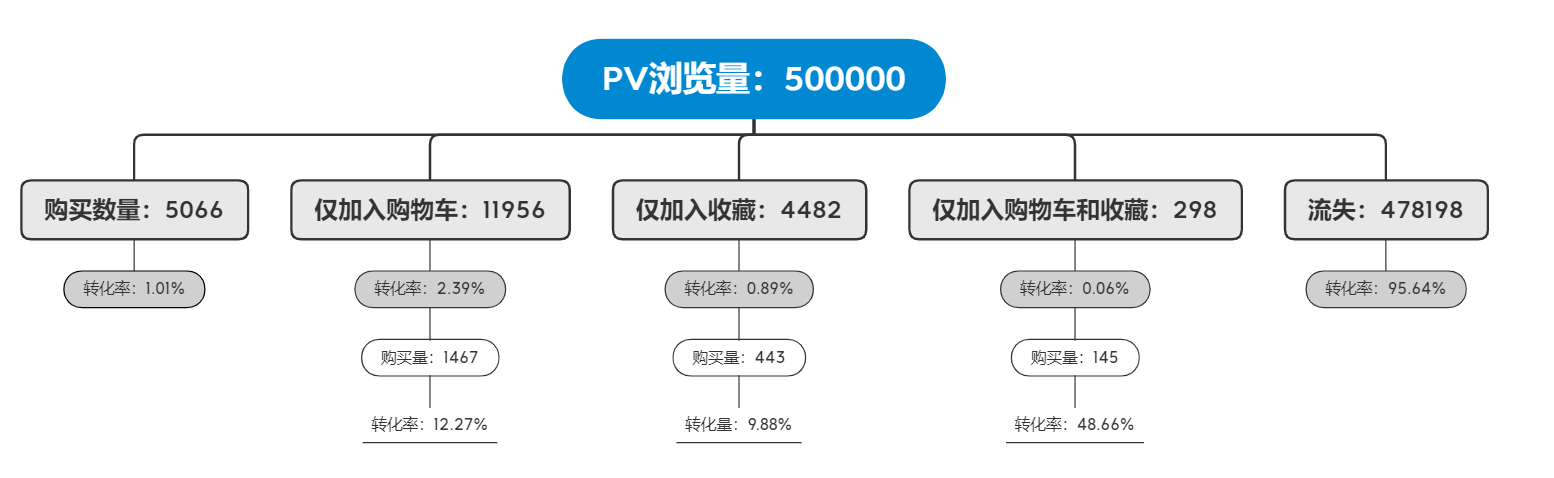
From this we can see that the conversion rate from browsing volume to direct purchase is only 1.01%, while the conversion rate from browsing to adding shopping cart behavior is 12.27%, and from collecting behavior is 9.88%, so after customers have the behavior of collecting or adding shopping cart, the conversion rate of re-purchasing at this time reaches 48.66%, indicating that the conversion rate will be increased, so we need to use product interaction interface, and Marketing mechanism and other aspects allow users to buy more, collect more. At the same time, we found that the conversion rate of after-purchase is 12.27%, and the conversion rate from after-purchase to purchase is 12.27% higher than after-collection, so it is easier and more efficient to guide the purchase behavior.
Of course, we also found a huge problem, that is, the conversion rate of users from clicks to the next level of operation is very low, indicating that users spent a lot of time browsing commodities, but few actually placed orders. We also know that most users of Taobao Tmall are women, so women shopping is very powerful, afternoon or even day, why? Because women tend to shop not for what they need, but what they like, which is called idle and idle roaming, the recommendation function of goods is especially important for a shopping platform such as Taobao Tmall. If users can recommend the goods they like, they will naturally place an order. If they don't like it, they just have to see it.
4.3 Analytical Brain Map of Reasons for Specific Conversion Rate
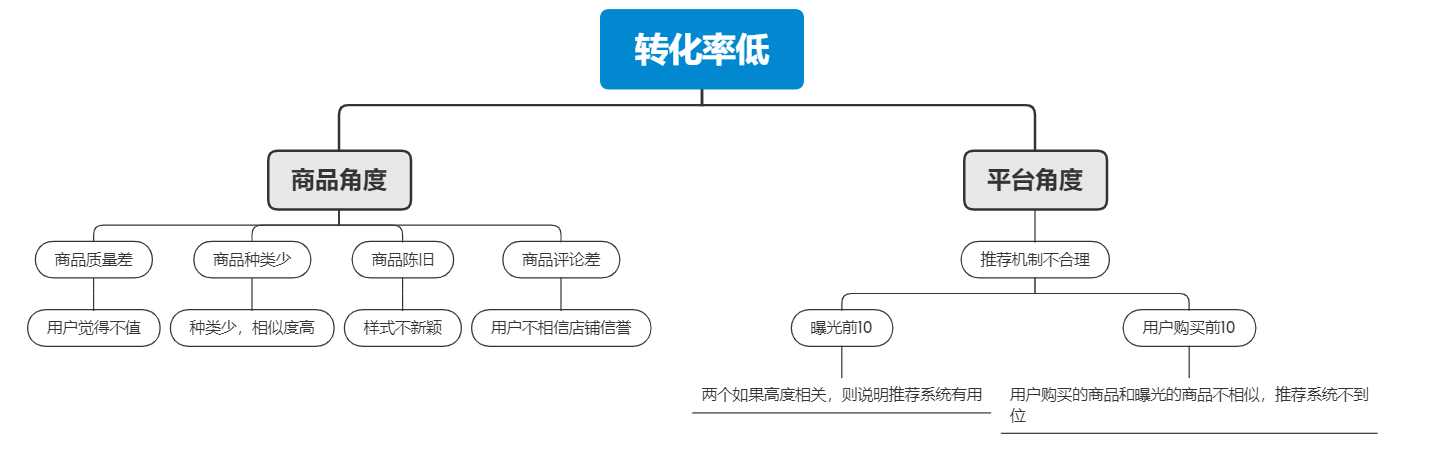
4.4 Assume that the recommendation system is inadequate and exposes that the recommended product is not what the user wants to buy
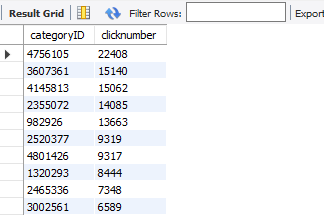
1. Top 20 Categories
select categoryID, count(categoryID) as clicknumber
from usertest where bahaviortype='pv'
group by categoryID order by clicknumber desc limit 20;
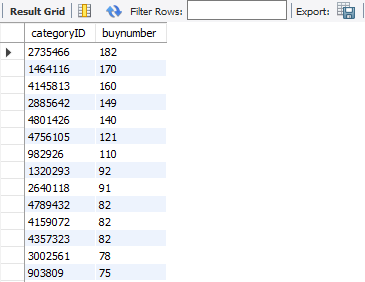
2. Categories of the top 20 purchases
select categoryID, count(categoryID) as buynumber
from usertest where bahaviortype='buy'
group by categoryID order by buynumber desc limit 20;
We'll find out the same commodity ID for both:
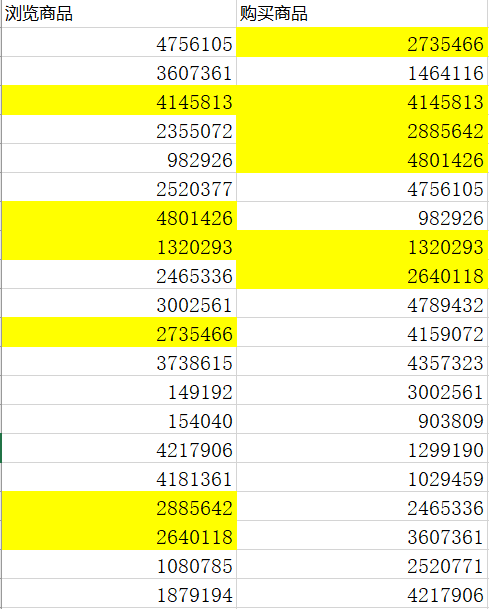
We found that the products with high exposure before also appear in the list with more purchases, so we recommend that the products displayed by the system are related to the needs of our users. Six of the 20 categories of goods can meet the needs of users. Of course, there are only the first 20 categories, the quantity is not persuasive enough, but it shows the problem.
Next, we'll break down each item to see if there's a correlation between what's exposed and what's purchased.
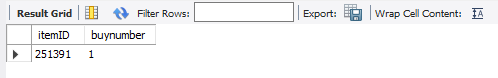
Calculate purchases of top 20 clicks
select * from
(select itemID, count(bahaviortype) as buynumber
from usertest where bahaviortype='buy' group by itemID
) as a where itemID in
(select itemID from (select *, count(categoryID) as clicknumber
from usertest where bahaviortype='pv'
group by categoryID order by clicknumber desc limit 20) t);
Calculate clicks in the top 20 of your purchases
select * from
(select itemID, count(bahaviortype) as buynumber
from usertest where bahaviortype='pv' group by itemID
) as a where itemID in
(select itemID from (select *, count(categoryID) as buynumber
from usertest where bahaviortype='buy'
group by categoryID order by buynumber desc limit 20) t);
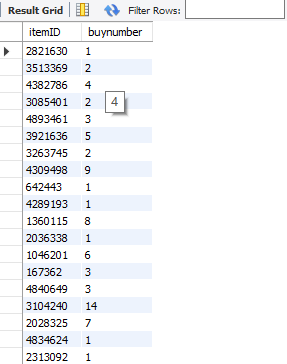
The products in the top 20 click-through quantity purchased basically have only one purchase quantity. Looking back at the products in the top 20, the click-through quantity is basically 20 clicks, which is less in the click-through quantity. This shows that the recommendation system is really inadequate and does not recommend to the users the goods they want to purchase.
4.4 Conclusion
Therefore, it can be concluded that the recommended customers do not like to buy the goods, and the conversion rate is low because the high volume of browsing does not lead to the purchase.
At the same time, we also found that 3104240, 1309498, 1360115, 2028325 are commodities with high purchases, so we may need to improve the exposure of these commodities
Summary:
1. Optimize the recommendation mechanism to give more traffic to goods that customers are willing to buy
2. Reduce the turnover rate through better commodity recommendation, page interaction, credit membership, etc.
3. Guiding the purchase, you can strengthen the marketing mechanism to guide customers to purchase, such as adding shopping carts to contact customer service to collect coupons
5. User Hierarchical Analysis Based on RFM Analysis Model
RFM Model: Detailed introduction
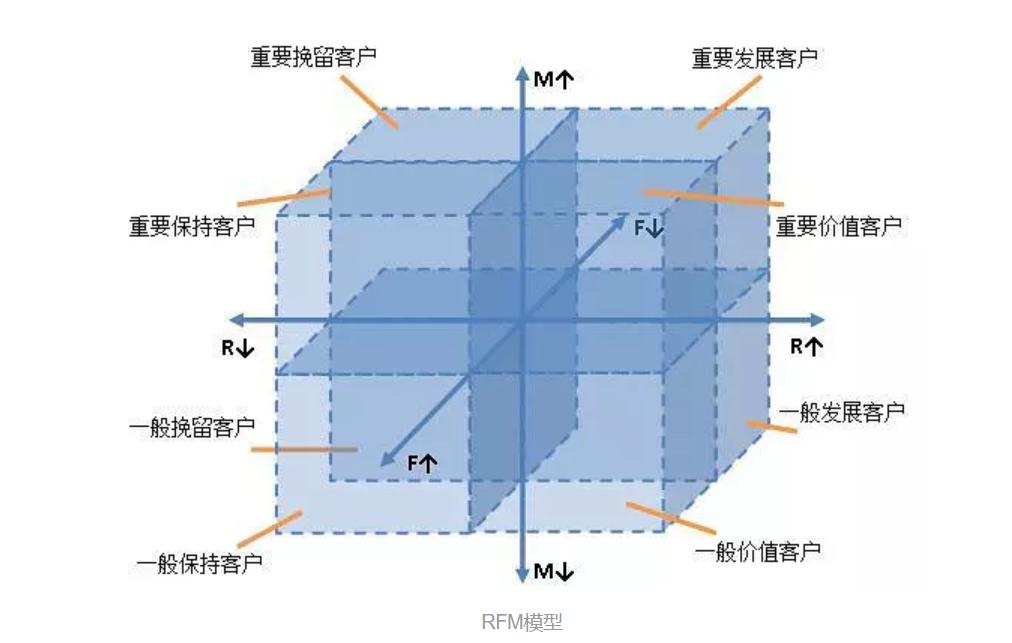
RFM is the abbreviation of three indicators: Recency, Frequency and Monetary. Users are classified by these three indicators.
Next, you need to use a SQL statement to calculate each user's last consumption interval and frequency. Because of missing data, I use random numbers to generate a list to replace prices.
alter table usertest add price float;
update usertest set price=ceil(rand()*199);
select * from usertest limit 10;
1. Calculate the most recent consequent consumption interval (R)
R = Statistics Time - Latest User Consumption Time
F = sum of user purchases
M = Commodity Price
Let's check what's the latest time?
select datee from usertest order by datee desc;
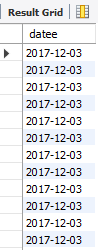
Here, the latest time in the dataset is set to 2017-12-03
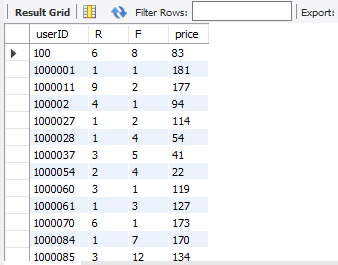
select userID, datediff('2017-12-03', max(datee))+1 as R, count(bahaviortype) as F, price
from usertest where bahaviortype = 'buy' group by userID;
We first find the maximum and minimum values of each RFM value, and then rate the values of R and F and the prices.
select max(F) from
(select userID, datediff('2017-12-03', max(datee))+1 as R, count(bahaviortype) as F, price
from usertest where bahaviortype = 'buy' group by userID order by R desc) t;

select min(F) from
(select userID, datediff('2017-12-03', max(datee))+1 as R, count(bahaviortype) as F, price
from usertest where bahaviortype = 'buy' group by userID order by R desc) t;

select min(price) from
(select userID, datediff('2017-12-03', max(datee))+1 as R, count(bahaviortype) as F, price
from usertest where bahaviortype = 'buy' group by userID order by R desc) t;

select max(price) from
(select userID, datediff('2017-12-03', max(datee))+1 as R, count(bahaviortype) as F, price
from usertest where bahaviortype = 'buy' group by userID order by R desc) t;

select min(R) from
(select userID, datediff('2017-12-03', max(datee))+1 as R, count(bahaviortype) as F, price
from usertest where bahaviortype = 'buy' group by userID order by R desc) t;

select max(R) from
(select userID, datediff('2017-12-03', max(datee))+1 as R, count(bahaviortype) as F, price
from usertest where bahaviortype = 'buy' group by userID order by R desc) t;
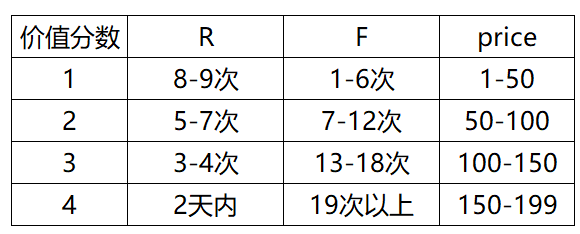
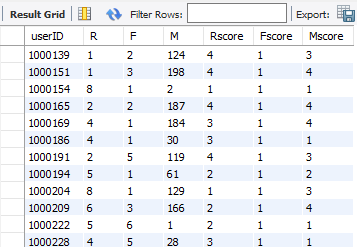
We then rate the data separately, create a new field for the score, and create a new table for the result, which is then used for user analysis of the value behind the facet
create table RFM(
select *,
(
case when R <= 2 then 4
	 when R between 3 and 4 then 3
     when R between 5 and 7 then 2
     when R between 8 and 9 then 1 end
) as Rscore,
(
case when F >= 19 then 4
	 when F between 13 and 18 then 3
     when F between 7 and 12 then 2
     when F between 1 and 6 then 1 end
) as Fscore,
(
case when M between 1 and 50 then 1
	 when M between 51 and 100 then 2
	 when M between 101 and 150 then 3
     when M between 151 and 199 then 4 end
) as Mscore
from
(select userID, datediff('2017-12-03', max(datee))+1 as R, count(bahaviortype) as F, price as M
from usertest where bahaviortype = 'buy' group by userID) t);
Calculate the mean of Rscore, Fscore and Mscore
select avg(Rscore), avg(Fscore), avg(Mscore) from rfm;
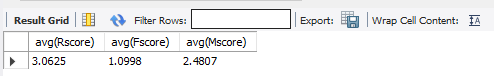
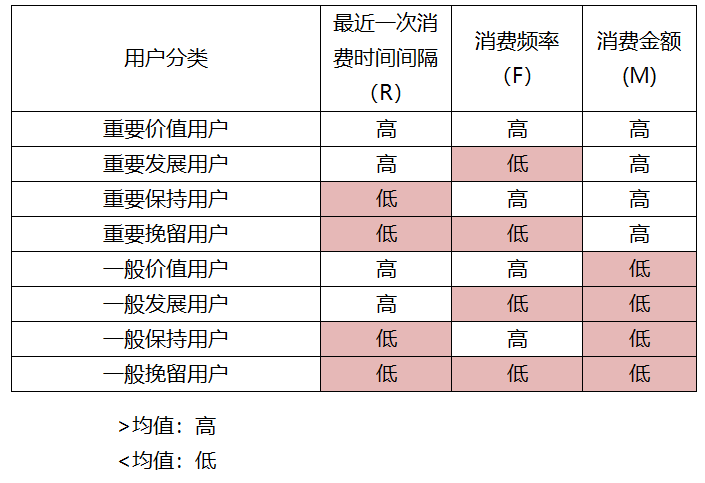
We are positioning higher than the mean and lower than the mean, so we rank different value users according to the three characteristics
select classuser, count(userID) as peoplenumber from
(select userID,
(
case when Rscore>'3.0625' and Fscore > '1.0998' and Mscore > '2.4807' then 'Important Value Users'
	 when Rscore>'3.0625' and Fscore <= '1.0998' and Mscore > '2.4807' then 'Important User Development'
     when Rscore<='3.0625' and Fscore > '1.0998' and Mscore > '2.4807' then 'Important User Maintenance'
     when Rscore<='3.0625' and Fscore <= '1.0998' and Mscore > '2.4807' then 'Important Retained Users'
     when Rscore>'3.0625' and Fscore > '1.0998' and Mscore < '2.4807' then 'General Value Users'
     when Rscore>'3.0625' and Fscore <= '1.0998' and Mscore <= '2.4807' then 'General Development Users'
     when Rscore<='3.0625' and Fscore > '1.0998' and Mscore <= '2.4807' then 'Maintain users in general'
     when Rscore<='3.0625' and Fscore <= '1.0998' and Mscore <= '2.4807' then 'General Retained Users' end
) as classuser
from rfm) t group by classuser;
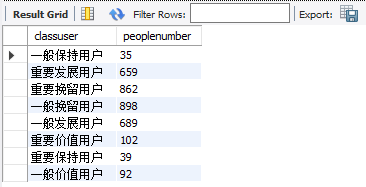
You can find that users are concentrated on the important retained users and the general retained users, while the general and important developed users have a large number
- For the important retained users who account for a large proportion, the most recent consumption frequency is lower and the last consumption time interval is longer, we should find ways to increase the consumption of these users, which can be pushed through the issuance of coupons or the use of activities.
- For the general retained users, try to improve the accuracy of the recommendation system as much as possible, so that such users can increase their browsing volume and thus further increase their purchases. However, such users are not of great value and should not be retained at too much cost.
- For key development users, the recent consumption frequency is low, but the time interval between consumption is close. We need to focus on why such important users are spending less frequently. Whether there is no suitable commodity or other reason, this needs further analysis.
6. CONCLUSIONS AND SUGGESTIONS
1. The commodities with high traffic are not those with high purchases. The low purchases of high traffic lead to low overall traffic conversion rate, that is, the logic of recommendation display is not sales-oriented.
2. From the user behavior path, it is found that the conversion rate of direct purchases after user browsing is low, while the conversion rate of purchases after purchasing through additional purchases, collections and other behaviors will increase, so it is necessary to guide customers to actively add purchases or collections, and after comparing the conversion rate, it is found that the conversion brought by adding shopping carts is the best.
3. Users are mainly concentrated in key development users and key retention users, as well as general development users and general retention users, which together account for 92% of the total number of users.
4. It is recommended that the algorithm department give priority to displaying the categories of TOP10 purchased to customers, such as 2735466, 1464116, 4145813, etc. If the high-volume commodities are new or recently promoted, whether it is possible to consider whether the commodities purchased by TOP10 can be properly matched with the categories to improve the conversion rate and tie-in rate.
5. We need to actively guide customers to add shopping carts or collect babies. For interface design departments, we should consider how interaction can make customers more willing to click. For operation departments, we can set up mechanism guidance, such as additional purchase of contact customer service and 5 yuan no-threshold coupons, and additional purchase of sample gifts.
- Taobao users mainly search for merchandise from 6 pm to 11 pm, which is the time most people rest after work. It is recommended that the operation department plan more marketing activities in this period to improve the conversion rate.
7. For important development users, their consumption frequency is low, but the recent consumption distance is shorter now. Therefore, we should try to improve their consumption frequency by issuing red envelopes of CRM, membership rights awards, SMS reminder discounts, etc.
8. For important retained users, the recent consumption time is far away and the frequency is low. This kind of user is in danger of losing. It is recommended to actively contact users by issuing paid questionnaires such as APP push, SMS and email, to find out where the problem is, and to formulate appropriate recovery strategies
Some improvements and modifications have been made to this blog, which can be found in the following blog post for detailed analysis.
Reference Blog: https://zhuanlan.zhihu.com/p/121530969