Transferred from WeChat official account: machine learning community, authorized by authorisation.
Time series analysis is a very important field in data science. It mainly includes statistical analysis, detecting change points, anomaly detection and predicting future trends. However, these time series techniques are usually implemented by different libraries. Is there a way for you to get all these technologies in one library?
The answer is yes. In this article, I will share a great toolkit Kats, which can perfectly solve the above problems.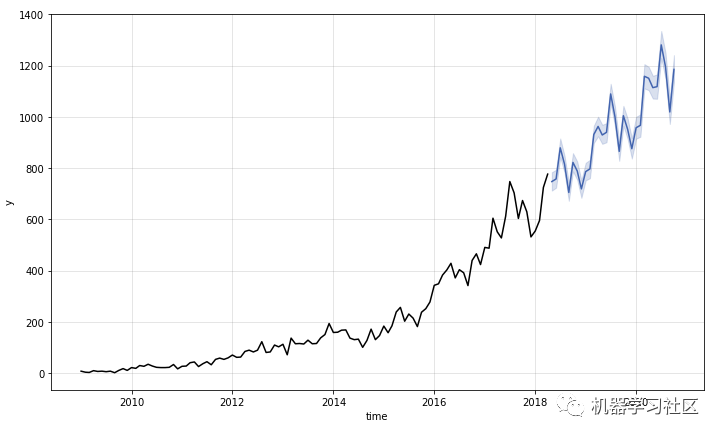
What is Kats?
At present, there are many time series analysis and modeling technologies, but they are relatively scattered. This FaceBook open source Kats, which is a lightweight, easy-to-use and general time series analysis framework, including prediction, anomaly detection, multivariate analysis and feature extraction and embedding. You can think of Kats as a one-stop toolkit for time series analysis in Python.
Install Kats
pip install --upgrade pip
pip install kats
In order to understand the function of Kats, we will use this framework to analyze the StackOverflow problem and counting problem on Kaggle. The data link is: https://www.kaggle.com/aishu200023/stackindex
First, let's start by reading the data.
import pandas as pd
df = pd.read_csv("MLTollsStackOverflow.csv")
# Turn the month column into datetime
df["month"] = pd.to_datetime(df["month"], format="%y-%b")
df = df.set_index("month")
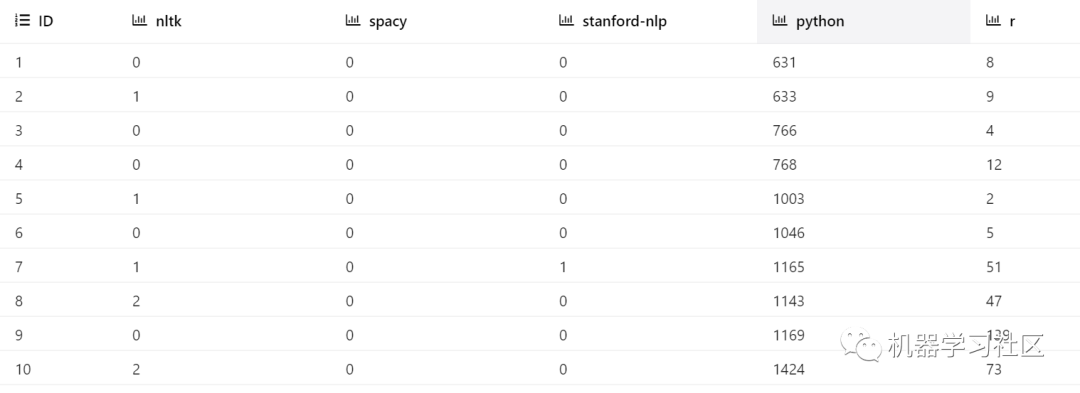
Now let's analyze the stack overflow problem count related to Python. The data were divided into a column and a test set to evaluate the prediction.
python = df["python"].to_frame()

# Split data into train and test set
train_len = 102
train = python.iloc[:train_len]
test = python.iloc[train_len:]
Convert data to time series
First, construct a time series object. We use time_col_name='month 'specifies the time column.
from kats.consts import TimeSeriesData

# Construct TimeSeriesData object
ts = TimeSeriesData(train.reset_index(), time_col_name="month")
To plot data, call the plot method:
ts.plot(cols=["python"])
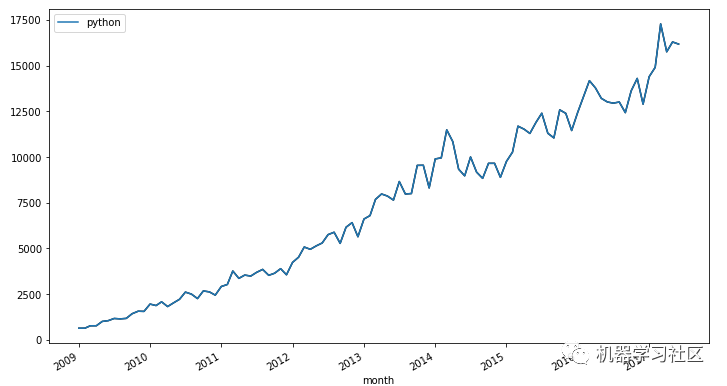
Cool! It seems that the number of questions about Python has increased over time. Can we predict the trend in the next 30 days? Yes, we can do it with Kats.
forecast
Kats currently supports the following 10 prediction models:
-
Linear
-
Quadratic
-
ARIMA
-
SARIMA
-
Holt-Winters
-
Prophet
-
AR-Net
-
LSTM
-
Theta
-
VAR
There are many above models. Let's try two of them!
1. Starting with prediction using Prophet:
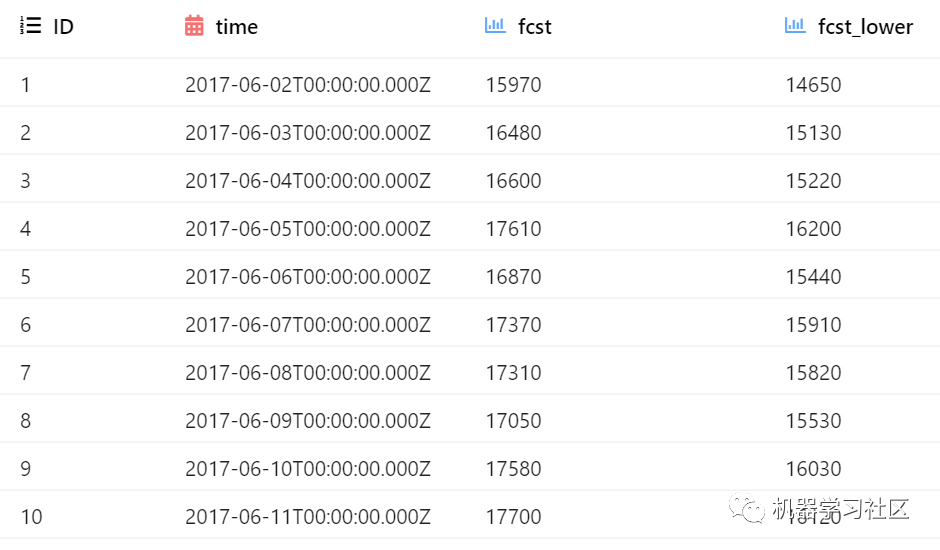
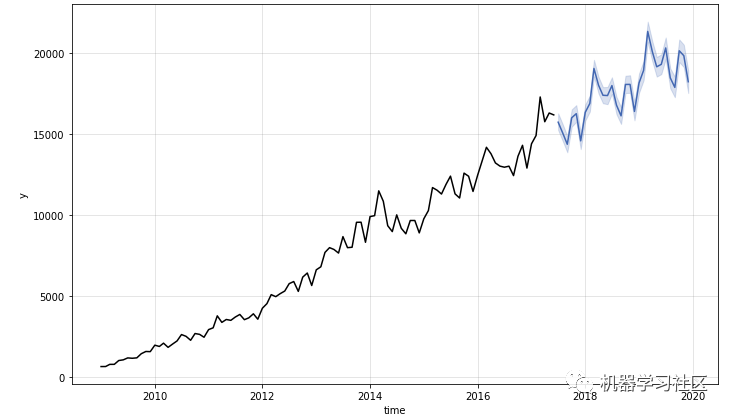
from kats.models.prophet import ProphetModel, ProphetParams
# Specify parameters
params = ProphetParams(seasonality_mode="multiplicative")
# Create a model instance
m = ProphetModel(ts, params)
# Fit mode
m.fit()
# Forecast
fcst = m.predict(steps=30, freq="MS")
fcst
 visualization
m.plot()
 Cool! Let's evaluate the prediction by comparing it with the test data.
import matplotlib.pyplot as plt

fig, ax = plt.subplots(figsize=(12, 7))

train.plot(ax=ax, label="train", color="black")
test.plot(ax=ax, color="black")
fcst.plot(x="time", y="fcst", ax=ax, color="blue")

ax.fill_between(test.index, fcst["fcst_lower"], fcst["fcst_upper"], alpha=0.5)
ax.get_legend().remove()
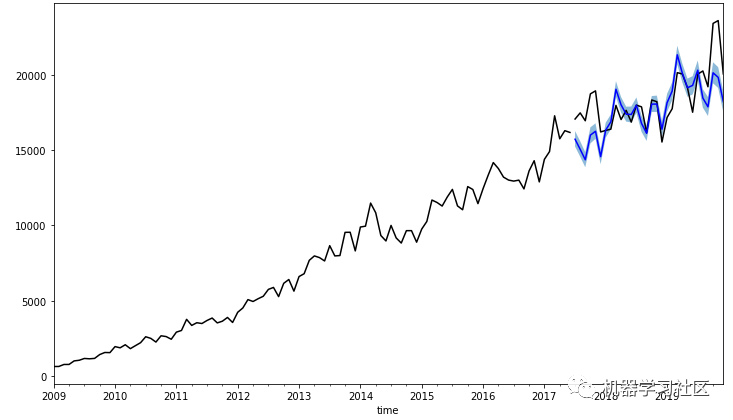 The forecast seems to agree well with the observations!
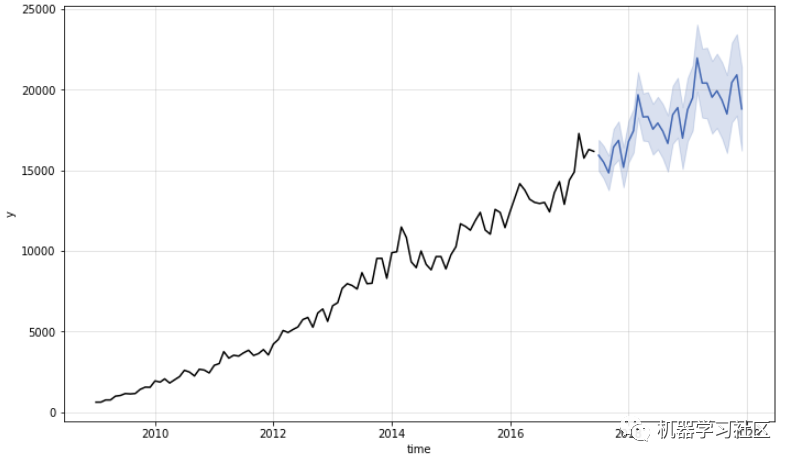
Holt-Winters
The next model we will try is Holt winters. It is a way to capture seasonality. Here is how to use the Holt winters method in Kats.
from kats.models.holtwinters import HoltWintersParams, HoltWintersModel
import warnings
warnings.simplefilter(action='ignore')

params = HoltWintersParams(
            trend="add",
            seasonal="mul",
            seasonal_periods=12,
        )
m = HoltWintersModel(
    data=ts,
    params=params)

m.fit()
fcst = m.predict(steps=30, alpha = 0.1)
m.plot()
Detect change points
Have you ever thought about the time when statistically significant mean changes occur in your time series?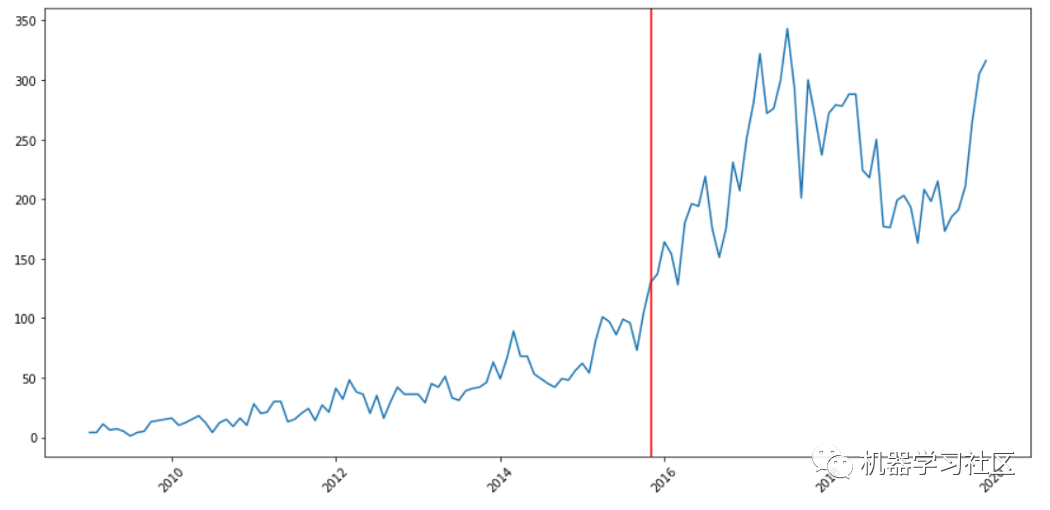
Kats allows the Cusum algorithm to detect change points. Cusum is a method to detect the up and down movement of mean in time series.
Let's see how to detect change points in Kats.
from kats.consts import TimeSeriesData, TimeSeriesIterator
from kats.detectors.cusum_detection import CUSUMDetector
import matplotlib.pyplot as plt

detector = CUSUMDetector(ts)

change_points = detector.detector(change_directions=["increase", "decrease"])
print("The change point is on", change_points[0][0].start_time)

# plot the results
plt.xticks(rotation=45)
detector.plot(change_points)
plt.show()
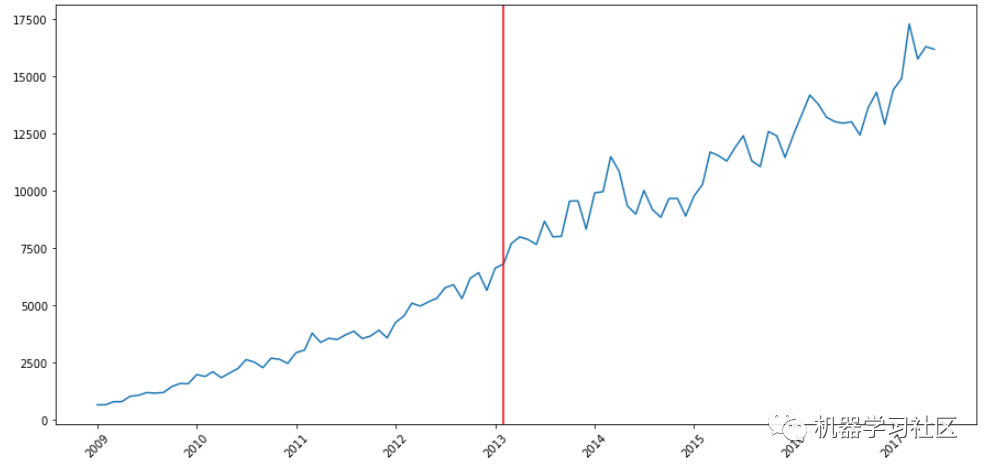 Cool! Let's try to detect the change points of other categories of StackOverflow problem count.
First, create a function to detect the change points provided by the topic.
def get_ts(topic: str):
    return TimeSeriesData(df[topic].to_frame().reset_index(), time_col_name="month")

def detect_change_point(topic: str):
    ts = get_ts(topic)
    detector = CUSUMDetector(ts)

    change_points = detector.detector()
    for change_point in change_points:
        print("The change point is on", change_point[0].start_time)

    # plot the results
    plt.xticks(rotation=45)
    detector.plot(change_points)
    plt.show()
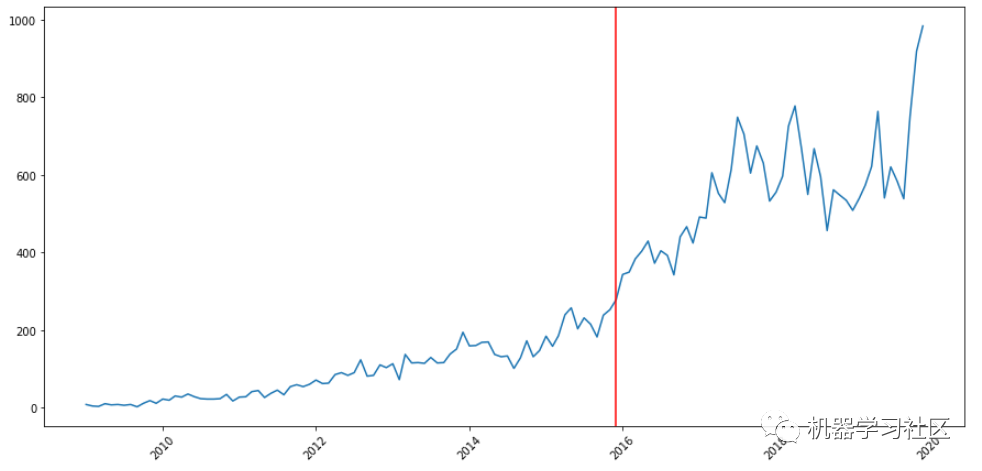
machine learning
detect_change_point("machine-learning")
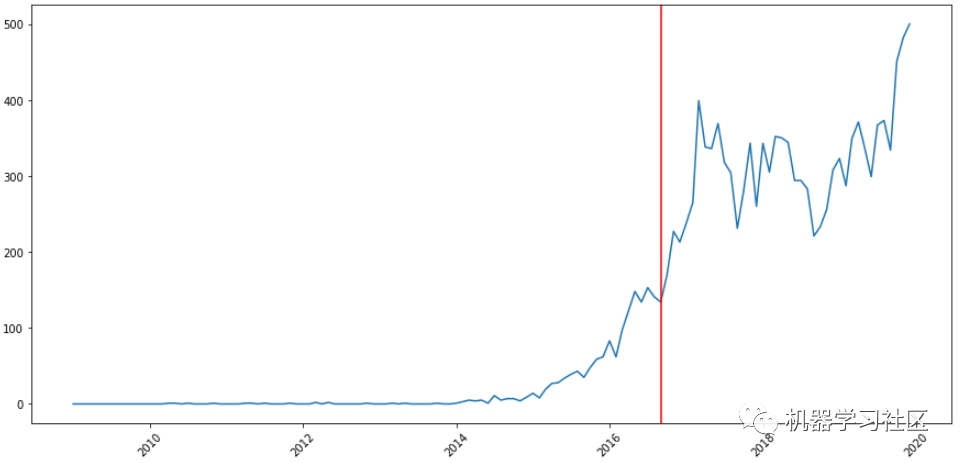
 Deep learning
detect_change_point("deep-learning")
Outlier detection
What do you see when you look at the time series of NLP?
df["nlp"].plot()
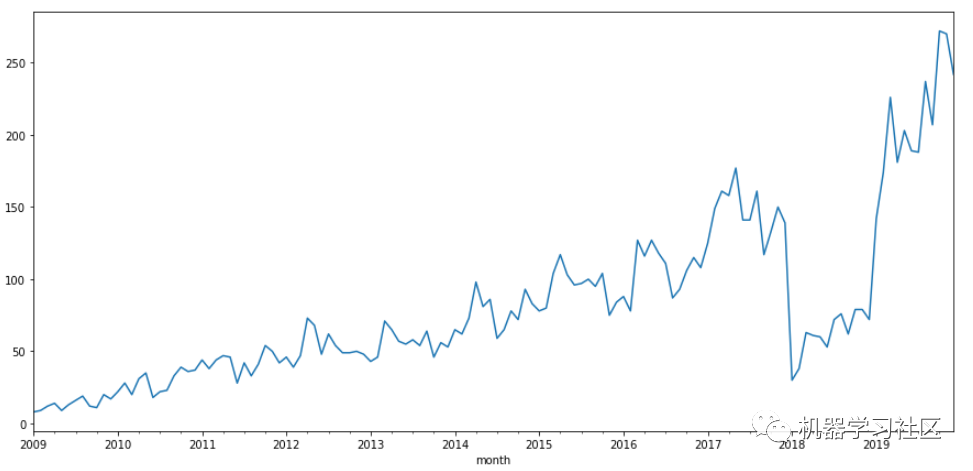
From 2018 to 2019, the number of NLP problems decreased.
The decline in the number of problems is an outlier. Detecting outliers is important because they can cause problems in downstream processing.
However, it is not always efficient and easy to find outliers by looking at the data. Fortunately, Kats also allows you to detect outliers in time series!
Detecting outliers with kat requires only a few lines of code.
from kats.detectors.outlier import OutlierDetector

# Get time series object
ts = get_ts("nlp")

# Detect outliers
ts_outlierDetection = OutlierDetector(ts, "additive")
ts_outlierDetection.detector()

# Print outliers
outlier_range1 = ts_outlierDetection.outliers[0]
print(f"The outliers range from {outlier_range1[0]} to {outlier_range1[1]}")
The outliers range from 2018-01-01 00:00:00 to 2019-03-01 00:00:00
Cool! The results confirm what we see in the figure above.
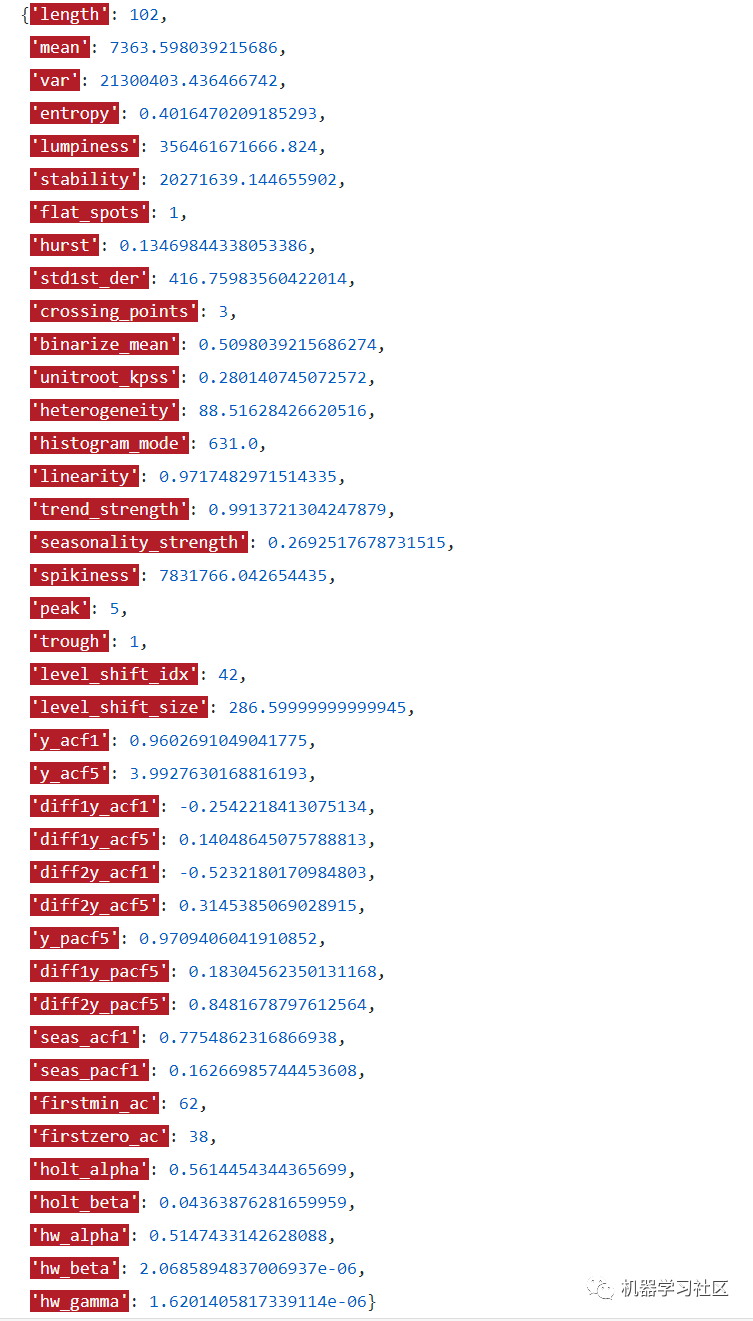
Time series characteristics
In addition to statistics, there are other features in the time series, such as linearity, trend intensity, seasonal intensity, seasonal parameters, etc. you may be interested.
Kats allows you to find important information about the characteristics of time series through TsFeatures:
from kats.tsfeatures.tsfeatures import TsFeatures

model = TsFeatures()

output_features = model.transform(ts)
output_features
Summary
We just learned how to use Kats to predict, detect change points, detect outliers and extract time series features. I hope this article can help you solve the time series problem in your work and extract valuable information from the data.
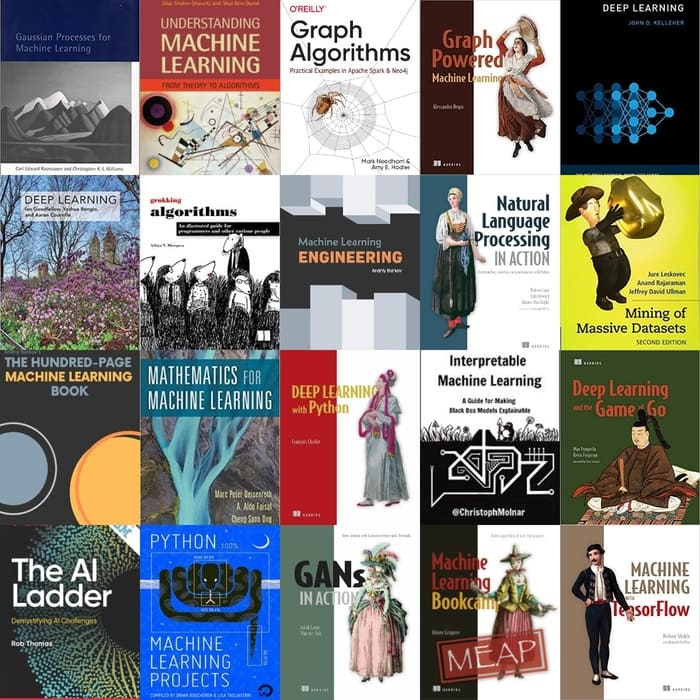
100 + free machine learning books
Recently, I sorted out a list of machine learning books from Insane. The list was just updated in May 2021, including the familiar "flower book" deep learning, and books on graph algorithms, natural language processing, data mining, GAN, Python, etc. I hope these free resources can help people who can't afford education to master data science from scratch.
Project address acquisition
1., pay attention to the official account below and click the top right corner.
2. Reply to the keyword "data science" in the background below for quick download: