How to use data mining "flower choke" in the end should not be used?
Based on Monte Carlo principle:
If all the expenditure in that month is paid by the flower, when the arrears of the flower in that month are greater than the expendable income in that month, it will "eat dirt".
_Budget design 120 months (10 years), if 10 years can not eat the soil, that represents the wish to come true.
- "What's the income?" —— Construction of Monthly Net Income Model
- "How much does it cost?" —— Construction of Monthly Expenditure Model
- "Do you eat earth?" —— The simulation of repayment using choke
- "What happens with the flower choke?" —— Look at the changes in the amount of reimbursement in different situations.
import numpy as np
import pandas as pd
import matplotlib.pyplot as plt
import matplotlib  as mpl
mpl.rcParams['font.sans-serif'] = ['simHei']
mpl.rcParams['axes.unicode_minus'] = False
import matplotlib.style as psl
psl.use('seaborn-colorblind')
% matplotlib inline
# Set an icon style
# Magic function
1. "What's the income?" —— Construction of Monthly Net Income Model
- Net Income = Monthly Salary - Five Insurance, One Gold + Bonus - Individual Income Tax
- Suppose you change a job with a monthly salary of 1W, and the company will give a bonus of about 1500 yuan per month based on performance.
Payment Coefficient of Shanghai Five Insurance and One Fund
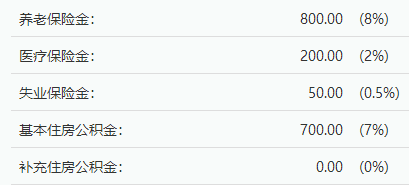
Shanghai Five Insurance One Gold and After-Tax Wage Calculator:
Individual tax policy
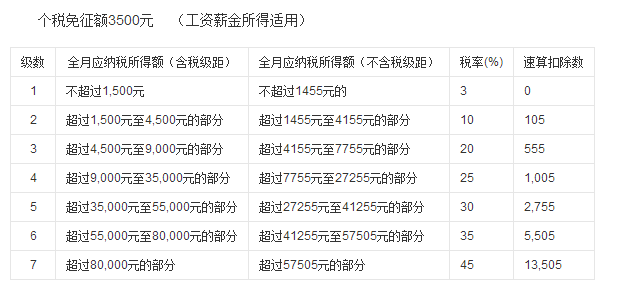
# Constructing Tax and Fee Calculating Function

def tax(salary_sum):
    if salary_sum <= 3500:
        # The monthly salary is less than 3500 yuan.
        return 0
    elif salary_sum <= (3500 + 1500):
        # The monthly salary ranges from 3500 to 4500 yuan.
        return (salary_sum - 3500) * 0.03
    elif salary_sum <= (3500 + 1500 + 3000):
        # The monthly salary is between 4500 and 8000 yuan.
        return 1500 * 0.03 + (salary_sum - 1500 - 3500) * 0.1
    elif salary_sum <= (3500 + 1500 + 3000 + 4500):
        # The monthly salary is between 8000 and 12500 yuan.
        return 1500 * 0.03 + 3000 * 0.1 + (salary_sum - 3500 - 1500 - 3000) * 0.2
    elif salary_sum <= (3500 + 1500 + 3000 + 4500 + 26000):
        # The monthly salary is between 1250 and 38500 yuan.
        return 1500 * 0.03 + 3000 * 0.1 + 4500 * 0.2 + (salary_sum - 3500 - 1500 - 3000 - 4500) * 0.25
    elif salary_sum <= (3500 + 1500 + 3000 + 4500 + 26000 + 20000):
        # The monthly salary ranges from 38500 to 58500 yuan.
        return 1500 * 0.03 + 3000 * 0.1 + 4500 * 0.2 + 26000 * 0.25 + (salary_sum - 3500 - 1500 - 3000 - 4500 - 26000) * 0.3
    elif salary_sum <= (3500 + 1500 + 3000 + 4500 + 26000 + 20000 + 25000):
        # The monthly salary is between 58500 and 83500 yuan.
        return 1500 * 0.03 + 3000 * 0.1 + 4500 * 0.2 + 26000 * 0.25 + 20000 * 0.3 + (salary_sum - 3500 - 1500 - 3000 - 4500 - 26000 - 20000) * 0.35
    else:
        # The monthly salary is over 83500 yuan.
        return 1500 * 0.03 + 3000 * 0.1 + 4500 * 0.2 + 26000 * 0.25 + 20000 * 0.3 + 25000 * 0.35 + (salary_sum - 3500 - 1500 - 3000 - 4500 - 26000 - 20000 - 25000) * 0.45

test = 45000
print('Function construction is completed, and the monthly salary is ___________%.1f In Yuan Dynasty, taxes are required.%.2f element' % (test,tax(test)))
When the monthly salary is 45,000.0 yuan, the tax will be 9,695.00 yuan.
# Constructing Five Risks and One Gold Function

def insurance(salary):
    if salary <= 21396:
        return salary * 0.175
    else:
        return 3744.58

test = 15000
print('Function construction is completed, and the monthly salary is ___________%.1f In Yuan Dynasty, you need to pay five insurance and one fund.%.2f element' % (test,insurance(test)))
When the monthly salary is 15,000.0 yuan, you need to pay 2,625.00 yuan for five insurance and one fund.
# Construction of bonus stochastic function

def bonus(b_avg):
    # Preset 10-year bonus to generate 120 random values
    return pd.Series(np.random.normal(loc = b_avg,scale = 200,size = 120))

print('When the average bonus is 1500, the random array is:')
print(bonus(1500)[:10])

plt.title('Bonus stochastic function - Data Distribution Histogram')
plt.hist(bonus(1500),bins = 30)
plt.grid()
# Drawing Histogram
When the average bonus is 1500, the random array is:
0    1367.490124
1    1707.555061
2    1891.970924
3    1500.842463
4    1578.909590
5    1370.132893
6    1702.545936
7    1686.156750
8    1591.627115
9    1742.975270
dtype: float64

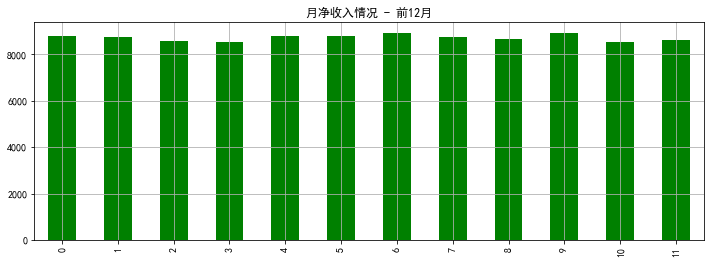
# Constructing monthly net income function

def final_income(s,b_avg):
    df_i = pd.DataFrame({
            'A monthly salary':[s for i in range(120)],                  # Monthly salary base
            'Five risks and one gold':[insurance(s) for i in range(120)],   # Calculate five risks and one fund
            'bonus':bonus(b_avg)                              # Calculated bonus
        })
    df_i['Taxable part'] = df_i['A monthly salary'] + df_i['bonus']
    df_i['Individual income tax'] = df_i['Taxable part'].apply(lambda x : tax(x))  # Calculating Individual Income Tax
    df_i['Monthly net income'] = df_i['A monthly salary'] - df_i['Five risks and one gold'] + df_i['bonus'] - df_i['Individual income tax']
    return df_i
    # Return return a dataframe

result = final_income(10000,1500)
# Test results net monthly income at 10,000 yuan monthly income and an average bonus of 1,500 yuan

result['Monthly net income'].iloc[:12].plot(kind='bar',figsize = (12,4),color='Green')
plt.title('Net monthly income - Former December')
plt.grid()

result.head()
# head() Views the first five pieces of data
| Five risks and one gold | bonus | A monthly salary | Taxable part | Individual income tax | Monthly net income | |
|---|---|---|---|---|---|---|
| 0 | 1750.0 | 1588.668883 | 10000 | 11588.668883 | 1062.733777 | 8775.935107 |
| 1 | 1750.0 | 1539.295856 | 10000 | 11539.295856 | 1052.859171 | 8736.436685 |
| 2 | 1750.0 | 1341.057045 | 10000 | 11341.057045 | 1013.211409 | 8577.845636 |
| 3 | 1750.0 | 1295.503319 | 10000 | 11295.503319 | 1004.100664 | 8541.402655 |
| 4 | 1750.0 | 1593.091777 | 10000 | 11593.091777 | 1063.618355 | 8779.473421 |
2. "How much does it cost?" —— Construction of Monthly Expenditure Model
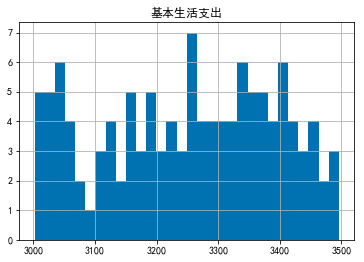
- Basic living expenses her luxurious life, 100 a day is not the case, but because it is basic expenditure, the change will not be too big. I set a limit of 3,000 yuan and 3,500 yuan, evenly distributed.
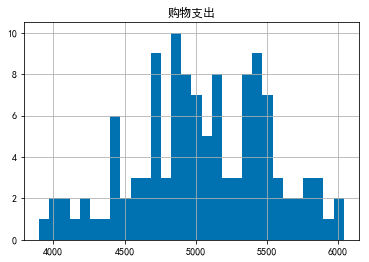
- Shopping expenditure Secret love object has a famous saying, "two salaries, half shopping." Therefore, the model is set as a normal distribution with 5000 yuan as the mean and 500 yuan as the standard deviation.
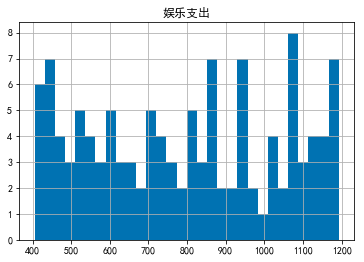
- Entertainment expenses a large number of intimate lover's girlfriends, once a week girl's night is indispensable, spend at least 100, more than 300 is not excessive. Therefore, the model is set to 400 yuan and 1200 yuan, uniformly distributed.
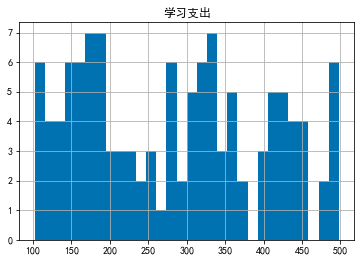
- Learning expenditure loving learning should be a rare advantage of secret love. The price of a course on an online platform ranges from 100 yuan to 500 yuan. So, this can also set up a uniform distribution model.
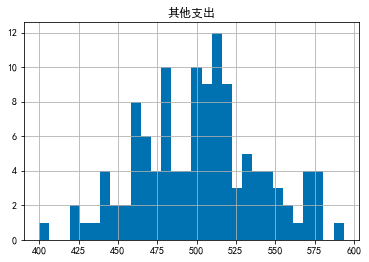
- Other expenses Every month there will always be some unexpected things, such as going out and dropping a wallet and so on. So, in order to make the calculation as close as possible to reality, I Set 500 yuan as the mean and 40 yuan as the normal distribution model of standard deviation.
Total Expenditure = Basic Life + Shopping + Entertainment + Learning + Other
# Basic living expenses

general_expense = pd.Series(np.random.randint(3000,3501,size=120))
plt.title('Basic living expenses')
plt.hist(general_expense,bins = 30)
plt.grid()
# Drawing Histogram
# Shopping expenditure

shopping = pd.Series(np.random.normal(loc=5000,scale=500,size=120))
plt.title('Shopping expenditure')
plt.hist(shopping,bins = 30)
plt.grid()
# Drawing Histogram
# Entertainment expenditure

happy = pd.Series(np.random.randint(400,1200,size=120))
plt.title('Entertainment expenditure')
plt.hist(happy,bins = 30)
plt.grid()
# Drawing Histogram
# Learning expenditure

study = pd.Series(np.random.randint(100,500,size=120))
plt.title('Learning expenditure')
plt.hist(study,bins = 30)
plt.grid()
# Drawing Histogram
# Other expenditure

other = pd.Series(np.random.normal(loc=500,scale=40,size=120))
plt.title('Other expenditure')
plt.hist(other,bins = 30)
plt.grid()
# Drawing Histogram
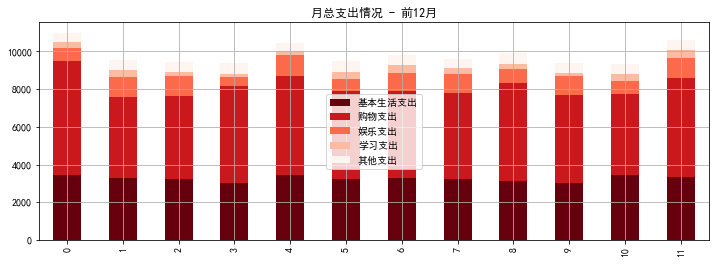
# Building monthly expenditure function

def final_expense():
    df_i = pd.DataFrame({
            'Basic living expenses':np.random.randint(3000,3501,size=120),
            'Shopping expenditure':np.random.normal(loc=5000,scale=500,size=120),
            'Entertainment expenditure':np.random.randint(400,1200,size=120),
            'Learning expenditure':np.random.randint(100,500,size=120),
            'Other expenditure':np.random.normal(loc=500,scale=40,size=120)
        })
    df_i['Monthly total expenditure'] = df_i['Basic living expenses'] + df_i['Shopping expenditure'] + df_i['Entertainment expenditure'] + df_i['Learning expenditure'] + df_i['Other expenditure']
    return df_i
    # Return return a dataframe

result = final_expense()
# Test Result Random Construction of Monthly Expenditure

result[['Basic living expenses','Shopping expenditure','Entertainment expenditure','Learning expenditure','Other expenditure']].iloc[:12].plot(kind='bar',
                                                              figsize = (12,4),
                                                              stacked = True,
                                                              colormap = 'Reds_r')
plt.title('Total monthly expenditure - Former December')
plt.grid()

result.head()
| Other expenditure | Basic living expenses | Entertainment expenditure | Learning expenditure | Shopping expenditure | Monthly total expenditure | |
|---|---|---|---|---|---|---|
| 0 | 497.302429 | 3440 | 689 | 317 | 6042.073209 | 10985.375638 |
| 1 | 492.882529 | 3297 | 1049 | 382 | 4306.480868 | 9527.363398 |
| 2 | 538.277618 | 3208 | 1062 | 235 | 4411.161792 | 9454.439410 |
| 3 | 564.221604 | 3026 | 504 | 159 | 5129.968614 | 9383.190218 |
| 4 | 460.558753 | 3431 | 1121 | 174 | 5284.007878 | 10470.566631 |
3. "Do you eat earth?" —— The simulation of repayment using choke
Organize several constraints:
- Pay the arrears monthly before spending.
- All expenditures can be overdrawn with the exception of repayments.
- When your monthly income is less than or equal to the amount of money you need to repay, it means you're going to eat dirt.
- The total credit limit of Huachong is 15,000 yuan.
So how to calculate the production (soil)?
When the amount of money needed to borrow and borrow in that month is equal to the balance at the beginning of the month + monthly income - monthly expenditure - the amount needed to borrow and borrow in this month is greater than 15,000
# Establish monthly income, expenditure, balance at the beginning of the month, and need to spend more than 120 months. Here we use 0 yuan to fill in.

income = final_income(10000,1500)['Monthly net income'].tolist()
expense = final_expense()['Monthly total expenditure'].tolist()
saving = [0 for i in range(120)]
debt = [0 for i in range(120)]

print('The monthly income, monthly expenditure and the balance at the beginning of the month (not calculated) for the first six months and the required (uncalculated) data for this month are as follows:\n')
print(income[:6])
print(expense[:6])
print(saving[:6])
print(debt[:6])
The monthly income, monthly expenditure and the balance at the beginning of the month (not calculated) for the first six months and the required (uncalculated) data for this month are as follows:

[8671.354407484552, 8869.05979519114, 8604.519596925978, 9075.881643538856, 8605.88945231119, 8696.638150398318]
[10678.765703440291, 10348.918097588125, 10200.358235336866, 8987.087371851503, 9377.37124634694, 9414.932245897835]
[0, 0, 0, 0, 0, 0]
[0, 0, 0, 0, 0, 0]
Round 1: No staging
# Second month derivation

if income[0] >= expense[0]:
    '''
    When the first month's income is greater than or equal to expenditure:
    Balance at the beginning of the second month = income in the first month - Expenditure in the first month
    Need to spend another month = 0
    '''
    saving[1] = income[0] - expense[0]
    debt[1] = 0
else:
    '''
    When income is less than expenditure in the first month:
    The balance at the beginning of the second month = 0
    Need to spend in the second month = expenditure in the first month - income in the first month
    '''
    saving[1] = 0
    debt[1] = expense[0] - income[0]

print(income[:2])
print(expense[:2])
print(saving[:2])
print(debt[:2])
[8671.354407484552, 8869.05979519114]
[10678.765703440291, 10348.918097588125]
[0, 0]
[0, 2007.4112959557388]
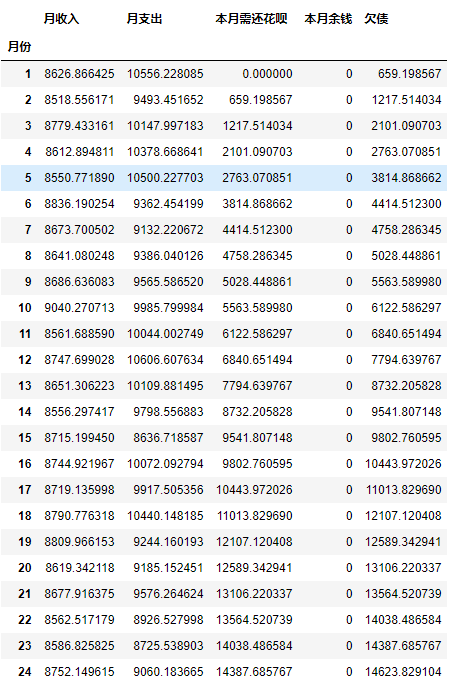
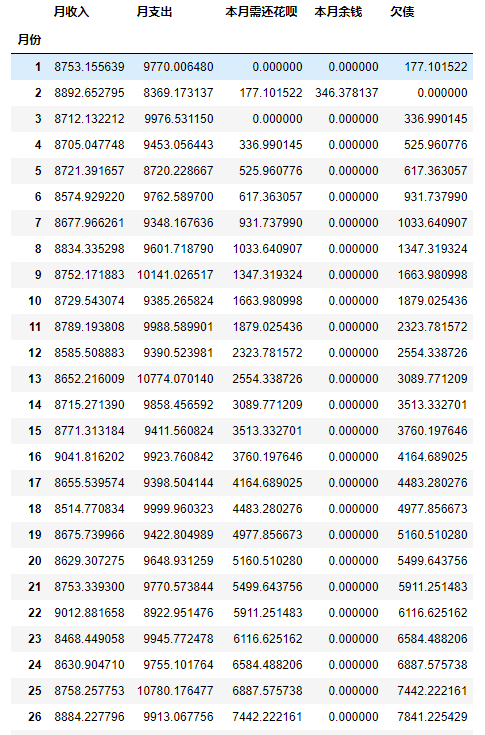
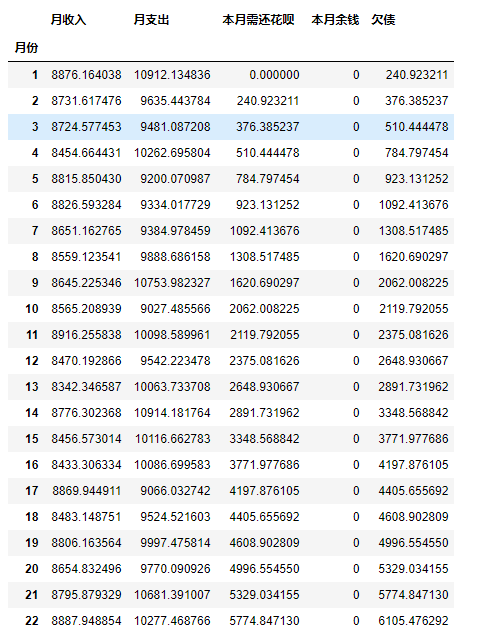
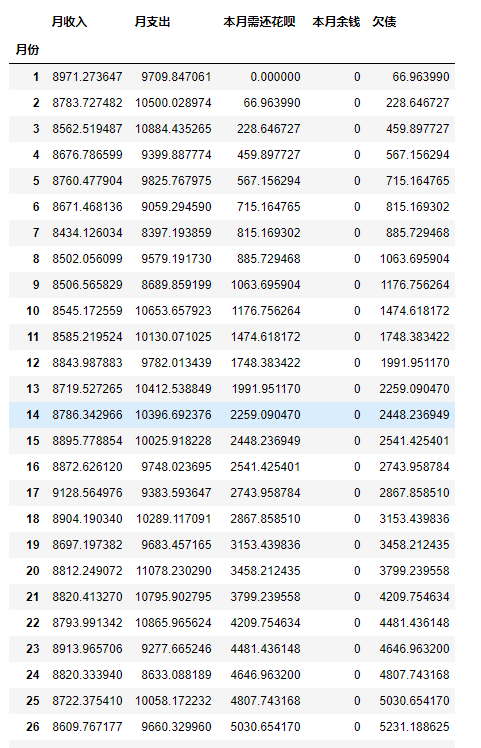
# Building function simulation

income = final_income(10000,1500)['Monthly net income'].tolist()
expense = final_expense()['Monthly total expenditure'].tolist()
saving = [0 for i in range(120)]
debt = [0 for i in range(120)]

def case_a():
    month = []
    data = []
    # Create two empty lists to store monthly and monthly data

    for i in range(120):
        money = saving[i] + income[i] - debt[i] - expense[i]  # The amount of money needed to borrow in the current month = the balance at the beginning of the month + the monthly income - monthly expenditure - the monthly amount needed to be spent in the current month
        #print(money)
        if -money > 15000:
            # When the monthly loan amount is more than 15,000 yuan
            print('The first%i Monthly flowers can't save me anymore. We're going to break the crop.\n-------' % (i+1))
            break
        else:
            # When the monthly borrowing cost is less than or equal to 15,000 yuan continue wave
            if money >= 0:
                saving[i+1] = saving[i] + income[i] - expense[i] - debt[i]
                debt[i+1] = 0
            else:
                saving[i+1] = 0
                debt[i+1] = expense[i] + debt[i] - income[i] - saving[i]
        month.append(i+1)
        data.append([income[i],expense[i],debt[i],saving[i+1],debt[i+1]])
    # Create a cycle to simulate monthly flower choke usage

    result_a = pd.DataFrame(data,columns=['monthly income','Monthly expenditure','Need to spend this month','The rest of the month','Debt due'],index = month)
    result_a.index.name = 'Month'
    # Store data as a Dataframe

    return result_a

case_a()
In the thirteenth month, the flower choke can't save me. It's going to break (eat) the produce (soil).
-------
| monthly income | Monthly expenditure | Need to spend this month | The rest of the month | Debt due | |
|---|---|---|---|---|---|
| Month | |||||
| 1 | 8681.780967 | 9877.634413 | 0.000000 | 0 | 1195.853445 |
| 2 | 8738.951195 | 9071.504566 | 1195.853445 | 0 | 1528.406817 |
| 3 | 9065.070601 | 11252.336547 | 1528.406817 | 0 | 3715.672763 |
| 4 | 8360.093435 | 11018.560639 | 3715.672763 | 0 | 6374.139966 |
| 5 | 8809.520601 | 10355.257101 | 6374.139966 | 0 | 7919.876467 |
| 6 | 8868.918668 | 8705.602349 | 7919.876467 | 0 | 7756.560148 |
| 7 | 8491.283500 | 10039.671667 | 7756.560148 | 0 | 9304.948315 |
| 8 | 8728.472345 | 9619.446057 | 9304.948315 | 0 | 10195.922026 |
| 9 | 8428.517242 | 9300.045999 | 10195.922026 | 0 | 11067.450783 |
| 10 | 8734.875596 | 9913.616808 | 11067.450783 | 0 | 12246.191994 |
| 11 | 8885.632756 | 9104.904071 | 12246.191994 | 0 | 12465.463309 |
| 12 | 8739.980131 | 10287.163476 | 12465.463309 | 0 | 14012.646655 |
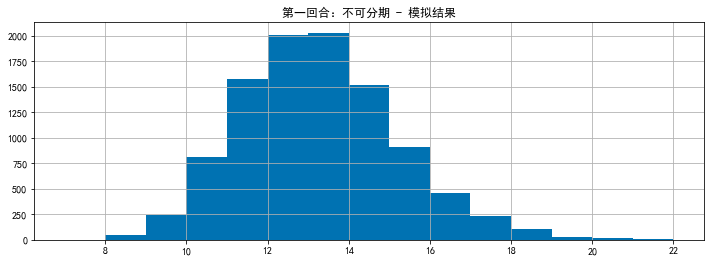
# Round 1: 10,000 simulations without staging to see the month of bankruptcy

month_case_a = []
for i in range(10000):
    print('In progress%i Sub simulation' % (i+1))
    income = final_income(10000,1500)['Monthly net income'].tolist()
    expense = final_expense()['Monthly total expenditure'].tolist()
    saving = [0 for i in range(120)]
    debt = [0 for i in range(120)]
    result_a = case_a().index.max()
    month_case_a.append(result_a)

result_a = pd.Series(month_case_a)

# Based on 10,000 simulated broken (eating) production (soil) months, making histogram

plt.figure(figsize = (12,4))
result_a.hist(bins=15)
plt.title('First Round: Not Staged - Simulation results')
Round 2: Staging allowed
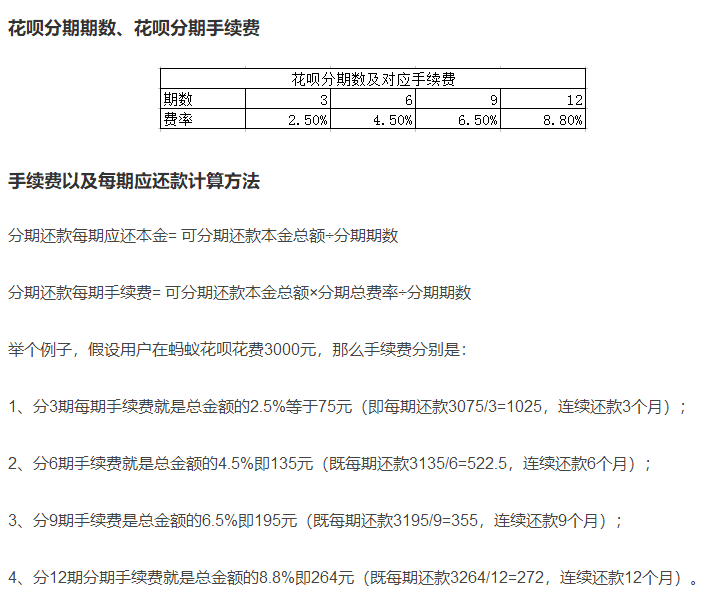
Installation is equivalent to apportioning the amount of money that needs to be repaid in the current month to the next few months, which reduces the burden of the current month, but at the expense of paying a certain amount of interest. At this point, I quickly turned out the Huachou interest rate table:

You can see that ____________ Now the annual rate is 3.5%, and the staging rate is about 10%!!!
# Building Function Simulation - Staged March

income = final_income(10000,1500)['Monthly net income'].tolist()
expense = final_expense()['Monthly total expenditure'].tolist()
saving = [0 for i in range(120)]
debt = [0 for i in range(120)]

def case_b():
    month = []
    data = []
    # Create two empty lists to store monthly and monthly data

    for i in range(120):
        money = saving[i] + income[i] - debt[i] - expense[i]  # The amount of money needed to borrow in the current month = the balance at the beginning of the month + the monthly income - monthly expenditure - the monthly amount needed to be spent in the current month
        #print(money)
        if -money > 15000:
            # When the monthly loan amount is more than 15,000 yuan
            print('The first%i Monthly flowers can't save me anymore. We're going to break the crop.\n-------' % (i+1))
            break
        else:
            # When the monthly borrowing cost is less than or equal to 15,000 yuan continue wave
            if money >= 0:
                saving[i+1] = saving[i] + income[i] - expense[i] - debt[i]
                debt[i+1] = 0
            else:
                money_per = (abs(money) * (1+0.025))/3    # By March
                saving[i+1] = 0
                debt[i+1] = debt[i+1] + money_per
                debt[i+2] = debt[i+2] + money_per
                debt[i+3] = debt[i+3] + money_per
        month.append(i+1)
        data.append([income[i],expense[i],debt[i],saving[i+1],debt[i+1]])
    # Create a cycle to simulate monthly flower choke usage

    result_b = pd.DataFrame(data,columns=['monthly income','Monthly expenditure','Need to spend this month','The rest of the month','Debt due'],index = month)
    result_b.index.name = 'Month'
    # Store data as a Dataframe

    return result_b

case_b()
# Building Function Simulation - Staged June

income = final_income(10000,1500)['Monthly net income'].tolist()
expense = final_expense()['Monthly total expenditure'].tolist()
saving = [0 for i in range(120)]
debt = [0 for i in range(120)]

def case_c():
    month = []
    data = []
    # Create two empty lists to store monthly and monthly data

    for i in range(120):
        money = saving[i] + income[i] - debt[i] - expense[i]  # The amount of money needed to borrow in the current month = the balance at the beginning of the month + the monthly income - monthly expenditure - the monthly amount needed to be spent in the current month
        #print(money)
        if -money > 15000:
            # When the monthly loan amount is more than 15,000 yuan
            print('The first%i Monthly flowers can't save me anymore. We're going to break the crop.\n-------' % (i+1))
            break
        else:
            # When the monthly borrowing cost is less than or equal to 15,000 yuan continue wave
            if money >= 0:
                saving[i+1] = saving[i] + income[i] - expense[i] - debt[i]
                debt[i+1] = 0
            else:
                money_per = (abs(money) * (1+0.045))/6    # By June
                saving[i+1] = 0
                debt[i+1] = debt[i+1] + money_per
                debt[i+2] = debt[i+2] + money_per
                debt[i+3] = debt[i+3] + money_per
                debt[i+4] = debt[i+4] + money_per
                debt[i+5] = debt[i+5] + money_per
                debt[i+6] = debt[i+6] + money_per
        month.append(i+1)
        data.append([income[i],expense[i],debt[i],saving[i+1],debt[i+1]])
    # Create a cycle to simulate monthly flower choke usage

    result_c = pd.DataFrame(data,columns=['monthly income','Monthly expenditure','Need to spend this month','The rest of the month','Debt due'],index = month)
    result_c.index.name = 'Month'
    # Store data as a Dataframe

    return result_c

case_c()
# Building Function Simulation - Sept.

income = final_income(10000,1500)['Monthly net income'].tolist()
expense = final_expense()['Monthly total expenditure'].tolist()
saving = [0 for i in range(120)]
debt = [0 for i in range(120)]

def case_d():
    month = []
    data = []
    # Create two empty lists to store monthly and monthly data

    for i in range(120):
        money = saving[i] + income[i] - debt[i] - expense[i]  # The amount of money needed to borrow in the current month = the balance at the beginning of the month + the monthly income - monthly expenditure - the monthly amount needed to be spent in the current month
        #print(money)
        if -money > 15000:
            # When the monthly loan amount is more than 15,000 yuan
            print('The first%i Monthly flowers can't save me anymore. We're going to break the crop.\n-------' % (i+1))
            break
        else:
            # When the monthly borrowing cost is less than or equal to 15,000 yuan continue wave
            if money >= 0:
                saving[i+1] = saving[i] + income[i] - expense[i] - debt[i]
                debt[i+1] = 0
            else:
                money_per = (abs(money) * (1+0.065))/9    # By September
                saving[i+1] = 0
                debt[i+1] = debt[i+1] + money_per
                debt[i+2] = debt[i+2] + money_per
                debt[i+3] = debt[i+3] + money_per
                debt[i+4] = debt[i+4] + money_per
                debt[i+5] = debt[i+5] + money_per
                debt[i+6] = debt[i+6] + money_per
                debt[i+7] = debt[i+7] + money_per
                debt[i+8] = debt[i+8] + money_per
                debt[i+9] = debt[i+9] + money_per
        month.append(i+1)
        data.append([income[i],expense[i],debt[i],saving[i+1],debt[i+1]])
    # Create a cycle to simulate monthly flower choke usage

    result_d = pd.DataFrame(data,columns=['monthly income','Monthly expenditure','Need to spend this month','The rest of the month','Debt due'],index = month)
    result_d.index.name = 'Month'
    # Store data as a Dataframe

    return result_d

case_d()
# Build Function Simulation - Staged December

income = final_income(10000,1500)['Monthly net income'].tolist()
expense = final_expense()['Monthly total expenditure'].tolist()
saving = [0 for i in range(120)]
debt = [0 for i in range(120)]

def case_e():
    month = []
    data = []
    # Create two empty lists to store monthly and monthly data

    for i in range(120):
        money = saving[i] + income[i] - debt[i] - expense[i]  # The amount of money needed to borrow in the current month = the balance at the beginning of the month + the monthly income - monthly expenditure - the monthly amount needed to be spent in the current month
        #print(money)
        if -money > 15000:
            # When the monthly loan amount is more than 15,000 yuan
            print('The first%i Monthly flowers can't save me anymore. We're going to break the crop.\n-------' % (i+1))
            break
        else:
            # When the monthly borrowing cost is less than or equal to 15,000 yuan continue wave
            if money >= 0:
                saving[i+1] = saving[i] + income[i] - expense[i] - debt[i]
                debt[i+1] = 0
            else:
                money_per = (abs(money) * (1+0.088))/12    # Staging December
                saving[i+1] = 0
                debt[i+1] = debt[i+1] + money_per
                debt[i+2] = debt[i+2] + money_per
                debt[i+3] = debt[i+3] + money_per
                debt[i+4] = debt[i+4] + money_per
                debt[i+5] = debt[i+5] + money_per
                debt[i+6] = debt[i+6] + money_per
                debt[i+7] = debt[i+7] + money_per
                debt[i+8] = debt[i+8] + money_per
                debt[i+9] = debt[i+9] + money_per
                debt[i+10] = debt[i+10] + money_per
                debt[i+11] = debt[i+11] + money_per
                debt[i+12] = debt[i+12] + money_per
        month.append(i+1)
        data.append([income[i],expense[i],debt[i],saving[i+1],debt[i+1]])
    # Create a cycle to simulate monthly flower choke usage

    result_e = pd.DataFrame(data,columns=['monthly income','Monthly expenditure','Need to spend this month','The rest of the month','Debt due'],index = month)
    result_e.index.name = 'Month'
    # Store data as a Dataframe

    return result_e

case_e()
# Round 2: Permissible staging (March staging)

month_case_b = []
for i in range(10000):
    print('In progress%i Sub simulation' % (i+1))
    income = final_income(10000,1500)['Monthly net income'].tolist()
    expense = final_expense()['Monthly total expenditure'].tolist()
    saving = [0 for i in range(120)]
    debt = [0 for i in range(120)]
    result_b = case_b().index.max()
    month_case_b.append(result_b)

result_b = pd.Series(month_case_b)

# Round 2: Staging allowed (June)

month_case_c = []
for i in range(10000):
    print('In progress%i Sub simulation' % (i+1))
    income = final_income(10000,1500)['Monthly net income'].tolist()
    expense = final_expense()['Monthly total expenditure'].tolist()
    saving = [0 for i in range(120)]
    debt = [0 for i in range(120)]
    result_c = case_c().index.max()
    month_case_c.append(result_c)

result_c = pd.Series(month_case_c)

# Round 2: Permissible staging (September staging)

month_case_d = []
for i in range(10000):
    print('In progress%i Sub simulation' % (i+1))
    income = final_income(10000,1500)['Monthly net income'].tolist()
    expense = final_expense()['Monthly total expenditure'].tolist()
    saving = [0 for i in range(120)]
    debt = [0 for i in range(120)]
    result_d = case_d().index.max()
    month_case_d.append(result_d)

result_d = pd.Series(month_case_d)

# Round 2: Permissible staging (December staging)

month_case_e = []
for i in range(10000):
    print('In progress%i Sub simulation' % (i+1))
    income = final_income(10000,1500)['Monthly net income'].tolist()
    expense = final_expense()['Monthly total expenditure'].tolist()
    saving = [0 for i in range(120)]
    debt = [0 for i in range(120)]
    result_e = case_e().index.max()
    month_case_e.append(result_e)

result_e = pd.Series(month_case_e)

# Based on 10,000 simulated break (eat) produce (soil) months, make histogram-staged March
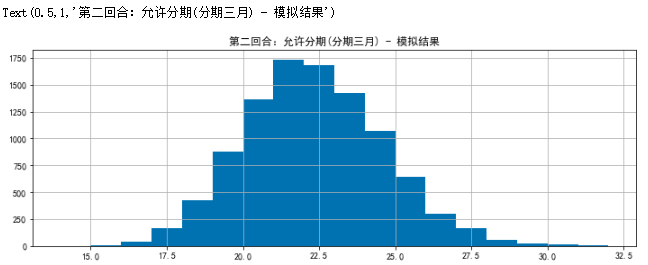
plt.figure(figsize = (12,4))
result_b.hist(bins=18)
plt.title('Round 2: Staging allowed(By March) - Simulation results')
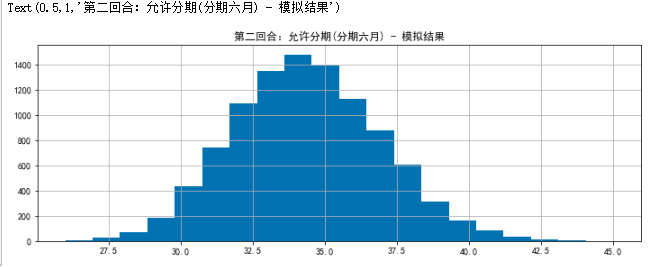
# Based on 10,000 simulated break (eat) production (soil) months, make histogram-staged June

plt.figure(figsize = (12,4))
result_c.hist(bins=20)
plt.title('Round 2: Staging allowed(By June) - Simulation results')
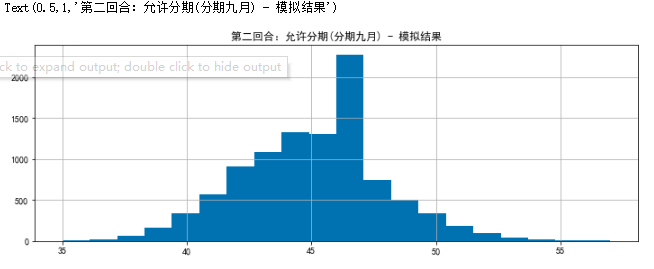
# Based on 10,000 simulated broken (eating) production (soil) months, make a histogram-staged September

plt.figure(figsize = (12,4))
result_d.hist(bins=20)
plt.title('Round 2: Staging allowed(By September) - Simulation results')
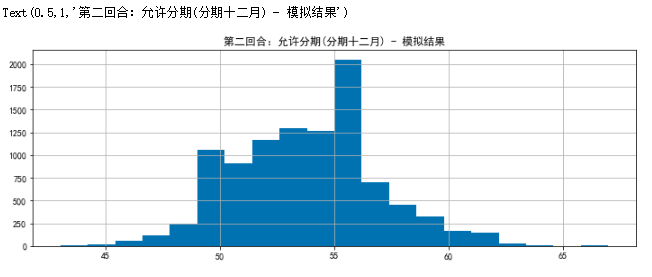
# Based on 10,000 simulated break (eat) production (soil) months, make histogram-staged December

plt.figure(figsize = (12,4))
result_e.hist(bins=20)
plt.title('Round 2: Staging allowed(Staging December) - Simulation results')
4. "What happens when you use the flower choke?" —— Look at the changes in the amount of reimbursement in different situations.
# View data
income = final_income(10000,1500)['Monthly net income'].tolist()
expense = final_expense()['Monthly total expenditure'].tolist()
saving = [0 for i in range(120)]
debt = [0 for i in range(120)]
r1 = case_a()['Debt due']
income = final_income(10000,1500)['Monthly net income'].tolist()
expense = final_expense()['Monthly total expenditure'].tolist()
saving = [0 for i in range(120)]
debt = [0 for i in range(120)]
r2 = case_b()['Debt due']
income = final_income(10000,1500)['Monthly net income'].tolist()
expense = final_expense()['Monthly total expenditure'].tolist()
saving = [0 for i in range(120)]
debt = [0 for i in range(120)]
r3 = case_c()['Debt due']
income = final_income(10000,1500)['Monthly net income'].tolist()
expense = final_expense()['Monthly total expenditure'].tolist()
saving = [0 for i in range(120)]
debt = [0 for i in range(120)]
r4 = case_d()['Debt due']
income = final_income(10000,1500)['Monthly net income'].tolist()
expense = final_expense()['Monthly total expenditure'].tolist()
saving = [0 for i in range(120)]
debt = [0 for i in range(120)]
r5 = case_e()['Debt due']
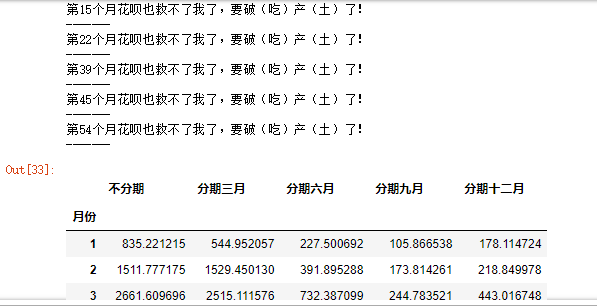
df = pd.DataFrame({'No staging':r1,'By March':r2,'By June':r3,'By September':r4,'Staging December':r5},
columns = ['No staging','By March','By June','By September','Staging December'])
df
# Merge data connections in different situations
# Making polygons

df.plot(kind='line',style = '--.',alpha = 0.8,use_index = True,figsize = (12,4),legend = True,colormap = 'Accent')
plt.title('Accumulation of liabilities under different circumstances')
plt.grid()
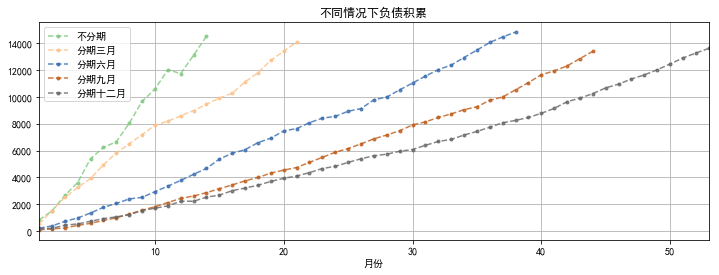
Some conclusions
- The longer the staging time is, the longer the time that can be spent without eating soil will be, indicating that overdraft and borrowing can greatly delay the time faced with eating soil.
- When incomes do not match "higher living standards", spending can prolong time, but debt will accumulate all the time.