If you program in Windows, you should know some memory management of Windows, but Pile( Heap) is also part of memory management. This article may be helpful for you to understand the basic principle of Windows memory allocation and debug heap memory problems.
Windows Heap overview
The following figure is drawn with reference to < < windows advanced debugging > >, and some small modifications have been made. It can be seen that there are three main direct operations on the heap in the program:
- Process default heap. When each process starts, the system will create a default heap. For example, LocalAlloc or GlobalAlloc also allocates memory from the process default heap. You can also use GetProcessHeap to get the handle of the default heap of the process, and then use this handle to call heaprealloc to allocate memory on the system default heap.
- malloc and new are commonly used in C + + programming to apply for memory. These methods are provided by CRT library. According to the view, before VS2010 (included), the CRT library will use HeapCreate to create a heap for the CRT library to use. After VS2015, the implementation of CRT library will not create a separate heap, but use the process default heap. (I haven't checked the CRT source code of VS2013. If you are interested, you can see whether the default CRT Library of VS2013 adopts the process default heap or the new heap).
- Self built reactor. This generally refers to the heap created by the program through HeapCreate, and then uses API s such as HeapAlloc to operate the heap, such as applying for space.

The heap manager implements heap management by calling some methods of the virtual manager, such as functions such as VirtualAlloc. Similarly, applications can directly use functions such as VirtualAlloc to use memory.
This is a bit awkward. Let's write an example code to see the heap of a process.
#include <windows.h>
#include <iostream>
#include <intsafe.h>

using namespace std;
const char* GetHeapTypeString(HANDLE pHandle)
{
	ULONG ulHeapInfo;
	HeapQueryInformation(pHandle,
		HeapCompatibilityInformation,
		&ulHeapInfo,
		sizeof(ulHeapInfo),
		NULL);
	switch (ulHeapInfo)
	{
	case 0:
		return "Standard";
	case 1:
		return "Look Aside List";
	case 2:
		return "Low Fragmentation";
	}
	return "Unknow type";
}

void PrintAllHeaps()
{

	DWORD dwNumHeap = GetProcessHeaps(0, NULL);
	if (dwNumHeap == 0)
	{
		cout << "No Heap!" << endl;
		return;
	}

	PHANDLE pHeaps;
	SIZE_T  uBytes;
	HRESULT Result = SIZETMult(dwNumHeap, sizeof(*pHeaps), &uBytes);
	if (Result != S_OK) {
		return;
	}

	pHeaps = (PHANDLE)malloc(uBytes);
	dwNumHeap = GetProcessHeaps(dwNumHeap, pHeaps);
	cout << "Process has heaps: " << dwNumHeap << endl;
	for (int i = 0; i < dwNumHeap; ++i)
	{
		cout << "Heap Address: " << pHeaps[i]
			<< ", Heap Type: " << GetHeapTypeString(pHeaps[i]) << endl;
	}

	return;
}

int main()
{
	cout << "========================" << endl;
	PrintAllHeaps();
	cout << "========================" << endl;

	HANDLE hDefaultHeap = GetProcessHeap();
	cout << "Default Heap: " << hDefaultHeap
		<< ", Heap Type: " << GetHeapTypeString(hDefaultHeap) << endl;

	return 0;
}
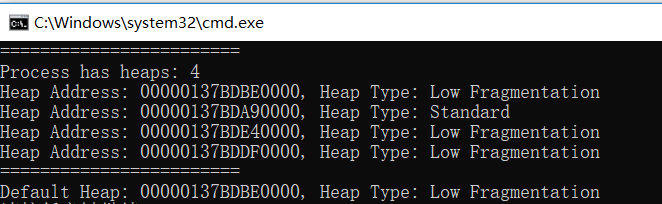
This is the result of the output of a 64 bit program running on Win10: this process does not create a Heap as shown in main. We all know that the initialization of the process will create relevant resources when it is started, including the Heap. This process creates four heaps. It can be seen that the first Heap is the default Heap of the process and is the Heap with the allocation strategy of Low Fragmentation.
Memory allocation strategy for heap
Heap mainly includes front-end allocator and back-end allocator. As I understand it, the front-end allocator is similar to cache, which is convenient for fast query of the required memory blocks. When the current end allocator is uncertain, it will be handed over to the back-end allocator.

The front-end allocator is mainly divided into, and the default heap of processes after Windows Vista adopts the low fragment front-end allocator.
- Look aside list
- Low fragmentation
The following scenarios are described using 32-bit programs.
Side view list of front-end distributor
Look aside list (LAL) is an old front-end allocator, which is used in Windows XP.
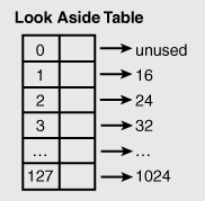
This is a continuous array with a size of 128. Each element corresponds to a linked list. Because it stores the size of the whole Heap block, it includes the size applied by the user + Heap block metadata. Here, the metadata size is 8 bytes, and the minimum allocation granularity is 8 bytes (32-bit program), so the minimum Heap block size is 16 bytes. From data 1 to 127, the Heap block size stored in each linked list lock increases according to the granularity of 8 bytes.
Then, when the user applies for a memory with a size of 10 bytes, the heap block size found in the LAL is 18 bytes = 10 bytes + 8 bytes of metadata, and the node with a matching heap block size of 24 bytes is found in the table and deleted from the linked list.
When the user releases the memory, it will also give priority to check whether the front-end processor processes it. If it does, it will insert the memory into the corresponding linked list.
Low fragmentation of front-end distributor
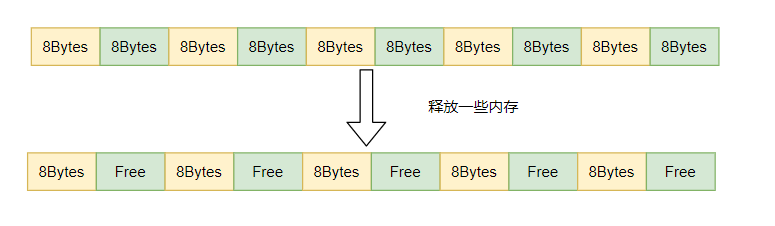
Let's talk about memory fragmentation first. Let me give a brief overview here: as shown in the figure below, suppose that a large continuous memory is divided into several 8-byte memory blocks, and then the memory blocks in the green part of the figure are released at this time. At this time, a total of 40 bytes of memory are empty, but if you want to apply for a 16 byte memory block, you can't apply for a continuous 16 byte memory block, Thus, memory allocation fails, which is memory fragmentation.
The so-called low fragmentation front-end allocator redistributes the granularity in an array similar to LAL:
| Data Index | Heap incremental granularity | Heap block byte range |
|---|---|---|
| 0~31 | 8 | 8~256 |
| 32~47 | 16 | 272~512 |
| ... | ... | ... |
| 112-127 | 512 | 8704~16384 |
You can see the size of the same array and divide it according to different granularity. Compared with the size and granularity allocated by LAL, the granularity has gradually increased to 512 bytes in the last 112-127 interval, with the maximum supported size of 16384. Larger granularity allocation helps to alleviate memory fragmentation and improve memory efficiency. The default heap of processes after Windows Vista adopts a low fragmentation front-end allocator.
Back End Allocator
In fact, some people may be confused about the previous part. So how is our memory divided? This is what the backend allocator does. See how the back-end allocator manages this memory.
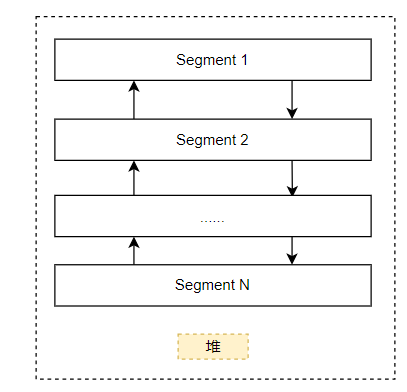
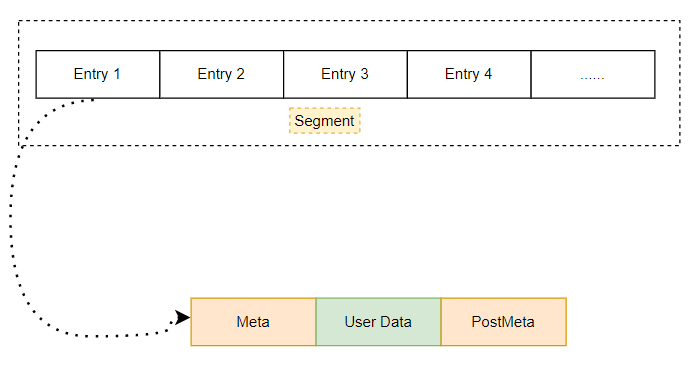
First, let's talk about the display form of heap in memory. A heap is mainly composed of several segments. Each Segment is a continuous space, and then it is connected with a two-way linked list. In general, there is only one Segment at first, and then space is applied for on this Segment, which is called heap entry. However, this Segment may be used up. Open a new Segment. Generally, the size of the new Segment is twice that of the original one. If the memory is insufficient, keep halving the application space. It should be noted that when a new Segment is divided, for example, its space is 1GBytes, then the actual physical memory used will certainly not be 1GBytes, because the memory has not been applied for by the application. In fact, this Segment only reserves this virtual address space. When the real application applies for memory, Only a small part of the Commit will be used, and the real physical storage space will be used at this time.
The memory applied by the application is called an entry (block) on the Segment. They are continuous. You can see that a block generally has:
- Pre metadata: it mainly stores the size of the current block, the size of the previous block, the status of the current block, etc.
- User data area: This is the memory requested and used by the user. Of course, this data may be larger than the memory you apply for, because the minimum allocation granularity under 32 bits is 8 bytes. This is why sometimes the program overflows a few characters, and there seems to be no reason for the program exception or crash.
- Post metadata: This is generally used for debugging. Generally, this space will not be occupied when publishing.
So which blocks can be used directly? This involves the state in the metadata of these blocks, which can indicate whether the block is occupied. If it is in an idle state, it can be used.
The back-end allocator will not foolishly traverse the state of all blocks to determine whether it can be allocated? At this time, the strategy of the back-end allocator is used.

This table is a bit similar to LAL. Just note that there is an additional list with index 0, which is arranged from small to large. Variable sizes ranging from more than 1016 bytes to less than 524272 bytes will be stored in this linked list.
Suppose that the front-end heap manager needs to find a 32 byte heap block at this time, how will the back-end manager operate?
At this time, the request goes to the back-end allocator. Assuming that no 32 byte free block is found in this table, the back-end allocator will first find a 64 byte free block. If found, it will be removed from the list, and then it will be divided into two 16 byte blocks. One will be set to occupied status and returned to the application, An idle state is inserted into the linked list of the response.
What if you haven't found it yet? At this time, the heap manager will commit more memory from the Segment to use and create new blocks. If the current Segment space is not enough, create a new Segment
Some careful students may say, is the front-end allocator similar to the back-end allocator? A very important thing is that the blocks in the front-end allocator linked list belong to the occupied state, while the blocks in the back-end allocator linked list belong to the idle state.
Suppose memory is released, what should I do?
First, it depends on whether the front-end allocator handles the released block, such as adding it to the corresponding linked list. If not, the back-end allocator will check whether the adjacent blocks are also idle. If it is idle, the blocks will be combined into a large block and operate on the corresponding back-end allocator linked list.
Of course, when you release enough memory, the heap manager will not occupy the space of physical memory for a long time, and will call the commit operation to reduce the use of physical memory when appropriate.
Windbg view heap in process
View process heap information
The process heap information is placed in the PEB (process environment block). You can see that the current process contains three heaps and the array address of the heap is 0x77756660 by viewing the PEB related information
0:000> dt _PEB @$peb
   ......
   +0x088 NumberOfHeaps    : 3
   ......
   +0x090 ProcessHeaps     : 0x77756660  -> 0x00fa0000 Void

   ......
Then we look at the addresses of the corresponding three heaps, 0xfa0000, 0x14b0000 and 0x2e10000 respectively, and the first is generally the default heap 00fa0000 of the process.
0:006> dd 0x77756660
77756660  00fa0000 014b0000 02e10000 00000000
77756670  00000000 00000000 00000000 00000000
77756680  00000000 00000000 00000000 00000000
77756690  00000000 00000000 00000000 00000000
777566a0  00000000 00000000 00000000 00000000
777566b0  00000000 00000000 00000000 00000000
777566c0  ffffffff ffffffff 00000000 00000000
777566d0  00000000 020007d0 00000000 00000000
In fact, Windbg provides a method to directly view the summary information in the above steps. You can see that the system default heap 00fa0000 is LFH heap, the reserved space is 1128k, and the committed memory is 552K.
0:000> !heap -s
......
LFH Key                   : 0x8302caa1
Termination on corruption : ENABLED
  Heap     Flags   Reserv  Commit  Virt   Free  List   UCR  Virt  Lock  Fast
                    (k)     (k)    (k)     (k) length      blocks cont. heap
-----------------------------------------------------------------------------
00fa0000 00000002    1128    552   1020    178    21     1    1      0   LFH
014b0000 00001002      60     12     60      1     2     1    0      0
02e10000 00001002    1188     92   1080      4     4     2    0      0   LFH
-----------------------------------------------------------------------------
You can use DT_ The heap 00fa0000 command can be used to view the information of the process default heap, or through the command directly provided by Windbg. It can be seen that the minimum granularity of the allocated space is 8 bytes. And there is only one Segment
0:006> !heap -a 00fa0000
Index   Address  Name      Debugging options enabled
  1:   00fa0000
    Segment at 00fa0000 to 0109f000 (00089000 bytes committed)
    Flags:                00000002
    ForceFlags:           00000000
    Granularity:          8 bytes
    Segment Reserve:      00100000
    Segment Commit:       00002000
    DeCommit Block Thres: 00000800
    DeCommit Total Thres: 00002000
    Total Free Size:      0000597f
    Max. Allocation Size: 7ffdefff
    Lock Variable at:     00fa0248
    Next TagIndex:        0000
    Maximum TagIndex:     0000
    Tag Entries:          00000000
    PsuedoTag Entries:    00000000
    Virtual Alloc List:   00fa009c
        03321000: 00100000 [commited 101000, unused 1000] - busy (b), tail fill
    Uncommitted ranges:   00fa008c
            01029000: 00076000  (483328 bytes)
    FreeList[ 00 ] at 00fa00c0: 00ffcf40 . 00ff3290
        00ff3288: 00208 . 00010 [100] - free
        00fb1370: 00060 . 00010 [100] - free
        00fb10a0: 00020 . 00010 [100] - free
        00fa6c40: 00088 . 00010 [100] - free
        00fa8e98: 00010 . 00010 [100] - free
        00fafa78: 000d0 . 00018 [100] - free
        00faea20: 00138 . 00018 [100] - free
        00fafc38: 00030 . 00020 [100] - free
        00ff4570: 00128 . 00028 [100] - free
        00faeeb8: 00058 . 00028 [100] - free
        00faf0c8: 00060 . 00028 [100] - free
        00fad980: 00050 . 00028 [100] - free
        00fb83f0: 00050 . 00040 [100] - free
        00faed78: 00030 . 00080 [100] - free
        00feebd8: 000e8 . 00080 [100] - free
        00faeb80: 00050 . 000d0 [100] - free
        00ff0398: 00148 . 000d8 [100] - free
        00fafed0: 000b0 . 000f0 [100] - free
        00fb8130: 00210 . 00270 [100] - free
        00fef460: 00808 . 003c8 [100] - free
        00ffcf38: 003c8 . 2c0a8 [100] - free

    Segment00 at 00fa0000:
        Flags:           00000000
        Base:            00fa0000
        First Entry:     00fa0498
        Last Entry:      0109f000
        Total Pages:     000000ff
        Total UnCommit:  00000076
        Largest UnCommit:00000000
        UnCommitted Ranges: (1)

    Heap entries for Segment00 in Heap 00fa0000
         address: psize . size  flags   state (requested size)
        00fa0000: 00000 . 00498 [101] - busy (497)
        00fa0498: 00498 . 00108 [101] - busy (100)
        00fa05a0: 00108 . 000d8 [101] - busy (d0)

        ......
        01029000:      00076000      - uncommitted bytes.
View Segment
Generally speaking, we can basically view the information of Segment in a heap through the above commands. If you want to view a Segment, you can use the following methods:
0:006> dt _HEAP_SEGMENT 00fa0000
ntdll!_HEAP_SEGMENT
   +0x000 Entry            : _HEAP_ENTRY
   +0x008 SegmentSignature : 0xffeeffee
   +0x00c SegmentFlags     : 2
   +0x010 SegmentListEntry : _LIST_ENTRY [ 0xfa00a4 - 0xfa00a4 ]
   +0x018 Heap             : 0x00fa0000 _HEAP
   +0x01c BaseAddress      : 0x00fa0000 Void
   +0x020 NumberOfPages    : 0xff
   +0x024 FirstEntry       : 0x00fa0498 _HEAP_ENTRY
   +0x028 LastValidEntry   : 0x0109f000 _HEAP_ENTRY
   +0x02c NumberOfUnCommittedPages : 0x76
   +0x030 NumberOfUnCommittedRanges : 1
   +0x034 SegmentAllocatorBackTraceIndex : 0
   +0x036 Reserved         : 0
   +0x038 UCRSegmentList   : _LIST_ENTRY [ 0x1028ff0 - 0x1028ff0 ]
View the requested memory address
In fact, in the debugging process, the most important thing is the content information associated with the address of the variable. For example, I wrote a program whose requested memory variable address is 0x00fb5440 and the requested size is 5 bytes.
First, you can find that the location of the address is the heap through the following command:
0:000> !address 0x00fb5440

Building memory map: 00000000
Mapping file section regions...
Mapping module regions...
Mapping PEB regions...
Mapping TEB and stack regions...
Mapping heap regions...
Mapping page heap regions...
Mapping other regions...
Mapping stack trace database regions...
Mapping activation context regions...

Usage:                  Heap
Base Address:           00fa0000
End Address:            01029000
Region Size:            00089000 ( 548.000 kB)
State:                  00001000          MEM_COMMIT
Protect:                00000004          PAGE_READWRITE
Type:                   00020000          MEM_PRIVATE
Allocation Base:        00fa0000
Allocation Protect:     00000004          PAGE_READWRITE
More info:              heap owning the address: !heap 0xfa0000
More info:              heap segment
More info:              heap entry containing the address: !heap -x 0xfb5440
Then, you can view the detailed heap block information of the currently applied memory through the following command, which is in the busy state. You can see that the size of the heap block is 0x10, and the memory we actually applied for is 5 bytes. Then 0x10(Size) - 0xb (Unused) = 5, you can see that unused contains_ HEAP_ The size of the entry block metadata. The memory available to our actual users is 8 bytes (minimum allocation granularity), which is three bytes more than the 5 bytes we applied for. This is why the program sometimes overflows a few characters and does not cause the program to crash or exception.
0:000> !heap -x 0xfb5440
Entry     User      Heap      Segment       Size  PrevSize  Unused    Flags
-----------------------------------------------------------------------------
00fb5438  00fb5440  00fa0000  00fad348        10      -            b  LFH;busy
You can also directly view the Entry structure:
0:000> dt _HEAP_ENTRY 00fb5438
ntdll!_HEAP_ENTRY
   +0x000 UnpackedEntry    : _HEAP_UNPACKED_ENTRY
   +0x000 Size             : 0xa026
   +0x002 Flags            : 0xdc ''
   +0x003 SmallTagIndex    : 0x83 ''
   +0x000 SubSegmentCode   : 0x83dca026
   +0x004 PreviousSize     : 0x1b00
   +0x006 SegmentOffset    : 0 ''
   +0x006 LFHFlags         : 0 ''
   +0x007 UnusedBytes      : 0x8b ''
   +0x000 ExtendedEntry    : _HEAP_EXTENDED_ENTRY
   +0x000 FunctionIndex    : 0xa026
   +0x002 ContextValue     : 0x83dc
   +0x000 InterceptorValue : 0x83dca026
   +0x004 UnusedBytesLength : 0x1b00
   +0x006 EntryOffset      : 0 ''
   +0x007 ExtendedBlockSignature : 0x8b ''
   +0x000 Code1            : 0x83dca026
   +0x004 Code2            : 0x1b00
   +0x006 Code3            : 0 ''
   +0x007 Code4            : 0x8b ''
   +0x004 Code234          : 0x8b001b00
   +0x000 AgregateCode     : 0x8b001b00`83dca026
If you are careful, you will find the following two problems:
- The value of Size in the structure is 0xa026, which is different from the Size of 0x10 seen in the previous command. This is because Windows encodes these metadata and needs an XOR operation with an encoded data in the heap to get the real value. The author has tried the specific method, which is not repeated here. You can obtain the method in the reference article.
- Size is a 2-byte description, so the maximum descriptive size should be 0xffff, but it was not said that the maximum block can be 0x7FFF0 (524272 bytes), which should not be enough storage? This is also related to the first problem. After the size calculated by the above method, it needs to be multiplied by 8 to be the real data size.
Suggestions for using Windows self built heap
In < < Windows core programming > >, I suggested some scenarios using self built heap, which I interpreted with my own ideas.
Protection components
First read the Central Plains Dialect:
If your application needs to protect two components, one is the link table of node structure, and the other is the binary tree of B R A N C H structure. You have two source code files, one is l N K L s t C P P, which contains the functions responsible for processing the N O D E link table, and the other file is b i n tr E C P, which contains the functions of the binary tree responsible for processing branches.
Now suppose there is an error in the linked table code that makes the 8 bytes after node 1 incorrect
It was rewritten carefully, resulting in the destruction of the data in branch 3. When b i n tr E When the code in the C P file later attempts to traverse the binary tree, it will not be able to do so because its memory has been destroyed. Of course, this makes you think there is an error in the binary tree code, but in fact, the error is in the link table code. Since different types of objects are mixed in a single stack, tracking and identifying errors becomes very difficult.
I personally think that in an application project, it may not be necessary to do the above fine division. But if you think about it, in A large project, multiple modules will be mixed. For example, if you are A product manufacturer, the product will integrate other departments or even external third-party components. When these components are in the same process and use the same heap at the same time, it is inevitable that the memory overflow problem of module A leads to the data processing exception of module B, which makes your tracking problem extremely complex. What's more, It is likely that the team of module B will carry the pot. And these are real. The suggestions here are more suitable for some key modules to use their own heap, so as to reduce their improper memory use and cover the memory used by other components, resulting in exceptions, so that the problem tracking can be concentrated in the wrong module. Of course, this is not absolute, because the components of the process are all in the same address space, and there is also A kind of jumping memory access damage. However, most of the time, the memory overflow is continuous and there are many overflow. This can really improve the tracking efficiency of this problem.
More efficient memory management
This mainly emphasizes that objects of the same type and size are placed in one heap to avoid the memory fragmentation caused by the mixing of memory objects of different sizes, resulting in the decline of heap management efficiency. For the same object, the memory fragmentation problem can be avoided. Of course, these only provide an idea. It is up to the engineer to decide whether it is necessary to adopt such an approach in your project.
Local access
Let's take a look at the original description:
Whenever the system must exchange r am pages between R am and system page files, the operation performance of the system will be greatly affected. If you often access memory limited to a small range of addresses, it is unlikely that the system needs to exchange pages between ram and disk.
Therefore, when designing applications, if some data will be accessed at the same time, it is best to allocate them close to each other. Let's go back to the example of link table and binary tree. There is no relationship between traversing link table and traversing binary tree. If you put all the nodes together (in a stack), you can make them on adjacent pages. In fact, several nodes are likely to fit exactly on a single physical memory page. Traversing the linked table will not require C P U to reference several different memory pages in order to access each node.
This idea is actually a Cache idea, ram and page on disk Page swapping with sys storage (virtual memory on disk) brings some time costs. For example, your RAM has only one page. You have two objects a and B. A is stored on Page1 and B is stored on Page2. When you access object a, you must load the contents of Page1 into RAM. At this time, Page2 where object B is located must be on page In sys, when you access the B object again, you have to remove Page2 from page Sys is loaded into RAM to replace Page1
After understanding the performance overhead caused by page switching, in fact, the idea of this paragraph is to put the objects most likely to be accessed continuously in a heap, so they are more likely to be on a page and improve efficiency.
Reduce the overhead of thread synchronization
This is well understood. In general, the self built heap created supports multithreading, so multithreaded memory allocation will inevitably lead to synchronization time consumption. However, for some projects, there is only one thread, so for the program of this thread, set heap when calling HeapCreate_ NO_ Serialize, the heap only supports single threads, thus improving the efficiency of memory requests.
Quickly release stack
This idea first improves the efficiency of memory release, and the second is to reduce memory leakage as much as possible. I remember reading an article about Arena before. It feels similar. The memory in a life cycle is applied from Arena. After the declaration cycle ends, instead of directly releasing each object, the Arena is directly destroyed, which improves the release efficiency and reduces the possibility of memory leakage. The principle of using self built heap is similar to that of Arena. For example, a heap is created before a task is processed. The memory requested during task processing is applied on this heap, and then when it is released, the heap can be destroyed directly.
For the application of objects, C + + can overload operators such as new and delete to realize custom memory allocation, and this can be encapsulated into a base class. In this process, the objects to be created inherit from this base class and reuse new and delete.
Summary and reference
I thought these were the knowledge I had mastered, but I spent more time writing the article than I expected, and I also found some misunderstandings in practice. If there are still improper places in the article, I also hope the readers can correct it. Anyway, I hope it can help readers.
reference resources
- Windows core programming
- Windows advanced debugging
- Windows Heap Chunk Header Parsing and Size Calculation
- Understanding the Low Fragmentation Heap
- WINDOWS 10SEGMENT HEAP INTERNALS