Task 1 & Task 2 data reading and data analysis
The game data is text data, and each news is of variable length, which is stored in csv format. Therefore, you can directly use Pandas to complete the data reading operation.
import pandas as pd
train_df = pd.read_csv(r'train_set.csv', sep='\t')
pd.read_csv common parameters:
- The read file path needs to be changed to your local path according to your needs. You can use relative path or absolute path;
- Separator sep, which is the character divided for each column, can be set to \ t;
- The number of rows to read nrows is a function of reading the file this time. It is a numeric type (because the data set is relatively large, it can be set to 100 first);
train_df.head(5)
| label | text | |
|---|---|---|
| 0 | 2 | 2967 6758 339 2021 1854 3731 4109 3792 4149 15... |
| 1 | 11 | 4464 486 6352 5619 2465 4802 1452 3137 5778 54... |
| 2 | 3 | 7346 4068 5074 3747 5681 6093 1777 2226 7354 6... |
| 3 | 2 | 7159 948 4866 2109 5520 2490 211 3956 5520 549... |
| 4 | 3 | 3646 3055 3055 2490 4659 6065 3370 5814 2465 5... |
Load the test set data in the same way.
test_df = pd.read_csv(r'test_a.csv', sep='\t')
test_df.head(5)
| text | |
|---|---|
| 0 | 5399 3117 1070 4321 4568 2621 5466 3772 4516 2... |
| 1 | 2491 4109 1757 7539 648 3695 3038 4490 23 7019... |
| 2 | 2673 5076 6835 2835 5948 5677 3247 4124 2465 5... |
| 3 | 4562 4893 2210 4761 3659 1324 2595 5949 4583 2... |
| 4 | 4269 7134 2614 1724 4464 1324 3370 3370 2106 2... |
Data analysis
After reading the training set and preliminarily viewing the data format, you can analyze the data set.
Read all the training set data and analyze the data set from the following perspectives:
- What is the length of the news text in the competition data?
- What is the character distribution in the competition data?
- What is the category distribution of competition data? Which categories are more?
- What is the length distribution of different categories of text in the competition data?
- What is the character distribution of different categories in the competition data?
The average number of characters in all sentences in the statistics set
As can be seen from the above table, the characters of each line of sentences in the training set are separated by spaces, so they can be segmented, and then count the number of words to get the length of each sentence.
%pylab inline
train_df['text_len'] = train_df['text'].apply(lambda x: len(x.split(' ')))
print(train_df['text_len'].describe())
Populating the interactive namespace from numpy and matplotlib
count    200000.000000
mean        907.207110
std         996.029036
min           2.000000
25%         374.000000
50%         676.000000
75%        1131.000000
max       57921.000000
Name: text_len, dtype: float64
According to the statistics of news sentences, there are 20w training data in total. The given text is relatively long. Each sentence is composed of 907 characters on average. The shortest sentence length is 2 and the longest sentence length is 57921. Less than 75% of the data length is less than 1131.
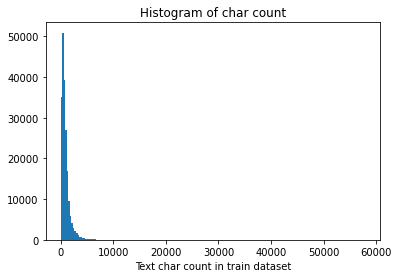
The following figure draws a histogram of sentence length. It can be seen that the length of sentences in most training sets is less than 2000.
_ = plt.hist(train_df['text_len'], bins=200)
plt.xlabel('Text char count in train dataset')
plt.title("Histogram of char count")
Text(0.5, 1.0, 'Histogram of char count')
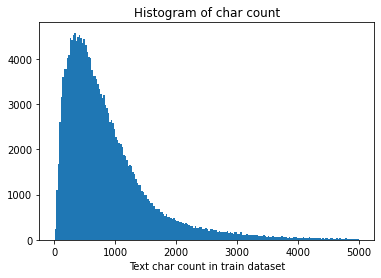
_ = plt.hist(train_df[train_df['text_len']<5000]['text_len'], bins=200)plt.xlabel('Text char count in train dataset')plt.title("Histogram of char count")
Text(0.5, 1.0, 'Histogram of char count')
Similarly, count the text length of the test set:
%pylab inlinetest_df['text_len'] = test_df['text'].apply(lambda x: len(x.split(' ')))print(test_df['text_len'].describe())
Populating the interactive namespace from numpy and matplotlibcount 50000.000000mean 909.844960std 1032.313375min 14.00000025% 370.00000050% 676.00000075% 1133.000000max 41861.000000Name: text_len, dtype: float64
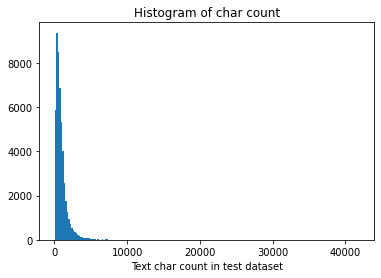
It can be seen that there are 50000 news in the test set, each news has an average of 909 characters, the shortest sentence length is 14, the longest sentence is 41861, and the data length of less than 75% is less than 1133.
The test set sentence length is plotted as a histogram:
_ = plt.hist(test_df['text_len'], bins=200)plt.xlabel('Text char count in test dataset')plt.title("Histogram of char count")
Text(0.5, 1.0, 'Histogram of char count')
_ = plt.hist(test_df[test_df['text_len']<5000]['text_len'], bins=200)plt.xlabel('Text char count in test dataset')plt.title("Histogram of char count")
Text(0.5, 1.0, 'Histogram of char count')
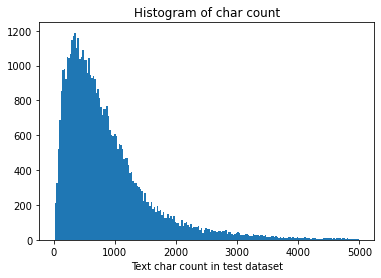
It can be seen that the text length distribution of training set and test set is close.
Character distribution statistics
Next, the number of occurrences of each character can be counted. First, all sentences in the training set can be spliced, then divided into characters, and the number of each character can be counted.
It can be seen from the statistical results that the training set includes a total of 6869 words, of which the word no. 3750 appears the most and the word no. 3133 appears the least.
from collections import Counterall_lines = ' '.join(list(train_df['text']))word_count = Counter(all_lines.split(" "))word_count = sorted(word_count.items(), key=lambda d:d[1], reverse = True)print(len(word_count))print(word_count[0])print(word_count[-1])
6869('3750', 7482224)('3133', 1)
Punctuation can also be deduced according to the occurrence of words in the corpus. The following code counts the occurrence times of different characters in sentences. The coverage of characters 3750, 900 and 648 in 20w news is close to 99%, which is likely to be punctuation.
from collections import Countertrain_df['text_unique'] = train_df['text'].apply(lambda x: ' '.join(list(set(x.split(' ')))))all_lines = ' '.join(list(train_df['text_unique']))word_count = Counter(all_lines.split(" "))word_count = sorted(word_count.items(), key=lambda d:int(d[1]), reverse = True)print(word_count[0])print(word_count[1])print(word_count[2])
('3750', 197997)('900', 197653)('648', 191975)
Similarly, count the character distribution of the test set:
from collections import Counterall_lines = ' '.join(list(test_df['text']))word_count = Counter(all_lines.split(" "))word_count = sorted(word_count.items(), key=lambda d:d[1], reverse = True)print(len(word_count))print(word_count[0])print(word_count[-1])
6203('3750', 1879488)('1224', 1)
from collections import Countertest_df['text_unique'] = test_df['text'].apply(lambda x: ' '.join(list(set(x.split(' ')))))all_lines = ' '.join(list(test_df['text_unique']))word_count = Counter(all_lines.split(" "))word_count = sorted(word_count.items(), key=lambda d:int(d[1]), reverse = True)print(word_count[0])print(word_count[1])print(word_count[2])
('3750', 49455)('900', 49366)('648', 47966)
Rules of category distribution in statistical data sets
Next, make distribution statistics on the categories of the data set, and specifically count the number of samples of each type of news.
Labels and corresponding categories are:
{'technology': 0, 'stock': 1, 'Sports': 2,' entertainment ': 3,' current politics': 4, 'society': 5, 'education': 6, 'Finance': 7, 'home': 8, 'Games': 9,' real estate ': 10,' fashion ': 11,' lottery ': 12,' constellation ': 13}
label2id={'science and technology': 0, 'shares': 1, 'Sports': 2, 'entertainment': 3, 'Current politics': 4, 'Sociology': 5, 'education': 6, 'Finance and Economics': 7, 'Home Furnishing': 8, 'game': 9, 'house property': 10, 'fashion': 11, 'lottery': 12, 'constellation': 13}id2label={}for label,labelid in label2id.items(): id2label[labelid]=labeltrain_df['type']=''for labelid in np.unique(train_df['label'].values): train_df.loc[train_df['label']==labelid,'type']=id2label[labelid]train_df['type'].value_counts().plot(kind='bar')#Note that these two lines are to correctly display the Chinese settings plt.rcParams['font.sans-serif']=["SimHei"] #Used to display Chinese labels normally plt.rcParams['axes.unicode_minus']=False #It is used to display the negative sign plt.title('News class count')plt.xlabel("category") normally
Text(0.5, 0, 'category')
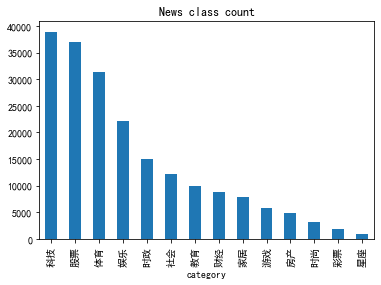
It can be seen from the statistical results that the category distribution of the data set of the competition questions is relatively uneven. In the training concentration, science and technology news is the most, followed by stock news, and constellation news is the least.
The average number of characters in sentences under different categories in the statistical data set
Then count the average length of sentences under different categories in the training set.
from collections import Countertext_len_each_label=train_df.groupby('type').agg('mean','text_len')['text_len']text_len_each_label.plot(kind='bar')plt.title('Text char count in each label')plt.xlabel("category")
Text(0.5, 0, 'category')
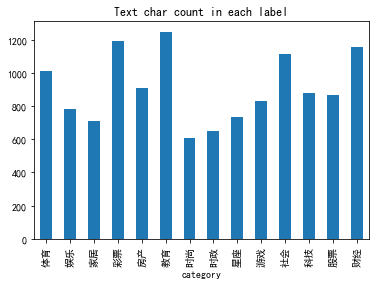
You can see the average sentence length of each category. The sentence length of education and caipiao is the longest, and that of fashion is relatively short.
The five most common characters in sentences under different categories in the statistical data set
from collections import Counterlabel_groups=train_df.groupby('type')word_count_each_label={}for groupid in label_groups.groups.keys(): group=label_groups.get_group(groupid) lines = ' '.join(list(group['text'])) word_count = Counter(lines.split(" ")) word_count = sorted(word_count.items(), key=lambda d:d[1], reverse = True) word_count_each_label[groupid]=word_count
word_count_df_each_label=pd.DataFrame.from_dict(word_count_each_label,orient='index').Tword_count_df_each_label.head(5)
| Sports | entertainment | Home Furnishing | lottery | house property | education | fashion | Current politics | constellation | game | Sociology | science and technology | shares | Finance and Economics | |
|---|---|---|---|---|---|---|---|---|---|---|---|---|---|---|
| 0 | (3750, 1458331) | (3750, 774668) | (3750, 242367) | (3750, 87412) | (3750, 180259) | (3750, 469540) | (3750, 83834) | (3750, 360839) | (3750, 33796) | (3750, 178783) | (3750, 715740) | (3750, 1267331) | (3750, 1200686) | (3750, 428638) |
| 1 | (648, 974639) | (648, 494477) | (648, 202399) | (4464, 51426) | (648, 114512) | (648, 345372) | (648, 67353) | (648, 231863) | (648, 26867) | (648, 157291) | (648, 329051) | (648, 967653) | (648, 714152) | (648, 262220) |
| 2 | (900, 618294) | (900, 298663) | (900, 92207) | (3370, 45815) | (900, 75185) | (900, 222488) | (900, 37240) | (900, 190842) | (900, 11263) | (900, 70680) | (900, 305241) | (900, 577742) | (3370, 626708) | (900, 184131) |
| 3 | (7399, 351894) | (6122, 187933) | (6122, 57345) | (648, 37041) | (3370, 67780) | (6248, 193757) | (4939, 18591) | (4411, 120442) | (4939, 9651) | (7328, 46477) | (6122, 159125) | (3370, 503768) | (900, 542884) | (3370, 159156) |
| 4 | (6122, 343850) | (4939, 173606) | (4939, 56147) | (2465, 36610) | (2465, 45163) | (2555, 175234) | (6122, 18438) | (7399, 86190) | (669, 8925) | (6122, 43411) | (5598, 136713) | (4464, 307431) | (4464, 445525) | (5296, 132136) |
Assuming that characters 3750, 900 and 648 are punctuation marks of sentences, please analyze the average number of sentences in each news story?
re regular expression is used to segment a string with multiple characters.
import retrain_df['sentence_count']=train_df['text'].apply(lambda x: re.split('3750|900|648',x)).str.len()train_df['sentence_count'].describe()
count 200000.000000mean 80.802370std 86.955448min 1.00000025% 29.00000050% 57.00000075% 103.000000max 3460.000000Name: sentence_count, dtype: float64
You can see that on average, each text consists of 80 sentences.
Conclusion of data analysis
Through the above analysis, we can know the general situation of the data set:
- The average number of characters contained in each news in the competition is 1000, and some news characters are longer;
- The distribution of news categories in the competition is uneven, the sample size of science and technology news is close to 4w, and the sample size of constellation news is less than 1k;
- The competition questions include 7000-8000 characters in total;
The following valuable conclusions for training can also be drawn:
- The average number of characters in each news is large and may need to be truncated;
- Due to the imbalance of categories, it will seriously affect the accuracy of the model.