T-test is a statistical technique that can tell people how significant the difference between two groups of data is. It is achieved by comparing the semaphore (measured by the difference between samples or population averages) with the amount of noise (or change) in these samples. There are many useful articles that will tell you what t-tests are and how they work, but there is not much material to discuss different variants of t-tests and when to use them. This article will introduce three variants of t-test, when to use them and how to run them in Python.
Single sample t-test
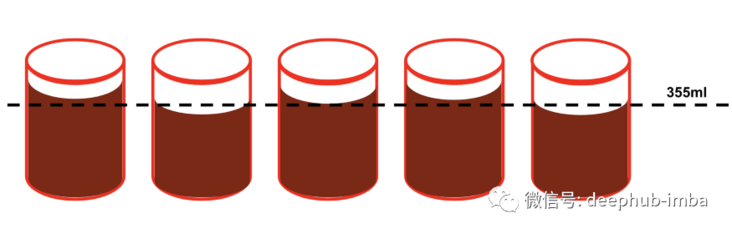
The single sample t-test compares the average of data samples with a specific value. The most common example is that Coca Cola wants to ensure that bottling plants pour an appropriate amount of soda into each can: they want 355ml of each can, so they can take canned samples and measure the exact number of ML poured into each can. Due to the imprecise mechanical process, the capacity of some cans may exceed 355ml, while the capacity of some cans may become less. By performing a single sample t-test on jar samples, it is possible to test whether the machine pours into each jar a statistically significant amount different from 355 ml of liquid.
How does it work?
1. State the original hypothesis and alternative hypothesis. The original hypothesis (H0) will be that there is no difference between the sample mean and the specific value (overall mean), while the alternative hypothesis (H1) indicates that there is a difference. Using the above examples, they will be similar to:
- H0: an average of 355ml per can of coke.
- H1: the average can of coke is more than 355ml.
Note: since I chose one direction (i.e. "more than 355 ml in each jar"), this became a unilateral t-test instead of a bilateral t-test with a quantity other than 355 ml.
2. Determine the significance level: the significance level is usually called alpha( α), Is the probability of rejecting the original hypothesis when it is actually true. An alpha value of 0.05 is usually used, which means that there is a 5% risk to conclude that there is a statistically significant difference between samples, which is actually only caused by noise.
3. Collect data: values to test( μ), Sample mean (x) ̄), Sample standard deviation (S) and sample observation times (n), and substitute them into the following formula to calculate t statistics:

4. The corresponding p value is obtained by substituting t statistics and degrees of freedom into the t table. Compare this p value with the alpha level you choose. If it is smaller, you can reject the original hypothesis.
However, the effectiveness of such tests requires three assumptions:
- The samples are independent
- Data approximate normal distribution
- Random sampling
Code example
Scipy's stats library has a convenient ttest_ 1 samp method, when the data sample is given and the population mean to be compared, this method will calculate t-stat and p-value. The following code demonstrates using this function to run a sample t-test for the above example.
# Import numpy and scipy
import numpy as np
from scipy import stats

# Create fake data sample of 30 cans from 2 factories
factory_a = np.full(30, 355) + np.random.normal(0, 3, 30)
factory_b = np.full(30, 353) + np.random.normal(0, 3, 30)

# Run a 1 sample t-test for each one
a_stat, a_pval = stats.ttest_1samp(a=factory_a, popmean=355, alternative='two-sided')
b_stat, b_pval = stats.ttest_1samp(a=factory_b, popmean=355, alternative='two-sided')

# Display results
print("Factory A-  t-stat: {:.2f}   pval: {:.4f}".format(a_stat, a_pval))
print("Factory B-  t-stat: {:.2f}   pval: {:.4f}".format(b_stat, b_pval))

## Output
# Factory A-  t-stat: 0.37   pval: 0.7140
# Factory B-  t-stat: -3.96   pval: 0.000
Here, I created two data samples of 30 cans from factory A and factory B. For plant A, the average value of the data is 355 and noise is added, but for plant B, the average value of the data is 353 and noise is added. Running the single sample t-test for both, we can see that the p value of factory A is 0.71 and that of factory B is 0.0004. The p value of plant A is much higher than the standard alpha level of 0.05, but the threshold of plant B below this level allows us to reject the original hypothesis.
Two sample t-test
The two sample t-test does not compare the average of data samples with A single value (overall average), but compares the average of two independent data samples. As in the above example, if you want to compare the average amount of canned liquid in plant A and plant B, you can use this method.

How does it work?
1. Similar to the single sample t-test, we state the original hypothesis and alternative hypothesis. Take two factories as an example, they will be:
H0: there is no significant difference in the average filling volume between the two plants
H1: there is a significant difference in the average filling volume between the two plants
Note: it is important to remember that the original hypothesis and alternative hypothesis are always about the general population, not the sample taken from it
2. Select a significance level (we will select 0.05 again)
3. Calculate the mean (x) of the two samples ̄), The standard deviation (S) and sample size (N) are substituted into the following formula to obtain a t statistic

4. The corresponding p value is obtained by substituting t statistics and degrees of freedom into the t table. Compare this p value with the selected alpha level, and if it is smaller, the original hypothesis can be rejected.
Like the single sample t-test, this test must meet some assumptions:
- The two samples are independent
- Two samples are approximately normal distribution
- The variance of the two samples is roughly the same
Code example
Scipy's ttest_ The ind method receives two data samples and communicates with ttest_ Similar to 1 samp, a t statistic and the corresponding p value are returned from the test. The following code demonstrates using this function to run the above example use case.
# Import numpy and scipy
import numpy as np
from scipy import stats

# Create fake data sample of 30 cans from 2 factories
factory_a = np.full(30, 355) + np.random.normal(0, 3, 30)
factory_b = np.full(30, 353) + np.random.normal(0, 3, 30)

# Run a two sample t-test to compare the two samples
tstat, pval = stats.ttest_ind(a=factory_a, b=factory_b, alternative="two-sided")

# Display results
print("t-stat: {:.2f}   pval: {:.4f}".format(tstat, pval))

## Output
# t-stat: 3.15   pval: 0.0026
Since the p value of this 0.0026 test is lower than the standard alpha of 0.05, the original hypothesis is rejected.
Paired t-test
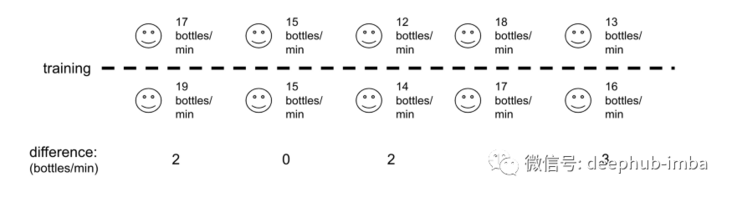
Paired t-tests usually compare two measurements of the same entity over time. For example, if they want to test the effectiveness of the bottling training program, they can compare the average bottling rate of each employee before and after training.
How does it work?
Similar to the one sample and two sample t-tests, it is necessary to explain the original hypothesis and alternative hypothesis, select the significance level, calculate the t-statistic, and use it together with the degrees of freedom in the t-table to obtain the p value Similarly, the formulas of T statistics are different, as shown below, where d is the difference of each paired value and n is the number of samples.

Another way to describe this test is: paired t-test is essentially a single sample t-test for the difference of each paired sample! In this case, the original assumption is that the difference between paired samples is zero.
Code example
scipy's ttest_ The rel method receives two paired data arrays and is similar to ttest_1samp and ttest_ind function, which returns a t statistic and the corresponding p value. In the following code, I first define a group of employees' bottling rate, and the random number of bottles per minute is between 10 and 20. Then I use the "apply_training" function to simulate the training, which can reduce the productivity by 1 bottle / min or increase the productivity by up to 4 bottles / min. Similar to the previous two examples, I input the productivity array before and after training into the ttest of scipy_ Rel function and print out.
# Import numpy and scipy
import numpy as np
from scipy import stats

# Create array of worker bottling rates between 10 and 20 bottles/min
pre_training = np.random.randint(low=10, high=20, size=30)

# Define "training" function and apply
def apply_training(worker):
    return worker + np.random.randint(-1, 4)

post_training = list(map(apply_training, pre_training))

# Run a paired t-test to compare worker productivity before & after the training
tstat, pval = stats.ttest_rel(post_training, pre_training)

# Display results
print("t-stat: {:.2f}   pval: {:.4f}".format(tstat, pval))

## Output
# t-stat: 2.80   pval: 0.0091
Finally, as a summary of the above description, it is demonstrated here how the paired t-test is the same as the single sample t-test for paired differences. In the following code snippet, the post is obtained_ Training and pre_ The difference between training arrays, and a single sample t-test is conducted for the difference of the overall average value of 0 (because the null hypothesis is that there is no difference between samples). As expected, the t-statistics and p-values are exactly the same as the paired t-test!
# Take differences in productivity, pre vs. post
differences = [x-y for x,y in zip(post_training, pre_training)]

# Run a 1-sample t-test on the differences with a popmean of 0
tstat, pval = stats.ttest_1samp(differences, 0)

# Display results
print("t-stat: {:.2f}   pval: {:.4f}".format(tstat, pval))

## Output
# t-stat: 2.80   pval: 0.0091
Finally, thanks for reading
https://www.overfit.cn/post/4d281f529e5c433490381d1e0c73007c
Author: Eric Onofrey