
Three level practical subject report
Project Name: website log analysis system of canva paintable online graphic design software
Major name: Data Science and big data technology
Class: = = 201
Student No.:============
Student Name: CS daydream
Instructor:===
– -- December 2021 –
Abstract
With the development of the Internet, network data is growing exponentially. IDC data shows that global enterprise data is growing at a rate of 55% year by year. Big data contains huge commercial value and has attracted extensive attention of enterprises. However, big data has brought some problems and difficulties to data synchronization, storage and data statistical analysis, The current tools are gradually unable to effectively deal with these problems. Google first launched MapReduce to meet its demand for big data processing. Hadoop is an open source version of MapReduce and has gradually become a core part of the basic computing platform of many Internet companies.
Based on the demand analysis of this system, this group designs an architecture based on Hadoop and Hive clusters, which integrates the data source layer, storage layer and computing layer, and designs and implements the functions of offline log statistical analysis, task scheduling, visual operation and so on.
This paper comprehensively uses a variety of open source technologies of Hadoop ecosystem, including Flume NG, Sqoop, HDFS, MapReduce and Hive. From the collection of log analysis to log storage and calculation analysis, the final visual interface is obtained, covering the typical processes and technologies of Hadoop log statistical analysis.
This paper uses the development language Java and shell, and the development tools are IDEA, Xshell and so on. Hadoop clusters are built on three CentOS machines for distributed storage and computing.
Keywords: big data; Hadoop; MapReduce; Log statistical analysis
Chapter I Introduction
1.1 topic introduction
In Internet applications, logs are very important data, because Internet projects often require 7 * 24 uninterrupted operation, so it is very important to obtain and analyze the log data related to the operation of the monitoring system. Website traffic statistics is one of the important means to improve website services. By obtaining and analyzing the behavior data of users on the website, we can get valuable information and improve the website based on this information.
1.2 subject source
For the future development of the Internet, big data log analysis has become increasingly important. In order to consolidate their big data knowledge and application ability, team members have completed a massive log analysis system.
1.3 subject requirements
1, Collect and monitor logs with Flume
2, Clean the collected original logs and upload them to hive
3, The following indicators are counted through log analysis:
- PV,UV: day / week / month
- Count the number of login users per day: the ID of the login user is POST /api/login request
- Count the number of student visits in each time period: day, week and month
- Statistics of the most frequently visited pages: Top 10. Day / week / month
- Users with more frequent visits: Top 10. Day / week / month
- System environment for statistical access: day / week / month [operating system version, browser and other information]
- IP source of statistical access: [if the IP location will be queried by calling the interface: prompt: you can directly obtain it by using the request tool in hutool]
- Total IP count: day / week / month
- 4, Upload the statistical data table from sqoop to mysql
5, Finally, the front-end technology shows the results
Chapter II Implementation Technology
2.1 main technologies of data processing
2.1.1 Sqoop
As an open source offline data transmission tool, it is mainly used for data transmission between Hadoop(Hive) and traditional databases (MySql,PostgreSQL). It can import data from a relational database into Hadoop HDFS or HDFS into relational databases.
2.1.2 Flume
An open source framework for real-time data collection. It is a highly available, highly reliable and distributed system for massive log collection, aggregation and transmission provided by Cloudera. It is now a top-level subproject of Apache. Flume can collect data such as logs and time, and store these data centrally for downstream use (especially the data flow framework, such as Storm). Another framework similar to flume is Scribe (FaceBook's open source log collection system, which provides an extensible, high error tolerance and simple scheme for distributed log collection and unified processing)
2.1.3 MapReduce
MapReduce is the core computing model of Google. It highly abstracts the complex parallel computing process running on large-scale clusters into two functions: map and reduce. The greatest thing about MapReduce is that it gives ordinary developers the ability to process big data, so that ordinary developers can run their own programs on distributed systems to process massive data even without any distributed programming knowledge.
2.1.4 Hive
MapReduce gives the ability to process big data to ordinary developers, while Hive further gives the ability to process and analyze big data to actual data users (data development engineers, data analysts, Algorithm Engineers, and business analysts).
Hive is developed by Facebook and contributed to the Hadoop open source community. It is a layer of SQL abstraction based on Hadoop architecture. Hive provides some tools for processing, querying and analyzing data sets in Hadoop files. It supports a query language similar to the SQL language of traditional RDBMS. First, it helps users who are familiar with SQL to process and query data in Hadoop. The query language is called hive SQL. Hive SQL is actually parsed by the SQL parser first, and then parsed into a MapReduce executable plan by the hive framework. The MapReduce tasks are produced according to the plan and handed over to the Hadoop cluster for processing.
2.2 main data storage technology - HDFS
Hadoop Distributed File System (FDFS for short) is a distributed file system. It has a high degree of fault tolerance and high-throughput data access, and is very suitable for applications on large-scale data sets. HDFS provides a massive data storage solution with high fault tolerance and high throughput.
In the whole Hadoop architecture, HDFS provides support for file operation and storage during MapReduce task processing. MapReduce realizes task distribution, tracking and execution based on HDFS, and collects results. The two interact to jointly complete the main tasks of Hadoop distributed cluster.
2.3 main technology of data application - JAVA
Java is the general name of java object-oriented programming language and Java platform launched by Sun Microsystems in May 1995. It was jointly developed by James Gosling and colleagues and officially launched in 1995. Later, Sun company was acquired by Oracle (Oracle), and Java became Oracle's product.
Java is divided into three systems:
·JavaSE (J2SE) (Java2 Platform Standard Edition)
·java EE (J2EE) (java 2 platform, enterprise edition, java Platform Enterprise Edition)
·JavaME(J2ME)(Java 2 Platform Micro Edition).
In June 2005, the JavaOne conference was held, and SUN disclosed Java SE 6. At this time, various versions of java have been renamed to cancel the number "2": J2EE has been renamed Java EE, J2SE has been renamed Java SE, and J2ME has been renamed Java ME.
Chapter III Implementation Process
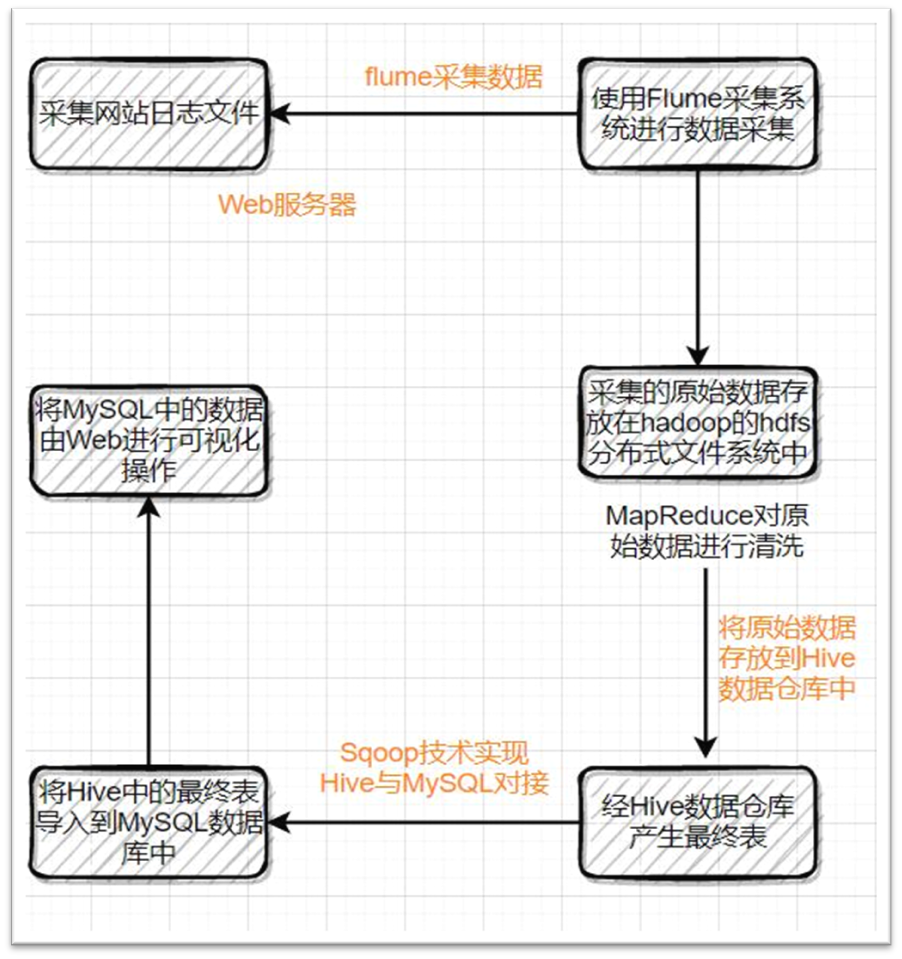
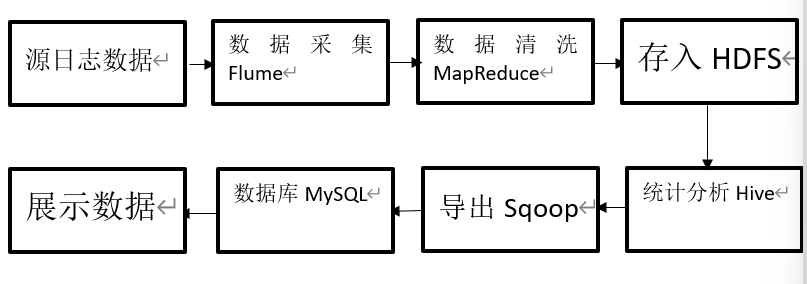
3.1 simple process display
3.2 environment construction
-
Install hadoop on all three virtual machines
-
Install hive on node01 and node02 nodes, and node01 is the server and node02 is the client
-
Take node03 as the storage node, install MySQL on node03, and add MySQL permissions to node01 and node02
-
Flume is installed on node01 to monitor the collected logs
-
Install Sqoop on node02 to export the data tables in hive to MySQL in node03
3.3 acquisition log file
The following are the main classes for generating logs:
import cn.hutool.core.date.DateTime;
import cn.hutool.core.date.DateUtil;
import cn.hutool.core.util.RandomUtil;
import lombok.extern.slf4j.Slf4j;
import java.io.*;
import java.text.SimpleDateFormat;
import java.util.*;
import java.util.regex.Matcher;
import java.util.regex.Pattern;
import java.util.stream.Collectors;
@Slf4j
public class CreateData {
    private static List<String> urls;
    private static List<String> ips;
    public static void create(int days,int maxSize,String dir) throws Exception {
        Date date = DateUtil.date();
        String dateString;
        for (int j = 0; j < days; j++) {//How many days of logs are generated
            DateTime day = DateUtil.offsetDay(date, -j);
            dateString = DateUtil.format(day,"yyyy_MM_dd");
            File file = new File(dir+File.separator + "access_" +dateString + ".log");
            if (!file.exists()) {
                file.createNewFile();
            }
            try {
                FileWriter writer = new FileWriter(file);
                BufferedWriter bw = new BufferedWriter(writer);
                while (file.length() / (1024 * 1024) < 50) {//day
                    //String Time_str = new SimpleDateFormat("dd/MMM/yyyy:HH:mm:ss", Locale.ENGLISH).format(day);
                    //String str = getRandomIp() + " - - [" + Time_str + " +0800] " + urls[rand.nextInt(urls.length)] + " 200 " + (rand.nextInt(1100) + 100);
                    //bw.write(str);
                    bw.newLine();//Line feed
                }

                bw.close();
                writer.close();
            } catch (IOException e) {
                // TODO Auto-generated catch block
                e.printStackTrace();
            }
            //}
        }
    }

    public static void main(String[] args) throws InterruptedException {
        while (true){
            Thread.sleep(RandomUtil.randomLong(100,2*1000));
            log.info("{} - - [{} +0800] {}",getIp(),DateUtil.format(DateUtil.date(),"dd/MM/yyyy:HH:mm:ss"),getUrl());
        }
    }
    private static String getIp(){
        return ips.get(RandomUtil.randomInt(ips.size()));
    }
    private static String getUrl(){
        return urls.get(RandomUtil.randomInt(urls.size()));
    }
    public void createLog(){

    }
    static {
        init();
    }
    public static void init() {
        //Get URL and IP collection
        parseData();
    }
    private static void parseData() {
        try {
            Set<String> url = new HashSet<>();
            Set<String> ip = new HashSet<>();
            InputStream is = CreateData.class.getResourceAsStream("/access.log");
            InputStreamReader reader = new InputStreamReader(is);
            BufferedReader br = new BufferedReader(reader);
            String line;
            String sep = "+0800]";
            int index;
            while ((line = br.readLine()) != null) {
                //Resolve URL
                index = line.indexOf(sep);
                url.add(line.substring(index+sep.length()).trim());
                //Resolve IP
                index = line.indexOf(" ");
                ip.add(line.substring(0,index).trim());
            }
            br.close();
            reader.close();
            is.close();
            urls = new ArrayList<>(url);
            ips = new ArrayList<>(ip);
        } catch (IOException e) {
            e.printStackTrace();
        }
    }
}
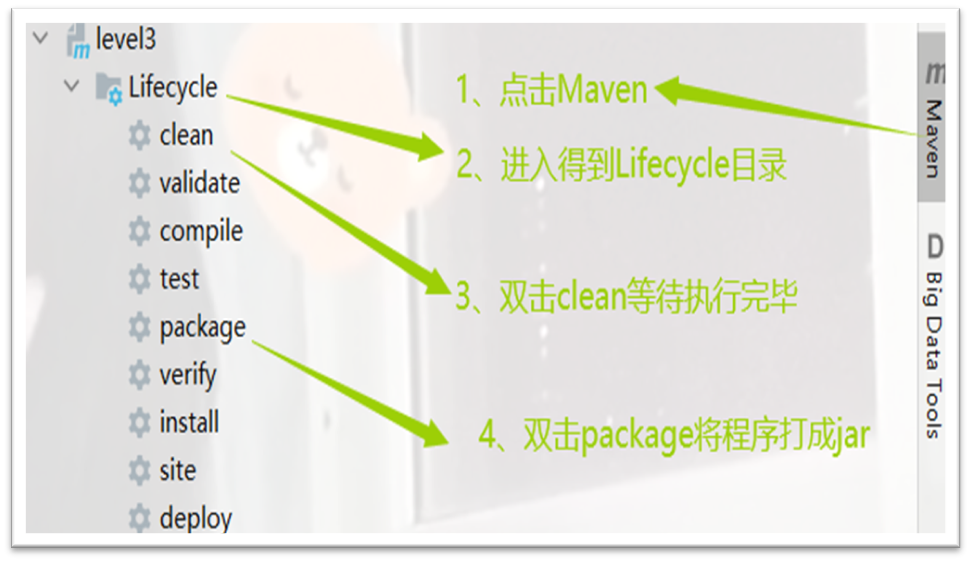
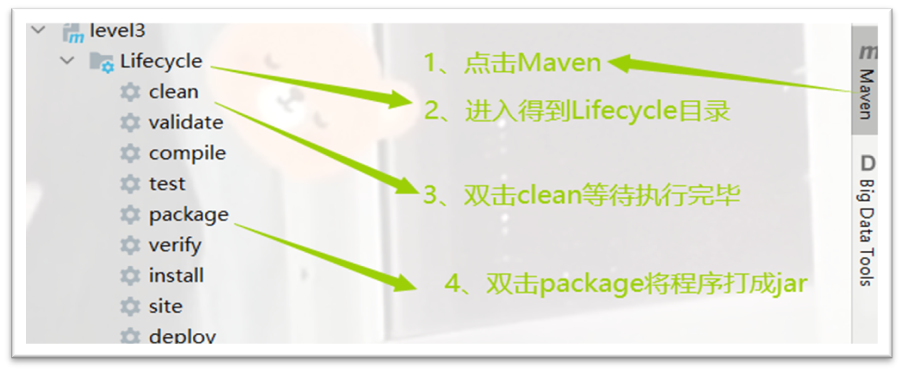
1. Install and configure Maven on idea
2. Print the written log generation class CreateData into a jar package and upload it to node01, as shown in the figure:
3. After uploading to node01, execute the operation as shown in the figure
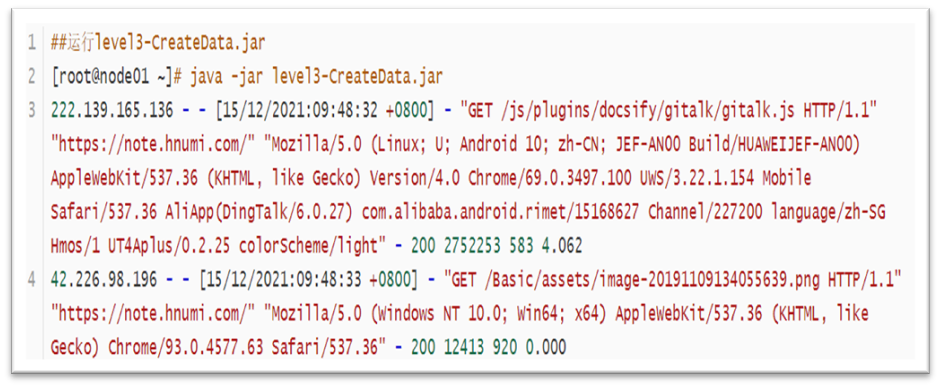
The log data generated under the command is part of the log data
4. Start Flume monitoring system to monitor while generating log data
5. Stop running after generating enough data
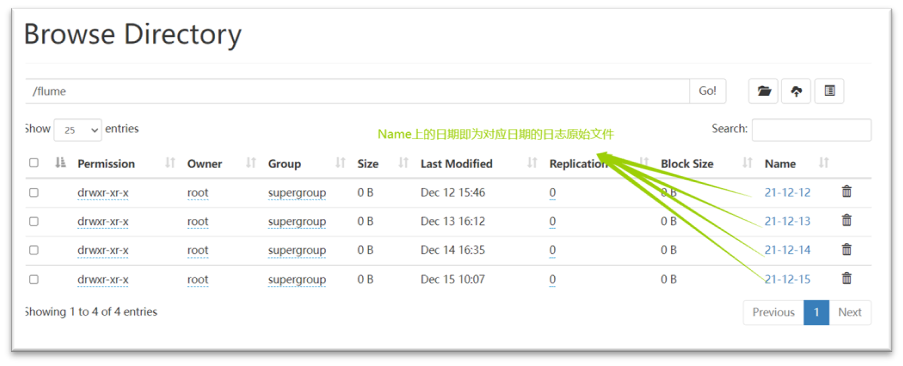
6. Access node01:9870 port in the browser, as shown in the figure:
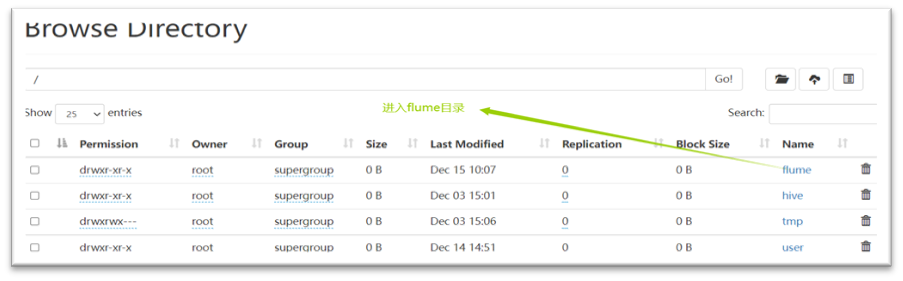
7. Enter the flume directory as shown:
3.4 data cleaning
1. Write MapReduce program with idea to clean the data
import cn.edu.zut.level.util.CollectionUtil;
import cn.edu.zut.level.util.LoggerParse;
import org.apache.hadoop.conf.Configuration;
import org.apache.hadoop.fs.Path;
import org.apache.hadoop.io.IntWritable;
import org.apache.hadoop.io.LongWritable;
import org.apache.hadoop.io.NullWritable;
import org.apache.hadoop.io.Text;
import org.apache.hadoop.mapreduce.Job;
import org.apache.hadoop.mapreduce.Mapper;
import org.apache.hadoop.mapreduce.lib.input.FileInputFormat;
import org.apache.hadoop.mapreduce.lib.output.FileOutputFormat;

import java.io.IOException;

public class LogCleaner {
    public static void main(String[] args) throws Exception {
        run(args[0], args[1]);
    }

    public static void run(String inPath,String outPath) throws Exception {
        Configuration conf = new Configuration();

        Job job = Job.getInstance(conf, "LogCleaner");

        job.setJarByClass(LogCleaner.class);
        job.setMapOutputKeyClass(NullWritable.class);
        job.setMapOutputValueClass(Text.class);

        job.setMapperClass(CleanerMapper.class);
        job.setNumReduceTasks(0);
        FileInputFormat.setInputPaths(job, new Path(inPath));
        FileOutputFormat.setOutputPath(job, new Path(outPath));

        job.waitForCompletion(true);
    }
}

class CleanerMapper extends Mapper<LongWritable, Text,NullWritable, Text>{
    private LoggerParse parse = new LoggerParse();

    @Override
    protected void map(LongWritable key, Text value, Mapper<LongWritable, Text, NullWritable, Text>.Context context) throws IOException, InterruptedException {
        String[] strs = this.parse.parse(value.toString());
        String uri = strs[4];
        if(uri.startsWith("/static") ||
                uri.endsWith("_navbar.md") ||
                uri.endsWith(".jpg") ||
                uri.endsWith(".png") ||
                uri.endsWith(".PNG") ||
                uri.endsWith(".jpeg") ||
                uri.endsWith(".gif") ||
                uri.endsWith(".svg") ||
                uri.endsWith(".js") ||
                uri.endsWith(".css")
        ) return;
        context.write(NullWritable.get(), new Text(CollectionUtil.mkString(strs,"\t")));
    }
}
When writing the log cleaning program, it should be noted that the input and output paths are ready-made, and the input style can be selected by the console, so that when running on node01, the log files of different days can be selected for cleaning, and then output to the location you want to save
2. Print the written log cleaning class LogCleaner into a jar package and upload it to node01, as shown in the figure:
3. Run the jar package after uploading, as shown in the figure below:
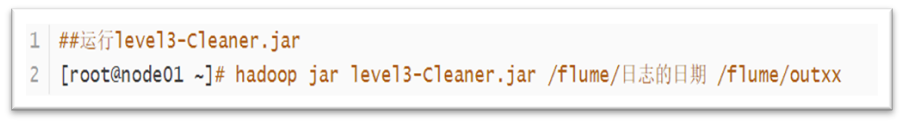
4. After running the jar package of data cleaning, a file named out will be generated, in which the data after cleaning is stored.
3.5 importing data into Hive
1. After cleaning the original log data, upload it to the hive table
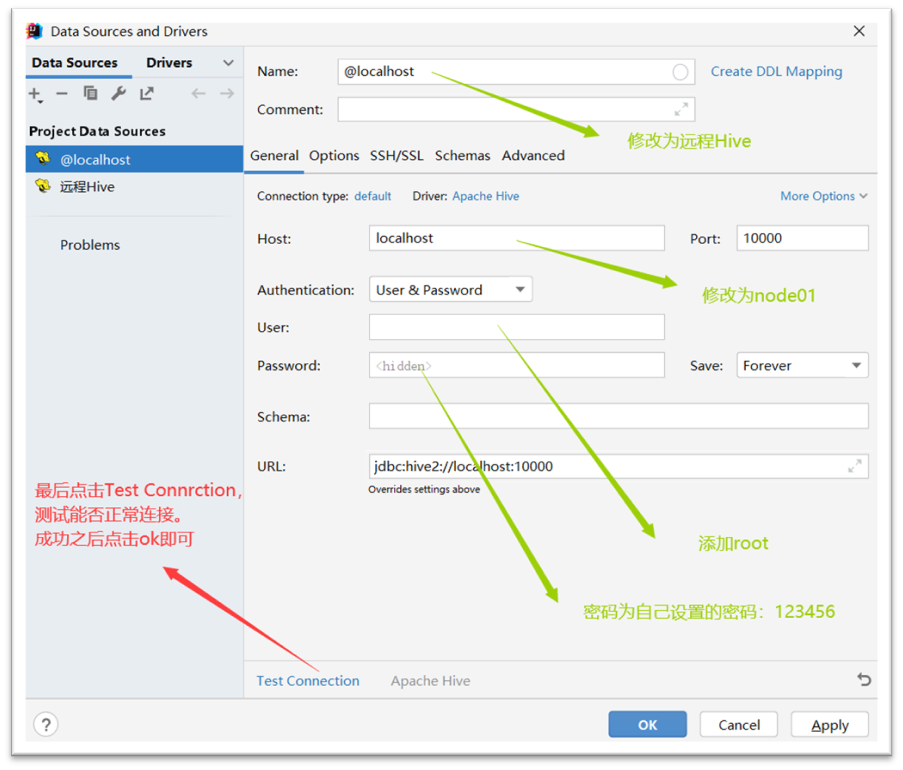
2. For operation reasons, choose idea to connect the hive table remotely. Operate on idea, as shown in the figure:
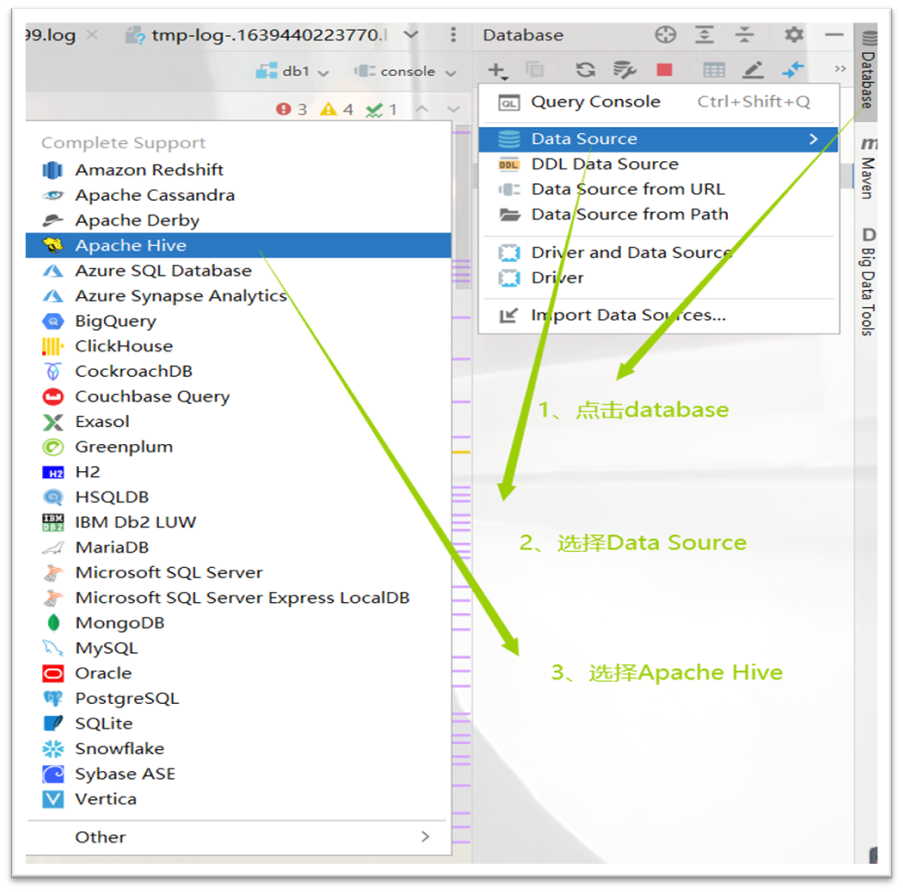
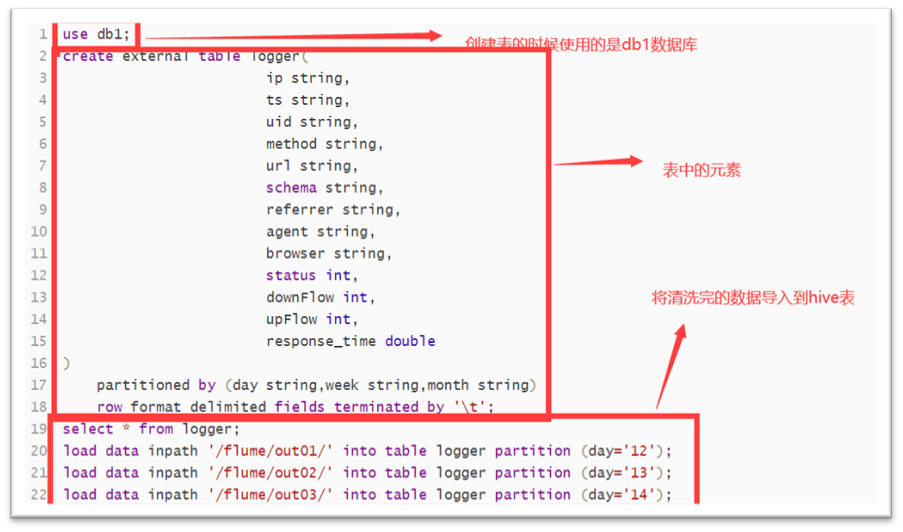
3. Create Hive table and import the cleaned data into Hive table, as shown in the figure:
4. Right click each part of the code to run
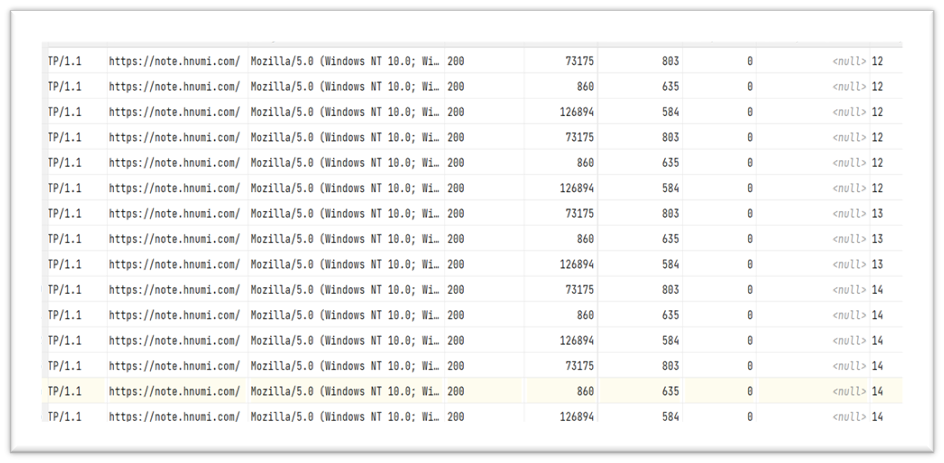
5. The effect after operation is shown in the figure:
3.6 import the final table into MySQL
1. Statistics of data:
Before importing into MySQL, the following statistics should be performed on the data:
- PV,UV: day / week / month
- Count the number of login users per day: the ID of the login user is POST /api/login request
- Count the number of student visits in each time period: day, week and month
- Statistics of the most frequently visited pages: Top 10. Day / week / month
- Users with more frequent visits: Top 10. Day / week / month
- System environment for statistical access: day / week / month [operating system version, browser and other information]
- Statistics of IP sources accessed
- Total IP count: day / week / month
[external chain picture transfer failed. The source station may have anti-theft chain mechanism. It is recommended to save the picture and upload it directly
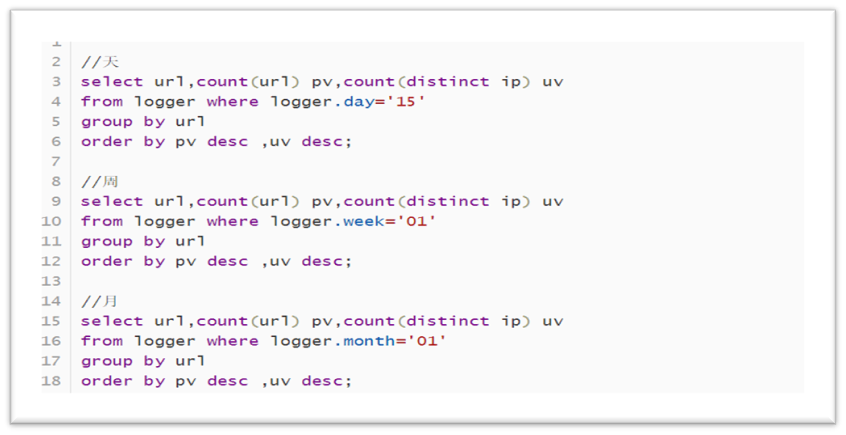
PV, UV: day / week / month:
The code is shown in the figure below:
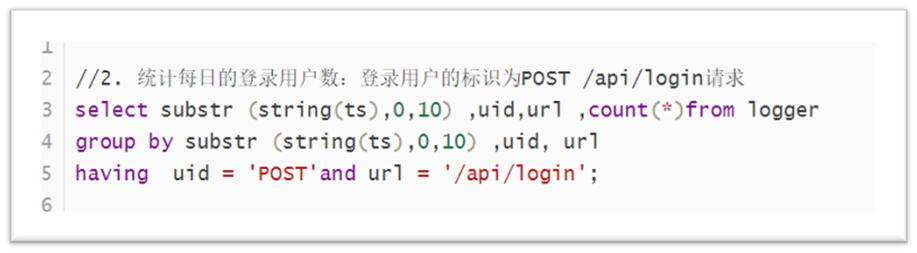
Count the number of login users per day: the ID of the login user is POST /api/login request:
The code is shown in the figure below:
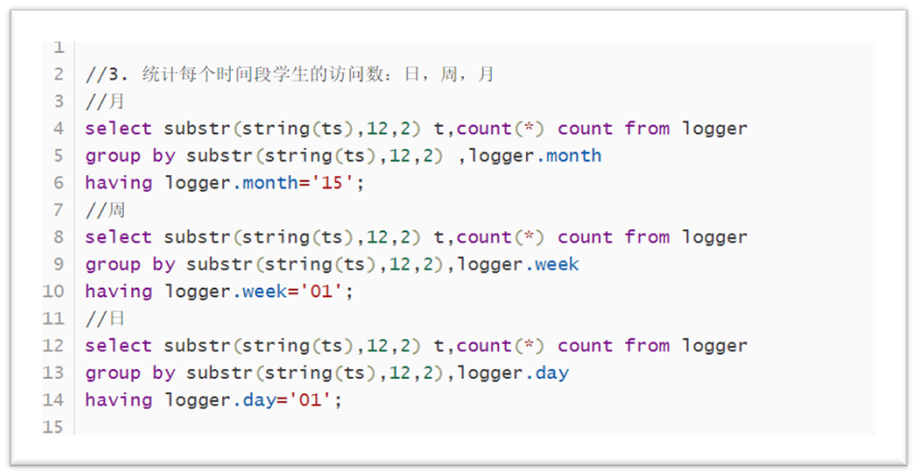
Count the number of student visits in each time period: day, week, month:
The code is shown in the figure below:
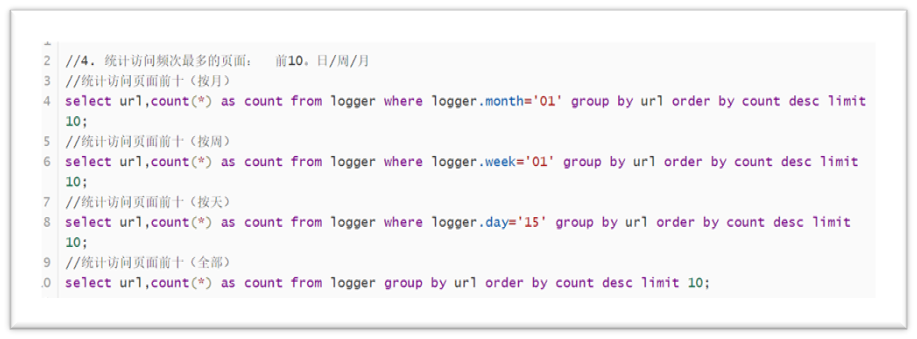
Statistics of the most frequently visited pages: Top 10. Day / week / month
The code is shown in the figure below:
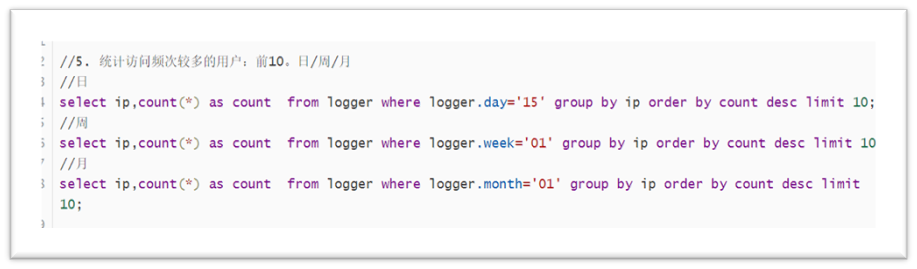
Users with more frequent visits: Top 10. Day / week / month:
The code is shown in the figure below:
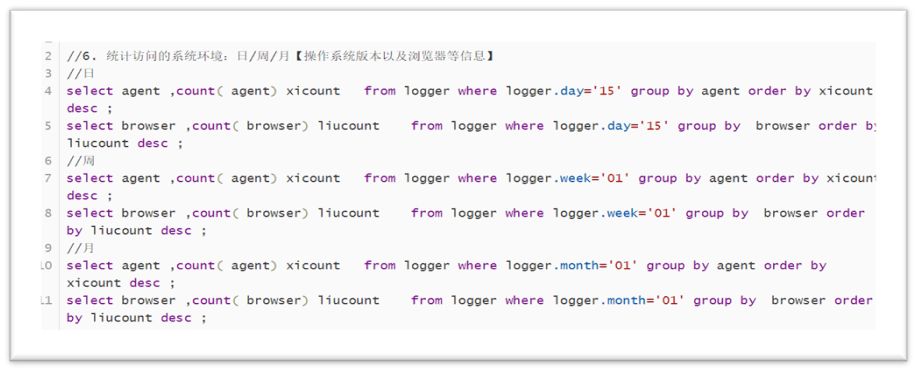
System environment for statistical access: day / week / month [operating system version, browser and other information]
The code is shown in the figure below:
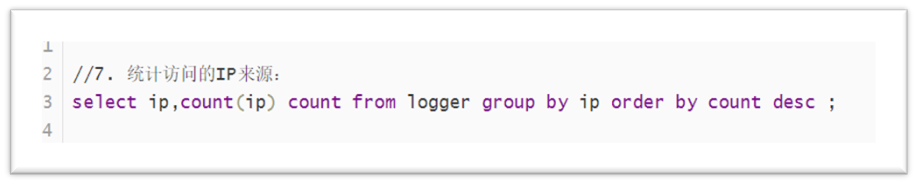
Statistics of IP sources accessed
The code is shown in the figure below:
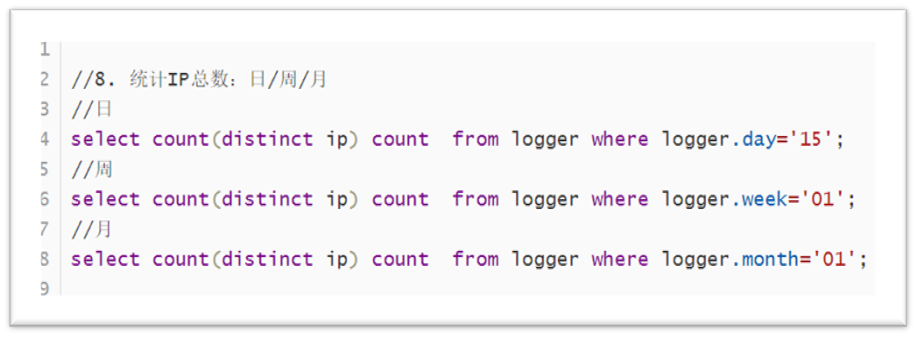
Total IP count: day / week / month
The code is shown in the figure below:
2. After the above statistics are completed, a partition table is established to store the eight statistical results
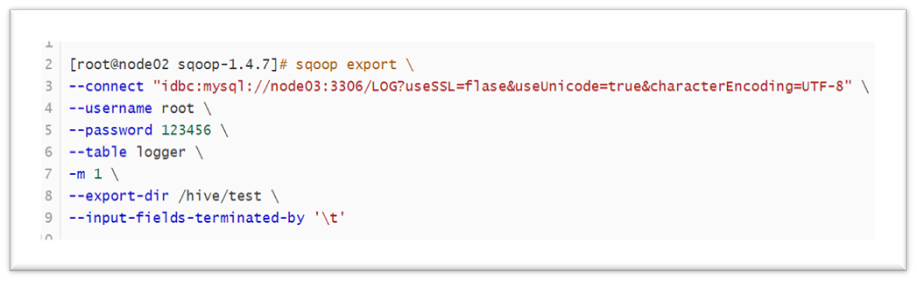
3. Import data into MySQL using Sqoop:
Complete the operation as shown in the code below to export the data
4. Create a new table for eight statistical tasks to store the statistical results
That is, add a create table (table name as) before the sql statement of all statistics
5. After creation, use sqoop to upload one by one
6. Note:
- Sqoop: is a transfer tool between Hadoop and relational database. You can use sqoop to import data from relational database management systems such as MySQL or Oracle into Hadoop distributed file system. You can convert data in Hadoop MapReduce, and then export the data to RDBMS.
- The function introduction of Sqoop does not say that Sqoop will automatically create a library or table, so we need to build the corresponding library and table in the database before exporting data
- Download and install Navicat to remotely connect to MySQL database on node03
- When creating a table, pay attention to the consistency of field code types, otherwise the import of data will fail
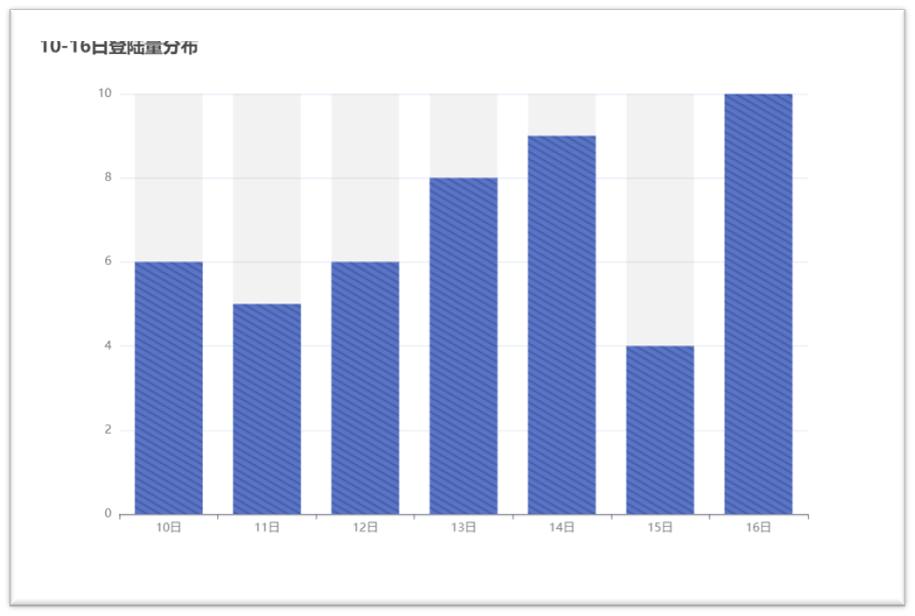
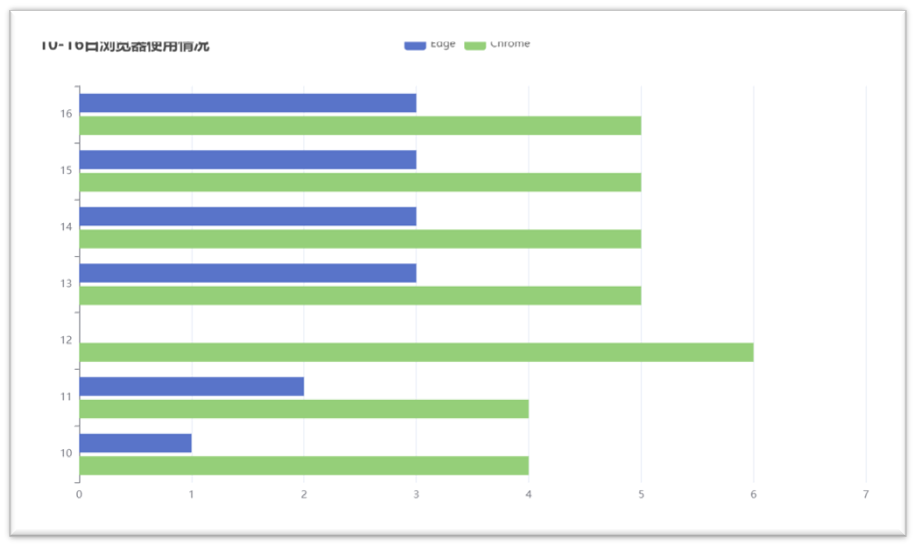
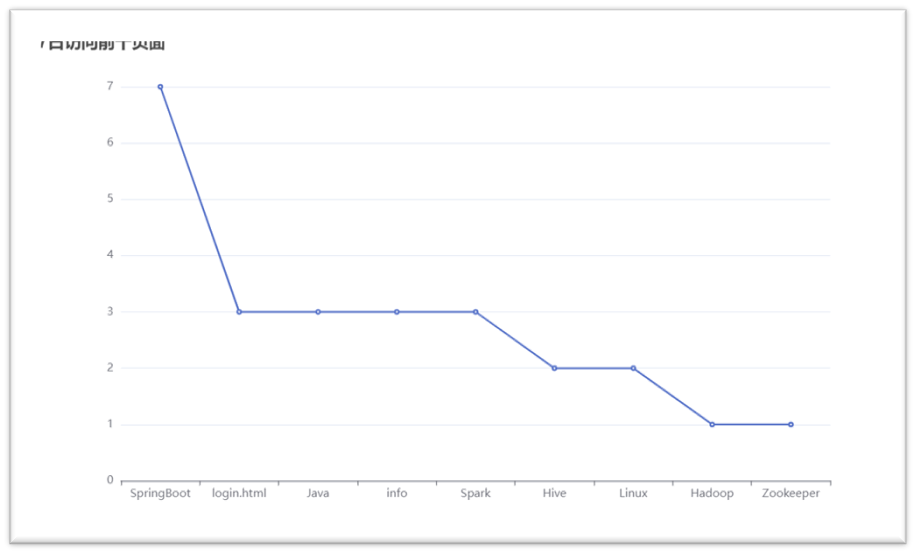
3.7 Web visualization
1. The data obtained from the analysis is visualized and generally displayed through charts, so that the operation decision-makers can obtain the data more conveniently and understand the data faster and more simply.
2. Here I recorded several parts of visualization, as shown in the following figure:
3. In order to complete the visualization operation simply, more beautiful and faster, I refer to the Echarts plug-in
4. Echarts website: https://echarts.apache.org/zh/index.html
5. After downloading, you can get the js you want to use
Chapter IV result analysis
In general, through continuous learning, the whole process can realize the website log analysis system based on big data technology, and can solve the problem that the existing tools are gradually unable to effectively deal with massive data. The tools mentioned in this article are as follows: Nginx for setting log data format, Flume for collecting, aggregating and transmitting log data information, Hadoop distributed file system HDFS for storing log data information, MapReduce for cleaning log data information, Hadoop data warehouse tool Hive for storing, querying and analyzing log data information Sqoop for data transfer between Hive and traditional database. The system should be able to implement a website log analysis system based on big data. As long as it can be realized, the optimization of enterprise websites, the maintenance of information security and the maintenance of websites should be better guaranteed than before.
The general relationship between modules is summarized as follows:
summary
During this project, with the help of teachers and students, this practical project was well completed, and all functions were basically realized. The deficiency is that the amount of log data is small, the calculation task can not be completed qualified, and the final visualization is relatively simple.
At the initial stage of the project, due to the lack of proficiency in big data related knowledge, my thinking has always been very vague. However, with the joint efforts of the team members, I have been consulting the students and teachers. We have gradually invested in it, which makes me understand that it is particularly important to cooperate with the team members. Not only that, this topic has also enhanced my logical thinking ability and greatly improved my ability to use big data related knowledge.
There are also many problems encountered in this practice, including the failure of hive client to start successfully, the failure of flume to monitor files, the failure of data export through sqoop, the failure of running jar package to find main classes and null pointers, etc. But I have solved it one by one by asking my classmates, querying information and asking teachers.
This topic not only reflects the cooperation among the team members, but also shows each of our personal abilities. I also fully experience the gap between myself and others, which is of great significance and help to my future study.
reference
[1] Zhu bin, design and implementation of log statistical analysis system based on Hadoop, September 2013
[2] code, https://www.cnblogs.com/rmxd/p/11466371.html
[3] Blogs seize every minute to live up to their youth https://blog.csdn.net/qq_45613931/article/details/103442812
[4] Authoritative Hadoop Guide: big data storage and analysis by Tom white
[5] Dong Xicheng detailed explanation of big data technology system: principle, architecture and Practice
[6] Lin Zhihuang's Hive performance practice
[7] Blog: the programming model Flume data collection component
Course evaluation transcript
| project | Score | A excellent (100 > x ≥ 90) | B good (90 > x ≥ 80) | C medium (80 > x ≥ 70) | D pass (70 > x ≥ 60) | E fail (X < 60) | Score |
|---|---|---|---|---|---|---|---|
| Learning attitude | 10 | Serious learning attitude. The scientific style is rigorous, the design time is strictly guaranteed, and all work is carried out according to the progress specified in the assignment | Serious learning attitude. Scientific and rigorous style, able to successfully complete the tasks specified in the mission statement on schedule | Good learning attitude, abide by organizational discipline, and basically ensure the completion of all work within the design time | Good learning attitude, able to abide by organizational discipline and complete tasks on schedule | Sloppy learning, lax discipline and lax work style can not guarantee the design time and progress | |
| defence | 25 | The oral defense is fluent, the project introduction is complete, which can fully reflect the personal work and experience in the project, answer questions accurately and in detail, and the oral defense time meets the requirements | The oral defense is fluent and the project introduction is complete, which reflects the work done by the individual in the project. The oral defense time meets the requirements and the answers to questions are more accurate | The expression in the reply is basically smooth, reflecting the work done by the individual in the project. The reply time meets the requirements, and the answers to most questions are basically accurate | The reply is smooth, reflecting the work done by the individual in the project, and some questions are answered accurately | The expression in the defense is smooth, and the questions are basically not. | |
| Item score | 40 | The design is reasonable, the function is perfect and there are almost no errors, the function of the responsible module is perfect and there are basically no errors, the code writing comments are clear and standardized, the visual display effect is good, the interaction is reasonable, there is a strong practical ability, the literature citation is reasonable, and the investigation is very reasonable and credible | The design is reasonable, the function is perfect and there are a few errors, the function of the responsible module is perfect and there are a few errors, the code writing comments are clear and standardized, the visualization effect is good, and has strong practical ability. The literature citation and investigation are reasonable and credible | The design is reasonable, the function is basically perfect and there are a few errors, the function of the responsible module is basically perfect and there are a few errors, the code writing comments are clear and standardized, the visualization effect is good, there is a certain practical ability, and the main literature citation and investigation are relatively reliable | The design is basically reasonable, the project design is basically completed, and some code is written and annotated, but it can not be run or tested | The design is unreasonable, there is basically no program written or the program is purely plagiarized, the practical ability is poor, and there are major problems in literature citation and investigation | |
| Report score | 25 | Rigorous structure, strong logic, clear structure, accurate language, fluent text, fully meet the standardization requirements, clear and neat | The structure is reasonable, logical, the article is hierarchical, the language is accurate, the text is smooth, in line with the requirements of standardization, neat and clear | The structure is reasonable, the level is clear, the inquiry is smooth, basically meets the standardization requirements, and is relatively neat and clear | The structure is basically reasonable, the logic is basically reasonable, and the words are smooth, barely meeting the standardization requirements; | The structure is chaotic, the text expression is unclear, and there are many typos, which can not meet the requirements of standardization; | |
| Final score |
Instructor signature:
specific date