tidyr package
tidyr package mainly involves the following functions and functions:
1) Simple complement of missing values
2) Long table variable width table and wide table variable length table
gather - convert the data with larger width into a longer form, that is, wide table and variable length table
spread - converts long data into a wider form, that is, a long table becomes a wide table
3) Column splitting and column merging
separate - splits a column into multiple columns by separator
unite - combines multiple columns into one column with the specified separator
The main function of tidyr package is the conversion between long table and wide table, which is similar to the PivotTable in Excel. Therefore, some people call the conversion between long table and wide table pivot and inverse pivot. The conversion process is shown in the following figure:

At this time, someone may ask: Well, why do you want to convert between long table and wide table? Imagine the blue part of the wide table in the figure above. The header is the corresponding time period:
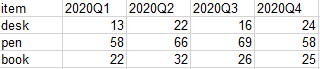
If we need to use this dataset all the time, its header will change with the passage of time. At this time, we need to modify the corresponding code, which is very troublesome. After changing to the corresponding long table, we only need to pivot the long table to get the data of the wide table. The corresponding code does not need to be changed. Is it much more convenient?
Install and import tidyr package
install.packages("tidyr")
library(tidyr)
Simple complement of missing values
replace_na() function
replace_na function syntax can replace missing values in data.
#Create a dataset with missing values
df <- data.frame(x = c(1,2,7,NA,NA,10,22,NA,15),
                 y = c('a',NA,'b',NA,'b','a','a','b','a'))
#Calculate the mean of x and the mode of y column, and replace the missing value with these two values (of course, you can also select the maximum value, median, etc. to fill in the missing value, as the case may be)
x_mean <- mean(df$x, na.rm = TRUE)
y_mode <- as.character(df$y[which.max(table(df$y))])
#Replace missing values
df2 <- replace_na(data = df, replace = list(x = x_mean, y = y_mode))
Supplementary part: identification of missing values
The general steps to deal with missing values are: identify missing values - the reason for missing data - delete missing values or replace missing values with reasonable values.
When identifying missing values, you can use is NA(),is.nan(), and is The infinite () function is used to identify whether there is a missing value in the data set, but these functions return whether each element in all vectors or data frames is a missing value. It is not easy to use if the amount of data is very large. Another way is to use the md.pattern() function in the mice package to find patterns with missing values in the dataset. However, this method can only identify NA and NaN in R as missing values, not - Inf and Inf as missing values. The processing method can replace these values with NA.
> library(mice)
> md.pattern(df)
  y x
5 1 1 0
2 1 0 1
1 0 1 1
1 0 0 2
  2 3 5
The function returns the missing value in the dataset, where the number under the x and y columns indicates whether there is a missing value in the column, 0 indicates that there is a missing value in the column, and 1 indicates that there is no missing value in the column. The number corresponding to the first column represents the number of missing cases, and the last column represents the number of variables with missing values. The last line is the number of missing values for each variable.
According to the above results, the corresponding values of columns X and Y in the first row are 1, which means that there are no missing values in columns X and Y. there are five rows of data in the whole data set without missing values, and the corresponding data in the first column is 5 At the same time, because X and y have no missing values, the number of variables with missing values is 0 The next few rows are the same. Then to the last row, 2 in column y indicates that there are 2 Na values for the variable y, 3 Na values for X, and 5 missing values in the whole dataset.
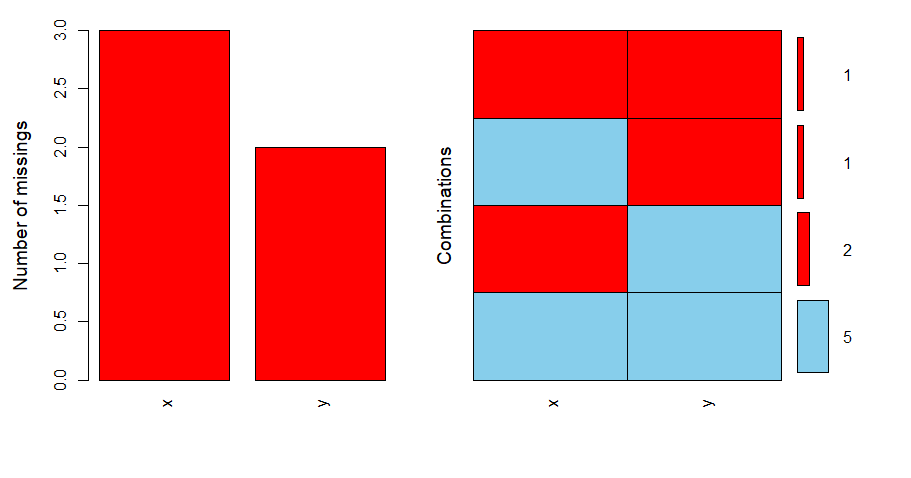
At the same time, we can also visualize the missing data through the aggr() function in the VIM package:
library(VIM)
aggr(df, prop = FALSE, numbers = TRUE)
Mutual conversion of length and width tables
gather() function
The gather() function converts wide data into long data. The function syntax and parameters are as follows:
> gather(data=,key=,value=,...,na.rm=,convert=,factor_key=)
# key: create a new column name. The value of this column is the column name of the data before conversion
# value: create a new column name, and the corresponding values of all old column names of the original data become the values of the new column name
# ...:  Specify the columns to be converted according to the actual needs
# na.rm: logical value. Delete missing value
# convert: a logical value that determines whether data type conversion is performed in the key column
# factor_key: logical value. If F, the key will be automatically converted to a string, otherwise it will be a factor (the original lever level remains unchanged)
Usage example:
#For the test data, we select the Iris data set built in R
head(iris,3)
#Convert all columns in iris into long tables (some columns may be automatically deleted if the data types are inconsistent)
gather(iris,key=var1,value = var2,na.rm = F)
#Add petal in iris Length and petal Convert width column to long table
gather(iris,key=var1,value = var2,Petal.Length,Petal.Width,na.rm = F)
#Convert the first to fourth columns in iris into long tables
gather(iris,key=var1,value = var2,1:4,na.rm = F)
spread() function
The spread() function converts long data into wide data, expanding columns into rows. The syntax is as follows:
spread(data, key, value, fill = NA, convert = FALSE, drop = TRUE)
data: Is a long table that needs to be converted
key: You need to expand the variable value to the variable of the field
value: Scattered values are required
fill: For missing values, you can fill Assign value to replace missing value
convert: Used to convert data types
Usage example:
Create a test dataset
df = data.frame(name=c("A","A","B","B"),
                group=c("g1","g2","g1","g2"),
                V1=c(10,40,20,30),
                V2=c(6,3,1,7))
#According to the corresponding V1, v2 columns are converted to wide tables
gather(df, Var1, Val2, V1:V2)
Column splitting and column merging
unite() function
The unite() function combines multiple columns in the data frame into one column. The calling formula is as follows:
> unite(data, col, ..., sep = "_", remove = TRUE, na.rm = FALSE)
#Data: data set used
# col: Specifies the name of the new column to be combined
# ...: Specifies which columns in the data are grouped together, and supports tidy selection
# sep: separator between data in new column after combination
# remove: logical value, whether to keep the columns participating in the combination
#na.rm: delete blank
Usage example:
#Connect the name and group in the df dataset
unite(df,add_col,name,group)
unite(df,add_col,1:2)
unite(df,add_col,c(name,group))
#Merge all columns starting with V
unite(df,add_col,starts_with("V"))
#With_ Merge the first two columns for the separator, and merge the last two columns with:
df %>%
unite(add_col,c(name,group),sep='_') %>%
unite(all_unite,c(add_col,V1,V2),sep=':')
separate() function
The separate() function is just opposite to the unite() function, that is, a column in the data frame is divided into multiple columns according to the separator. Its syntax is as follows:
> separate(data,col,into,sep,remove = TRUE,extra = "warn",fill = "warn",...)
# Data: data set used
# col: column to be split
# into: defines the new column name after splitting
# sep: separator
# remove: logical value. If True, the split column will be deleted
#Build a test dataset
test = data.frame(name=c("Tom_MR","Carter_Tomp","Sandy_Yu","Bob_Smith"),
                group=c("g1","g2","g1","g2"),
                V1=c(10,40,20,30),
                V2=c(6,3,1,7))
#Keep the columns in the original data before splitting
separate(test,name,c("frist_name","last_name"),sep="_",remove = FALSE)
#Columns in the original data before splitting are not retained
separate(test,name,c("frist_name","last_name"),sep="_")
Reference article:
https://rpubs.com/bradleyboehmke/data_wrangling
https://zhuanlan.zhihu.com/p/22265154
https://www.cnblogs.com/nxld/p/6060533.html