Image data type conversion, image stretching and band judgment
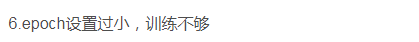
Through the pit... I won't mention it. Before the training of in-depth learning, when the data sets are almost completed, that is, downloading, labeling, cutting and screening are all finished. Sent to the network for training. Due to the inconsistency of data types, the prediction results are black. After consulting many materials, there are many possible situations. (the screenshot below is from someone else's blog)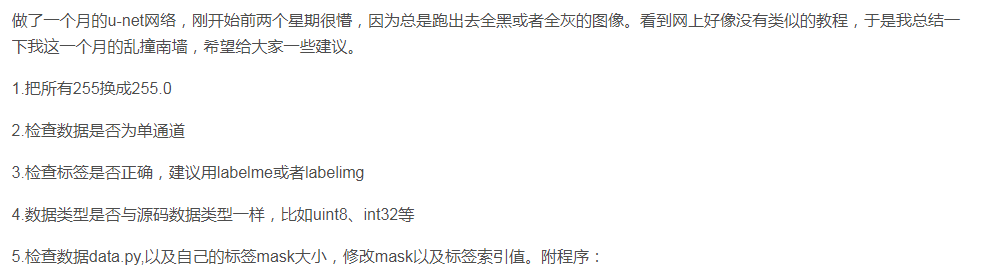
Then I found the reason for the data type and was ready to try this. Because it is true that other people's data can be clicked directly, and ours can only be clicked in ArcGSI. For someone who is used to png, it really looks eye-catching... Then right-click to view the properties of the image and mask. They are really different. uint8 type can be opened, so I asked elder martial brother for a code to convert data types.
import os
import numpy as np
from PIL import Image
from osgeo import gdal
import cv2
# Convert image type to uint8 type (image stretch)
def get_uint8_image(image, vmin, vmax, pmin, pmax):
    ''' Scale image from float (or any) input array to uint8
    Parameters
    ----------
        image : 2D matrix  # The two-dimensional matrix is passed in, and the multi-dimensional matrix needs to call this function multiple times
        vmin : float - minimum value  # Usually set to None. Four parameters, either the first two or the last two
        vmax : float - maximum value  # Usually set to None. These two parameters describe the size of the maximum and minimum values in the image.
        pmin : Lower boundary, take percentage, that is, percent pmin Discard the following and focus on stretching the middle part
        pmax : Upper boundary, take percentage, that is, percent pmax Discard the above and focus on stretching the middle part
    Returns
    -------
        2D matrix  # Returns a two-dimensional matrix
    '''
    if vmin is None:
        vmin = np.nanpercentile(image, pmin)
    if vmax is None:
        vmax = np.nanpercentile(image, pmax)
    # redistribute into range [0,255]
    uint8Image = 1 + 254 * (image - vmin) / (vmax - vmin)  # Image stretching
    uint8Image[uint8Image < 1] = 1  # In a two-dimensional matrix, all parts less than 1 are stretched into 1
    uint8Image[uint8Image > 255] = 255  # In the two-dimensional matrix, all parts greater than 255 are stretched into 255
    uint8Image[~np.isfinite(image)] = 0   # ~Is to take the inverse and set all infinite values, minimax, nan, etc. in the two-dimensional matrix to 0
    # The converted image does not contain nan value and will become 0
    return uint8Image.astype('uint8')  # Return the image of uint8 type. At this time, you can double-click the image on the desktop to view the content
As for image stretching, I have to mention the sad thing just now. Let's put the picture first.
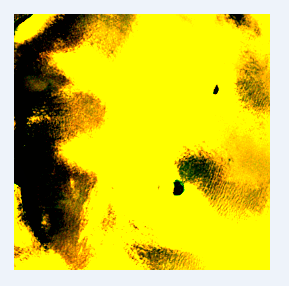
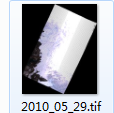
This is a patch that cuts first and then stretches: (it seems that the Tif diagram can't be pulled up directly, and the format error will be displayed, so the screenshot is used and more useless edges are cut)
This is a patch that stretches first and then cuts:
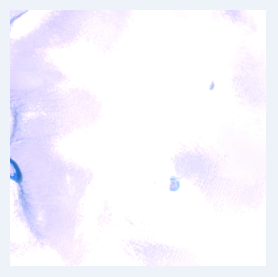
I cut on the three channels of RGB. So the second patch should be displayed in true color. Since the first patch is cut first, compared with the original large image before cutting (it is not opened, the image is too large, but it can still be seen that it is a true color image):
As like as two peas, the difference is not consistent with the maximum and minimum values. But no matter what you open it with, it will stretch you. ArcGIS or ordinary editor should stretch the data of your original image In other words, the upper and lower limits become the maximum and minimum values of your patch, rather than the maximum and minimum values of the original graph. In this way, of course, the color will be different, but there is no difference in the value. It just doesn't look very comfortable. It's not easy to identify. In order to avoid this problem, we should take the initiative to do normalized image stretching and avoid automatic stretching by other software. Therefore, stretching should be done at the beginning, and then cutting should be done to ensure that all patches are consistent with the original drawing. The final result is that the data types are consistent, and the network prediction is not black. (of course, I did the cutting, screening and other steps again, leaving painful tears on the cervical spine)
At the same time, there is another advantage. This code is also very considerate for other situations, such as the existence of nan value in the image or the value exceeding the stretching interval. In fact, looking at this formula, you will feel that stretching is very similar to normalization. The idea changes from one interval to another. As for what kind of relationship they have and whether they are interlinked, they don't talk nonsense without further access to information. In a word, this code solves the stretching problem of a two-dimensional matrix and the problem of data type conversion.
However, for our own data, two-dimensional matrix alone is not enough. We are multi-channel, so we integrated it and wrote a suitable one.
PS: in order to save trouble, I took out the judgment of the band separately and wrote a small function. After all, there are many integrated functions behind, so I need to judge this band.
# Detect the number of bands of tif map
def band_number(img_path):
    im_data, im_geotrans, im_proj = readTiff(img_path)
    im_bands, im_height, im_width = im_data.shape
    return im_bands
# Convert all tif diagrams to uint8 type
def transform_allTiff_into_uint8(src_path,des_path):
    dirs = os.listdir(src_path)  # Read file names one by one
    i = 0
    over_No = 134  # The total number of images to be detected can be set as required
    for file_name in dirs:
        file_path = src_path + "/" + file_name  # Source img path
        im_data, im_geotrans, im_proj = readTiff(file_path)
        if(band_number(file_path) == 1):  # Single channel (grayscale image)
        # print(im_data.shape)
            im_height, im_width = im_data.shape
            uint_data = np.zeros((im_height, im_width)).astype(np.uint8)
            uint_data[::] = get_uint8_image(im_data, None, None, 0, 100)  # The last two parameters can be adjusted to 10,99, corresponding to arcGIS display
            writeTiff(uint_data, im_geotrans, im_proj, des_path + "/" + file_name)
        else:  # Multichannel
            im_bands, im_height, im_width = im_data.shape
            uint_data = np.zeros((im_bands, im_height, im_width)).astype(np.uint8)
            for j in im_bands:  # For loop is used for multiple bands, and the corresponding bands are converted one by one
                uint_data[j,::] = get_uint8_image(im_data[j], None, None, 0, 100)  # The last two parameters can be adjusted to 10,99, corresponding to arcGIS display
            # uint_data[0, ::] = get_uint8_image(im_data[0], None, None, 0, 100)  # R
            # uint_data[1, ::] = get_uint8_image(im_data[1], None, None, 0, 100)  # G
            # uint_data[2, ::] = get_uint8_image(im_data[2], None, None, 0, 100)  # B
            writeTiff(uint_data, im_geotrans, im_proj, des_path+"/"+ file_name)
        # print(uint_data.shape)
        # print(file_path)
        print(i)
        i = i + 1
        if i == over_No:  # Termination conditions
            break
    print("transform over")
The code of image reading and writing reference 1. Just copy and paste directly.