On April 15, 1912, during its first voyage, the Titanic sank after hitting an iceberg, killing 1502 of 2224 passengers and crew members.The tragedy stirred up the international community.One of the reasons for the shipwreck was that there were not enough lifeboats for the passengers and crew.Although there was some luck in surviving this disaster, some people are more likely to survive than others, such as women, children and the upper classes.
1. Data Description
survival - survival (0 = survival, 1 = Death)
pclass - Ticket type (1 = first class, 2 = second class, 3 = third class)
sex - Gender
Age-age
Number of siblings on the sibsp-Titanic
parch-Titanic is good at the number of parents or children of this person
ticket - ticket number
Fare - Passenger fare
Cabin - cabin number
embarked - Port of departure (C = Cherbourg, Q = Queenstown, S = Southampton)
boat - lifeboat number (if survived)
Body - human number (if in distress and the body is found)
home.dest - Departure to destination
2. Data analysis
2.1 Survival Analysis

Calculations show that only about 38% of the passengers survived, and the tragedy occurred because the Titanic did not carry enough lifeboats, only 20, which was not enough for 1317 passengers and 885 crew members.
2.1 Class Status Analysis
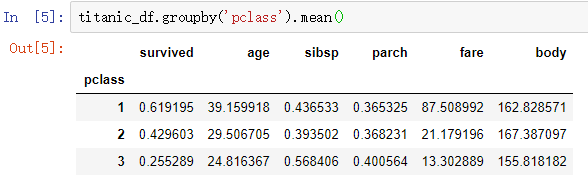
We can see that first-class has a 62% chance of survival for passengers, compared with third-class with a 25.5% chance of survival. The more luxurious the cabin, the older the passengers are, and the first-class fare is significantly higher than second-class and third-class fares.
2.2 Class and Gender Analysis
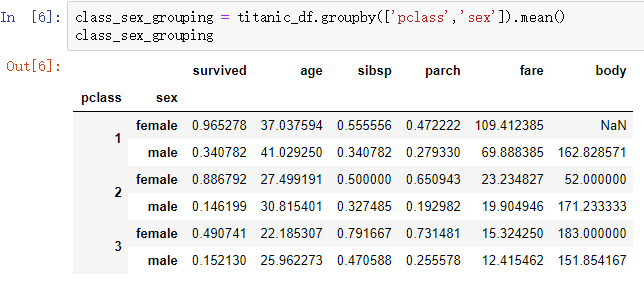
From the above analysis, we can see that people tend to evacuate women and children first when the tragedy happens.In all strata, women are more likely to survive than men.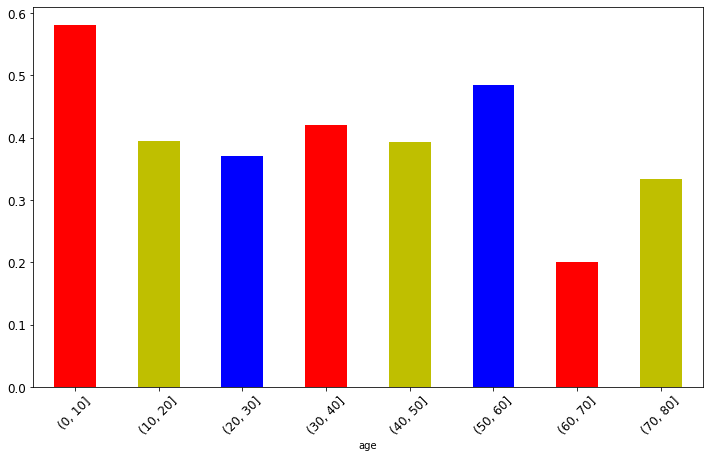
From the analysis of the chart above, it can be seen that the likelihood of children surviving the tragedy was relatively high.
3. Data Processing
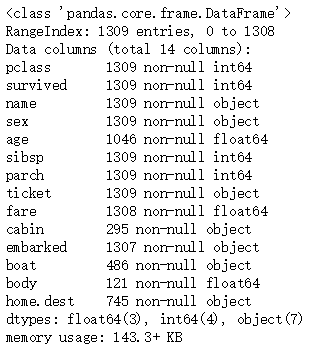
Before building a machine learning model, we need to delete the fill-in missing values and divide the dataset into training and test sets.
3.1 Missing Value Handling
3.1.1 Delete missing data by column
Because boat, cabin, body are missing severely and can not provide enough information for subsequent analysis, delete the three fields boat, cabin, body
3.1.2 Delete missing data by row
Because age also has a big impact on whether passengers can live or not, we chose to delete the missing part of the data in the age field.
3.2 Encoding Conversion
Both sex and embarked are string values corresponding to categories (for example, sex has two values, male and female), so we can convert category strings to numeric data by LabelEncoder, such as converting "male" and "female" to 0 and 1, respectively.The name, ticket, home.dest fields cannot be coded into numeric data, so we remove them from the dataset.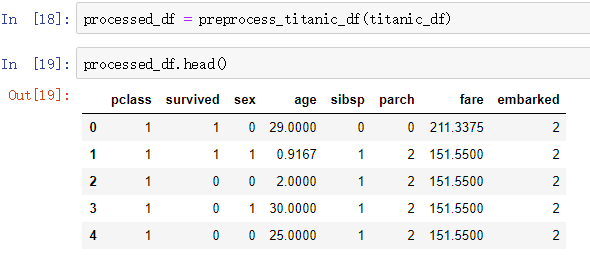
4 Machine Learning
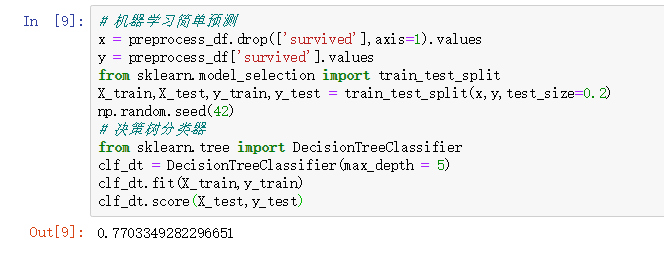
4.1 Simple predictions for machine learning
4.2 K Fold Cross Validation
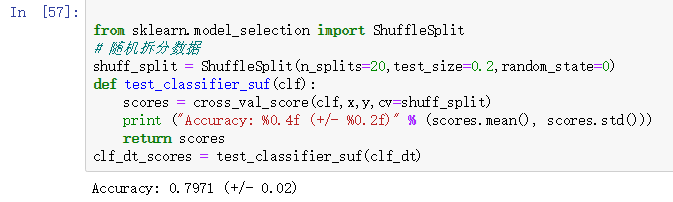
Different dataset selections also result in different predictions.The average prediction accuracy of the above decision tree models is 79.61%, which can vary by about 2% depending on the data.
4.3 Feature Selection
We can also use the random forest algorithm to get the weights of different features in the final result prediction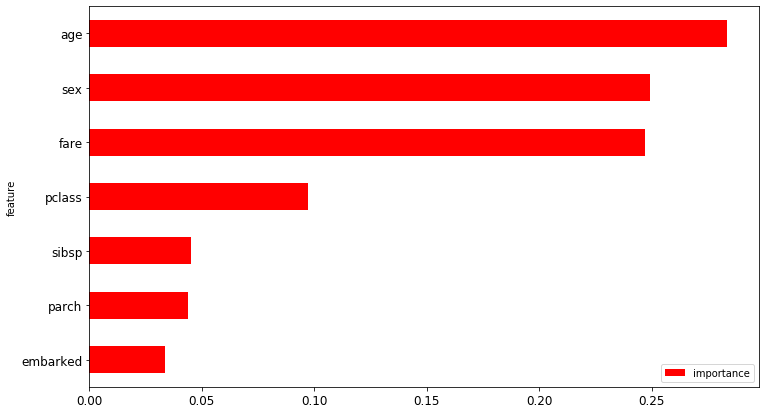
4.4 Comparison of Multiple Models
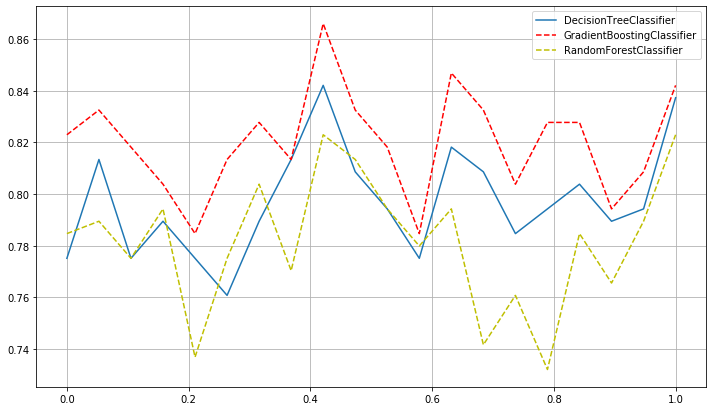
By comparing the figures above, we can see that the stochastic forest algorithm performs well in the current data prediction, with an optimal value of more than 86%.
5 Case Data
5.1 Case Dataset
Link: https://pan.baidu.com/s/1f4AIFes0yTW1ndQOyi-crg
Extraction Code: 1uey
5.2 Complete Code
#!/usr/bin/env python
# coding: utf-8
# Import python trigonometric library functions
import os
import matplotlib.pyplot as plt
get_ipython().run_line_magic('matplotlib', 'inline')
import random
import numpy as np
import pandas as pd
from sklearn import preprocessing
data_path='Case data'
titanic_df = pd.read_excel(os.path.join(data_path,'titanic3.xls'),'titanic3',index_col=None,na_values=['NA'])
titanic_df.head()
titanic_df['survived'].mean()
titanic_df.groupby('pclass').mean()
class_sex_grouping = titanic_df.groupby(['pclass','sex']).mean()
class_sex_grouping
class_sex_grouping['survived'].plot.bar(figsize=(12,7),fontsize=12)
plt.xticks(rotation=45)
group_by_age = pd.cut(titanic_df['age'],np.arange(0,90,10))
age_grouping = titanic_df.groupby(group_by_age).mean()
age_grouping['survived'].plot.bar(figsize=(12, 7),colors=['r','y','b'],fontsize=12)
plt.xticks(rotation=45)
titanic_df.info()
# axis = 1 Delete by column
titanic_df = titanic_df.drop(['body','boat','cabin'],axis=1)
titanic_df['home.dest'] = titanic_df['home.dest'].fillna('NA')
titanic_df.head()
titanic_df = titanic_df.dropna()
titanic_df.info()
def preprocess_titanic_df(df):
preprocess_df = df.copy()
le = preprocessing.LabelEncoder()
preprocess_df.sex = le.fit_transform(preprocess_df.sex)
preprocess_df.embarked = le.fit_transform(preprocess_df.embarked)
preprocess_df = preprocess_df.drop(['name','ticket','home.dest'],axis=1)
return preprocess_df
preprocess_df = preprocess_titanic_df(titanic_df)
preprocess_df.head()
# Machine Learning Simple Prediction
x = preprocess_df.drop(['survived'],axis=1).values
y = preprocess_df['survived'].values
from sklearn.model_selection import train_test_split
X_train,X_test,y_train,y_test = train_test_split(x,y,test_size=0.2)
np.random.seed(42)
# decision tree classifier
from sklearn.tree import DecisionTreeClassifier
clf_dt = DecisionTreeClassifier(max_depth = 5)
clf_dt.fit(X_train,y_train)
clf_dt.score(X_test,y_test)
# Cross-validation measures model performance
from sklearn.model_selection import ShuffleSplit,cross_val_score
# Random Split Data
shuff_split = ShuffleSplit(n_splits=20,test_size=0.2,random_state=0)
def test_classifier_suf(clf):
scores = cross_val_score(clf,x,y,cv=shuff_split)
print ("Accuracy: %0.4f (+/- %0.2f)" % (scores.mean(), scores.std()))
return scores
clf_dt_scores = test_classifier_suf(clf_dt)
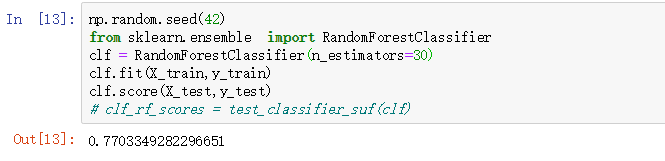
# Random Forest
# from sklearn.feature_selection import SelectFromModel
np.random.seed(42)
from sklearn.ensemble import RandomForestClassifier
clf = RandomForestClassifier(n_estimators=50)
clf_rf_scores = test_classifier_suf(clf)
np.random.seed(42)
from sklearn.ensemble import GradientBoostingClassifier
# from sklearn.feature_selection import SelectFromModel
clf = GradientBoostingClassifier(n_estimators=50)
clf_grad_scores = test_classifier_suf(clf)
# Random Forest
from sklearn.ensemble import RandomForestClassifier
from sklearn.feature_selection import SelectFromModel
np.random.seed(42)
clf = RandomForestClassifier(n_estimators=50)
clf = clf.fit(X_train,y_train)
test_classifier_suf(clf)
features = pd.DataFrame()
features["feature"] = ["pclass","sex","age","sibsp","parch","fare","embarked"]
features["importance"] = clf.feature_importances_
features.sort_values(by=["importance"],ascending=True,inplace=True)
features.set_index('feature',inplace=True)
features.plot(kind="barh",figsize=(12,7),fontsize=12)
plt.show()
x = np.linspace(0,1,20)
plt.figure(figsize=(12,7)) #Similar to declaring a picture first, all settings after this figure work on this picture
plt.plot(x,clf_dt_scores,label="DecisionTreeClassifier") #Drafting
plt.plot(x,clf_grad_scores,color='r',linestyle='--',label="GradientBoostingClassifier") #Set the color and style of the function line
plt.plot(x,clf_rf_scores,color='y',linestyle='--',label="RandomForestClassifier") #Set the color and style of the function line
plt.legend(loc="upper right")
plt.grid()
plt.show()

