Recently, when writing an ID generator, we need to compare the speed difference between UUID and the popular NanoID. Of course, we also need to test the ID generator created according to the rules.
Such code belongs to the most basic API. Even if the speed is reduced by a few nanoseconds, it can add up considerably. The key is, how can I evaluate the speed of ID generation?
1. How to count performance?
The common method is to write some statistical code. These codes are interspersed in our logic to perform some simple timing operations. For example, the following lines:
long start = System.currentTimeMillis();
//logic
long cost = System.currentTimeMillis() - start;
System.out.println("Logic cost : " + cost);
Copy code
 Copy code
This statistical method is not necessarily a problem when used in business code, even in APM.
Unfortunately, the statistical results of this code are not necessarily accurate. For example, when the JVM executes, it will JIT compile and inline optimize some code blocks or frequently executed logic. Before obtaining a stable test result, it needs to cycle for tens of thousands of times to warm up. The performance difference before and after preheating is very large.
In addition, there are many indicators to evaluate performance. If these index data have to be calculated manually every time, it must be boring and inefficient.
JMH(the Java Microbenchmark Harness) is such a tool that can do benchmarking. If you locate the hot code through our series of tools, you can give it to JMH to test its performance data and evaluate the improvement. Its measurement accuracy is very high, up to the nanosecond level.
JMH has been included in JDK 12. maven needs to be introduced in other versions. The coordinates are as follows.
<dependencies>
        <dependency>
            <groupId>org.openjdk.jmh</groupId>
            <artifactId>jmh-core</artifactId>
            <version>1.23</version>
        </dependency>
        <dependency>
            <groupId>org.openjdk.jmh</groupId>
            <artifactId>jmh-generator-annprocess</artifactId>
            <version>1.23</version>
            <scope>provided</scope>
        </dependency>
    </dependencies>
Copy code
 Copy code
Next, let's introduce the use of this tool.
2. Key notes
JMH is a jar package, which is very similar to the unit test framework JUnit. Some basic configurations can be made through annotations. Many of these configurations can be set through the OptionsBuilder of the main method.
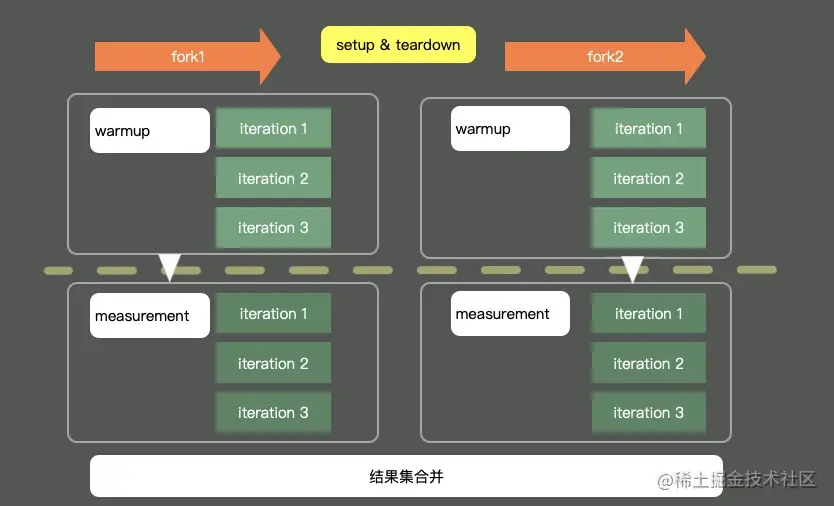
The figure above shows the execution of a typical JMH program. By starting multiple processes and threads, first perform warm-up, then perform iteration, and finally summarize all test data for analysis. Before and after execution, some pre and post operations can also be processed according to granularity.
A simple code is as follows:
@BenchmarkMode(Mode.Throughput)
@OutputTimeUnit(TimeUnit.MILLISECONDS)
@State(Scope.Thread)
@Warmup(iterations = 3, time = 1, timeUnit = TimeUnit.SECONDS)
@Measurement(iterations = 5, time = 1, timeUnit = TimeUnit.SECONDS)
@Fork(1)
@Threads(2)
public class BenchmarkTest {
    @Benchmark
    public long shift() {
        long t = 455565655225562L;
        long a = 0;
        for (int i = 0; i < 1000; i++) {
            a = t >> 30;
        }
        return a;
    }

    @Benchmark
    public long div() {
        long t = 455565655225562L;
        long a = 0;
        for (int i = 0; i < 1000; i++) {
            a = t / 1024 / 1024 / 1024;
        }
        return a;
    }

    public static void main(String[] args) throws Exception {
        Options opts = new OptionsBuilder()
                .include(BenchmarkTest.class.getSimpleName())
                .resultFormat(ResultFormatType.JSON)
                .build();
        new Runner(opts).run();
    }
}
Copy code
 Copy code
Next, let's introduce the key annotations and parameters one by one.
@Warmup
Sample.
@Warmup(
iterations = 5,
time = 1,
timeUnit = TimeUnit.SECONDS)
Copy code
 Copy code
We mentioned warm-up more than once. The warm up annotation can be used on classes or methods for warm-up configuration. As you can see, it has several configuration parameters.
- timeUnit: the unit of time. The default unit is seconds.
- Iterations: iterations of the warm-up phase.
- Time: the time of each preheating.
- batchSize: batch size, which specifies how many times the method is called for each operation.
The above note means that the code is preheated for a total of 5 seconds (five iterations, one second each time). The test data of preheating process do not record the measurement results.
We can see the effect of its implementation:
# Warmup: 3 iterations, 1 s each
# Warmup Iteration   1: 0.281 ops/ns
# Warmup Iteration   2: 0.376 ops/ns
# Warmup Iteration   3: 0.483 ops/ns
 Copy code
 Copy code
Generally speaking, benchmarks are aimed at relatively small code blocks with relatively fast execution speed. These codes are likely to be compiled and inlined. Keeping the methods concise during coding is also good for JIT.
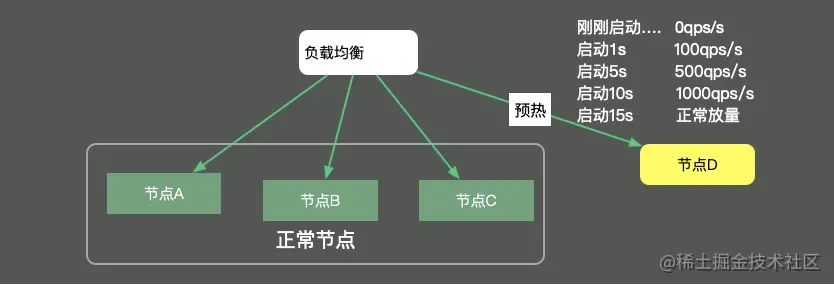
When it comes to preheating, we have to mention service preheating in a distributed environment. When publishing a service node, there is usually a warm-up process, and the volume is gradually increased to the corresponding service node until the service reaches the optimal state. As shown in the figure below, load balancing is responsible for this volume process, which is generally conducted according to the percentage.
@Measurement
An example is as follows.
@Measurement(
iterations = 5,
time = 1,
timeUnit = TimeUnit.SECONDS)
Copy code
 Copy code
The parameters of Measurement and Warmup are the same. Unlike preheating, it refers to the number of real iterations.
We can see the execution process from the log:
# Measurement: 5 iterations, 1 s each
Iteration   1: 1646.000 ns/op
Iteration   2: 1243.000 ns/op
Iteration   3: 1273.000 ns/op
Iteration   4: 1395.000 ns/op
Iteration   5: 1423.000 ns/op
 Copy code
 Copy code
Although the code can show its optimal state after preheating, it is still somewhat different from the actual application scenario. If the performance of your testing machine is very high, or your testing machine resource utilization has reached the limit, it will affect the value of the test results. Usually, I will give the machine sufficient resources to maintain a stable environment during testing. When analyzing the results, we also pay more attention to the performance differences of different implementation methods, rather than the test data itself.
@BenchmarkMode
This annotation is used to specify the benchmark type, corresponding to the Mode option, and can be used to modify both classes and methods. The value here is an array, and multiple statistical dimensions can be configured. For example:
@BenchmarkMode({Throughput,Mode.AverageTime}). The statistics are throughput and average execution time.
The so-called modes can be divided into the following types in JMH:
- Throughput: overall throughput, such as QPS, call volume per unit time, etc.
- Average time: average elapsed time, which refers to the average time of each execution. If this value is too small to be recognized, you can reduce the unit time of statistics.
- SampleTime: random sampling.
- SingleShotTime: if you want to test the performance only once, such as how long it takes for the first initialization, you can use this parameter. In fact, it is no different from the traditional main method.
- All: calculate all indicators. You can set this parameter to see the effect.
Let's take the average time to see a general implementation result:
Result "com.github.xjjdog.tuning.BenchmarkTest.shift":
  2.068 ±(99.9%) 0.038 ns/op [Average]
  (min, avg, max) = (2.059, 2.068, 2.083), stdev = 0.010
  CI (99.9%): [2.030, 2.106] (assumes normal distribution)
Copy code
 Copy code
Since the time unit we declare is nanoseconds, the average response time of this shift method is 2.068 nanoseconds.
We can also look at the final time-consuming.
Benchmark            Mode  Cnt  Score   Error  Units
BenchmarkTest.div    avgt    5  2.072 ± 0.053  ns/op
BenchmarkTest.shift  avgt    5  2.068 ± 0.038  ns/op
 Copy code
 Copy code
Since it is an average, the Error value here means Error (or fluctuation).
It can be seen that when measuring these indicators, there is a time dimension, which is configured through the * * @ OutputTimeUnit * * annotation.
This is relatively simple. It indicates the time type of benchmark results. Can be used on classes or methods. Generally choose seconds, milliseconds, microseconds and nanoseconds, which is a very fast method for.
For example, @ BenchmarkMode(Mode.Throughput) and @ OutputTimeUnit(TimeUnit.MILLISECONDS) are combined to represent the throughput per millisecond.
As shown below, the throughput is calculated in milliseconds.
Benchmark             Mode  Cnt       Score       Error   Units
BenchmarkTest.div    thrpt    5  482999.685 ±  6415.832  ops/ms
BenchmarkTest.shift  thrpt    5  480599.263 ± 20752.609  ops/ms
 Copy code
 Copy code
The OutputTimeUnit annotation can also modify classes or methods. By changing the time level, you can get more readable results.
@Fork
The value of fork is generally set to 1, which means that only one process is used for testing; If this number is greater than 1, it means that a new process will be enabled for testing; However, if it is set to 0, the program will still run, but it runs on the user's JVM process. You can see the following tips, but it is not recommended.
# Fork: N/A, test runs in the host VM
# *** WARNING: Non-forked runs may silently omit JVM options, mess up profilers, disable compiler hints, etc. ***
# *** WARNING: Use non-forked runs only for debugging purposes, not for actual performance runs. ***
Copy code
 Copy code
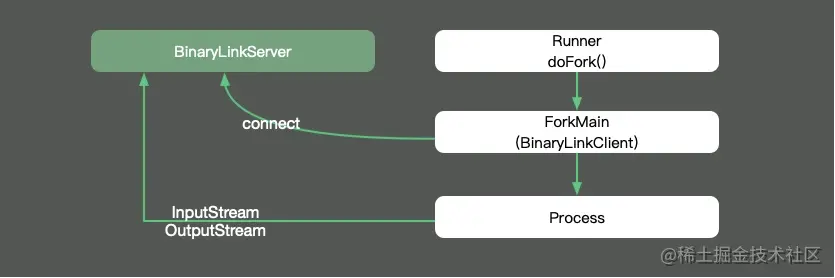
So does fork run in a process or thread environment? We trace the source code of JMH and find that each fork process runs separately in the progress process, so that we can completely isolate the environment and avoid cross impact. Its input and output streams are sent to our execution terminal through the Socket connection mode.
Share a tip here. In fact, the fork annotation has a parameter called jvmArgsAppend, through which we can pass some JVM parameters.
@Fork(value = 3, jvmArgsAppend = {"-Xmx2048m", "-server", "-XX:+AggressiveOpts"})
Copy code
 Copy code
In the ordinary test, the number of fork s can also be increased appropriately to reduce the test error.
@Threads
fork is process oriented, while Threads is thread oriented. When this annotation is specified, the parallel test will be started.
If threads is configured Max, the same number of threads as the number of processing machine cores is used.
@Group
@Group annotations can only be added to methods to classify test methods. If you have many methods in a single test file, or you need to classify them, you can use this annotation.
The associated @ GroupThreads annotation will set some thread settings based on this classification.
@State
@State specifies the scope of the variable in the class. It has three values.
@State is used to declare that a class is a "state", and the Scope parameter can be used to represent the shared range of the state. This annotation must be added to the class, otherwise the prompt cannot be run.
Scope has the following three values:
- Benchmark: indicates that the scope of the variable is a benchmark class.
- Thread: each thread has a copy. If Threads annotation is configured, each thread has a variable, which does not affect each other.
- Group: contact the @ group annotation above. In the same group, the same variable instance will be shared.
In the JMHSample04DefaultState test file, it is demonstrated that the default scope of variable x is Thread. The key codes are as follows:
@State(Scope.Thread)
public class JMHSample_04_DefaultState {
    double x = Math.PI;
    @Benchmark
    public void measure() {
        x++;
    }
}
Copy code
 Copy code
@Setup and @ TearDown
Similar to the unit test framework JUnit, @ TearDown is used for initialization before the benchmark and for post benchmark actions to make some global configurations.
These two annotations also have a Level value, indicating the operation time of the method. It has three values.
- Trial: the default level. That is, the Benchmark level.
- Iteration: each iteration runs.
- Invocation: each method call will run, which is the most granular.
@Param
@Param annotation can only modify fields to test the impact of different parameters on program performance. With the @ State annotation, you can set the execution range of these parameters at the same time.
The code example is as follows:
@BenchmarkMode(Mode.AverageTime)
@OutputTimeUnit(TimeUnit.NANOSECONDS)
@Warmup(iterations = 5, time = 1, timeUnit = TimeUnit.SECONDS)
@Measurement(iterations = 5, time = 1, timeUnit = TimeUnit.SECONDS)
@Fork(1)
@State(Scope.Benchmark)
public class JMHSample_27_Params {
@Param({"1", "31", "65", "101", "103"})
public int arg;
@Param({"0", "1", "2", "4", "8", "16", "32"})
public int certainty;
@Benchmark
public boolean bench() {
return BigInteger.valueOf(arg).isProbablePrime(certainty);
}
public static void main(String[] args) throws RunnerException {
Options opt = new OptionsBuilder()
.include(JMHSample_27_Params.class.getSimpleName())
// .param("arg", "41", "42") // Use this to selectively constrain/override parameters
.build();
new Runner(opt).run();
}
}
Copy code
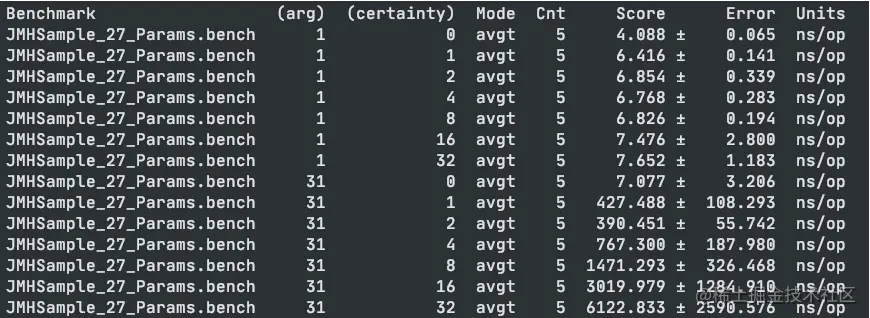
Copy codeIt is worth noting that if you set a lot of parameters, these parameters will be executed many times, usually for a long time. For example, if there are 1 M parameters and 2 N parameters, a total of M*N times will be executed.
The following is a screenshot of the execution result.
@CompilerControl
This can be said to be a very useful function.
The overhead of method calls in Java is relatively large, especially when the number of calls is very large. Take the simple getter/setter method, which exists in a large number in Java code. When accessing, we need to create the corresponding stack frame. After accessing the required fields, we pop up the stack frame to restore the execution of the original program.
If the access and operation of these objects can be included in the call scope of the target method, there will be less method call and the speed will be improved. This is the concept of method inlining. As shown in the figure, the efficiency will be greatly improved after the code is JIT compiled.
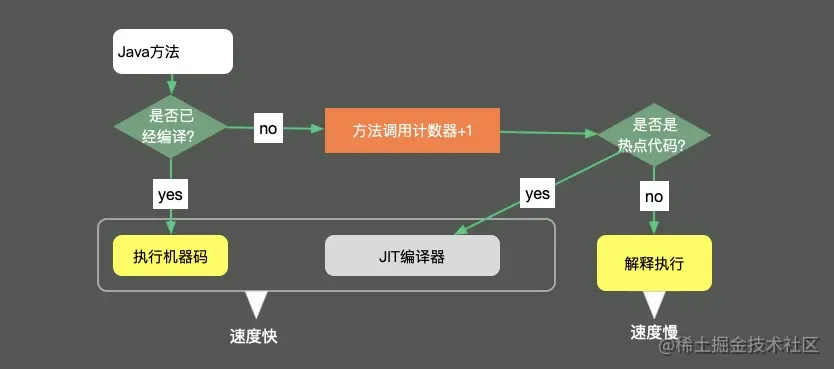
This annotation can be used on classes or methods to control the compilation behavior of methods. There are three common modes.
Force the use of INLINE, prohibit the use of INLINE, and even prohibit method compilation (EXCLUDE).
2. Graphical results
The results of JMH test can be processed twice and displayed graphically. Combined with chart data, it is more intuitive. By specifying the output format file at runtime, you can obtain the performance test results in the corresponding format.
For example, the following line of code specifies to output data in JSON format.
Options opt = new OptionsBuilder()
    .resultFormat(ResultFormatType.JSON)
    .build();
Copy code
 Copy code
JMH supports results in the following five formats:
- TEXT exports a TEXT file.
- csv export csv format file.
- scsv exports files in formats such as scsv.
- json is exported as a json file.
- latex export to latex, a method based on ΤΕΧ Typesetting system.
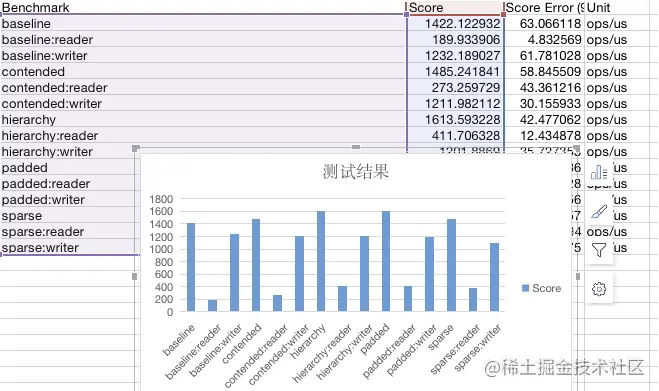
Generally speaking, we can export to CSV file, operate directly in Excel and generate corresponding graphics.
In addition, several tools for drawing are introduced:
JMH Visualizer has an open source project here( jmh.morethan.io/) , by exporting json files, you can get simple statistical results after uploading. Personally, I don't think its display is very good.
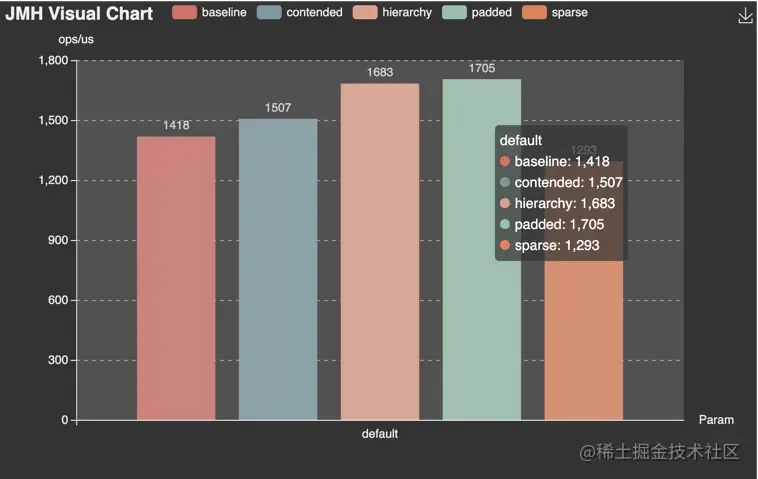
jmh-visual-chart
In comparison, the following tool( deepoove.com/jmh-visual-... , it is relatively intuitive.
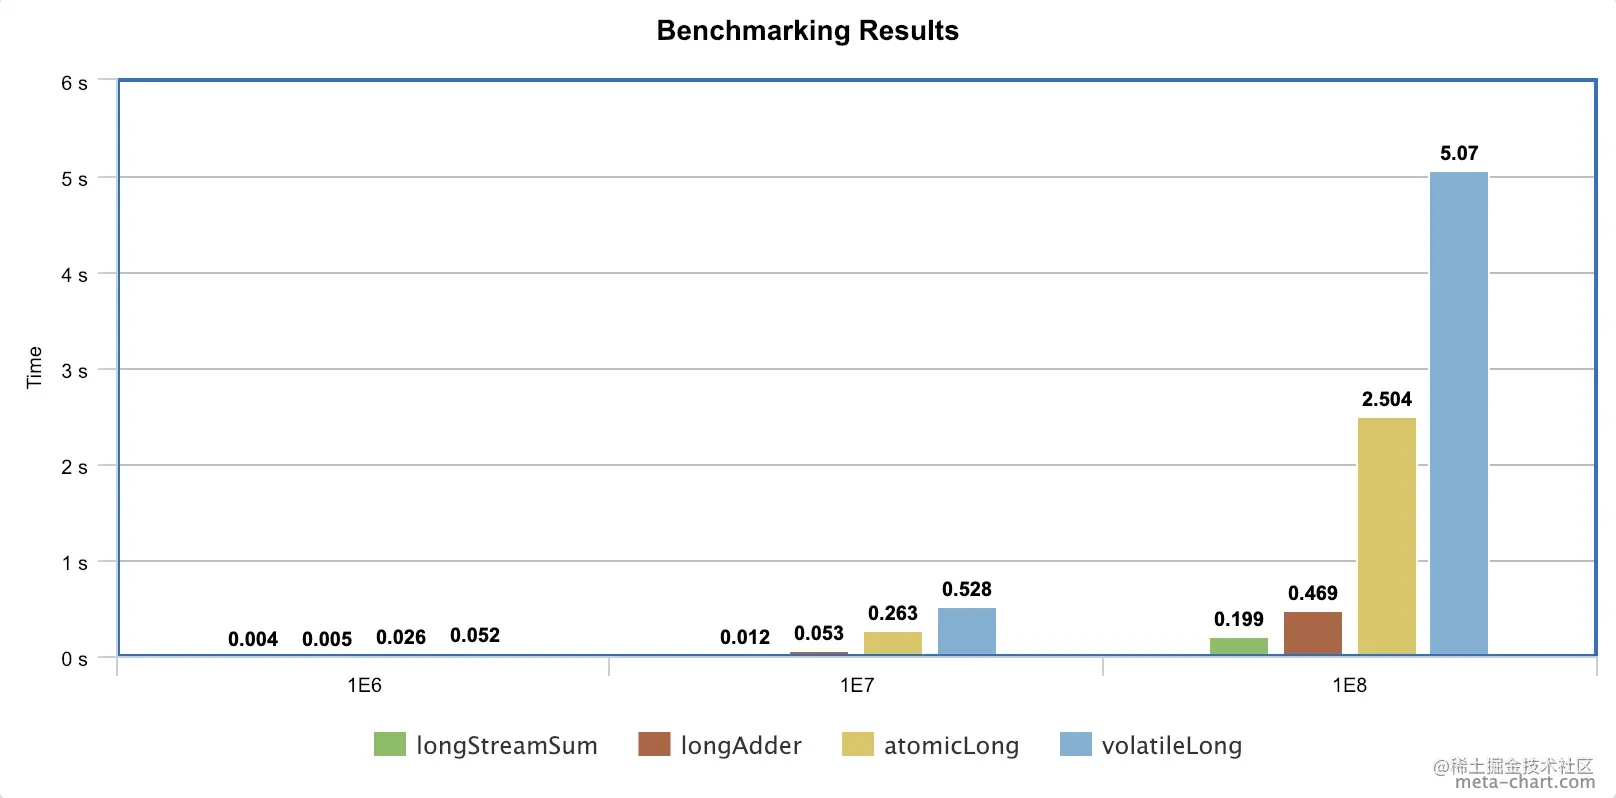
meta-chart
A general online chart generator. ( www.meta-chart.com /), after exporting the CSV file
Some continuous integration tools such as Jenkins also provide corresponding plug-ins to directly display these test results.
END
This tool is very easy to use. It uses exact test data to support our analysis results. In general, if you locate hot code, you need to use benchmarking tools for special optimization until the performance has been significantly improved.
In our scenario, we found that using NanoID is indeed much faster than UUID.
Author: little sister taste
Link: juejin.cn/post/703100...