brief introduction
With the increase of servers and network devices in the computer room, log management and query become a headache for system administrators.
Common problems encountered by system administrators are as follows:
- It is impossible to log in to each server and device to view the log during daily maintenance;
- The storage space on the network device is limited, so it is impossible to store the log with too long date, and the system problems may be caused by some operations that happened a long time ago;
- In some cases of illegal invasion, the intruder will generally clear the local log and clear the invasion trace;
- zabbix and other monitoring systems cannot replace log management, and cannot monitor such projects as system login, scheduled task execution, etc.
Based on the above reasons, it is necessary to build a Rsyslog log log server for centralized log management in the current network environment.
The advantages of Rsyslog service are as follows:
- Rsyslog server can be supported by most network devices, and most of the system device options of network devices have the configuration options of remote log service. Just fill in the IP address and port (most devices are 514 by default), and then confirm;
- Linux server only needs to add a simple line in the local Rsyslog service configuration to send logs to the log server, which is very simple to deploy and configure;
Deployment framework
Deployment framework
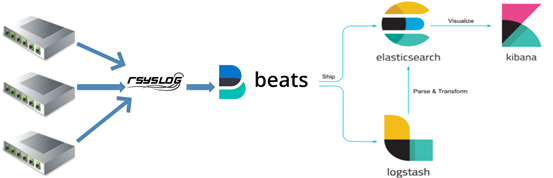
Rsyslog configuration
System environment and software version:
CentOS Linux release 7.5.1804 (Core)
Elasticserch-6.8.4
Kibana-6.8.4
Logstash-6.8.4
Filebeat-6.8.4
Rsyslog-8.24.0
Set SELINUX to disabled
# setenforce 0
# sed -i 's#SELINUX=enforcing#SELINUX=disabled#g' /etc/selinux/config
Firewall configuration
firewall-cmd  --add-service=syslog --permanent
firewall-cmd  --reload
Check whether rsyslog software is installed
#CentOS7 will install rsyslog by default
[root@ZABBIX-Server ~]# rpm -qa |grep rsyslog
rsyslog-8.24.0-16.el7.x86_64
Edit rsyslog configuration file
vim /etc/rsyslog.conf? Change as follows
[root@ZABBIX-Server mnt]# egrep -v "*#|^$" /etc/rsyslog.conf
$ModLoad imudp
$UDPServerRun 514
$ModLoad imtcp
$InputTCPServerRun 514
$WorkDirectory /var/lib/rsyslog
$ActionFileDefaultTemplate RSYSLOG_TraditionalFileFormat
$IncludeConfig /etc/rsyslog.d/*.conf
$OmitLocalLogging on
$IMJournalStateFile imjournal.state
*.info;mail.none;authpriv.none;cron.none;local6.none;local5.none;local4.none                /var/log/messages
$template h3c,"/mnt/h3c/%FROMHOST-IP%.log"
local6.* ?h3c
$template huawei,"/mnt/huawei/%FROMHOST-IP%.log"
local5.* ?huawei
$template cisco,"/mnt/cisco/%FROMHOST-IP%.log"
local4.* ?cisco
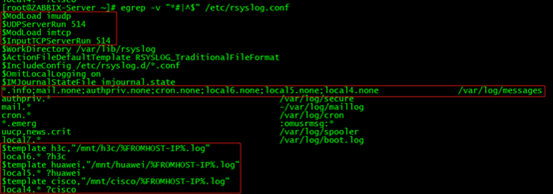
$ModLoad imudp            # immark is the module name and supports tcp protocol
$ModLoad imudp             # imupd is the module name, supporting udp protocol
$InputTCPServerRun 514
$UDPServerRun 514          #Allow port 514 to receive logs forwarded using UDP and TCP protocols
Be careful:
*.info;mail.none;authpriv.none;cron.none;local6.none;local5.none;local4.none         /var/log/messages
 By default, the command local6.none;local5.none;local4.none is not added. When the network log is written to the corresponding file, it will be written to / var/log/messages
Check rsyslog service

Restart rsyslog service
systemctl restart rsyslog.service
Log storage directory
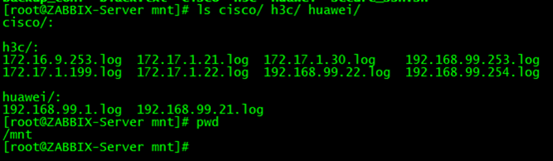
The network device points the log to the syslog server. Note that the local corresponding to the devices of different manufacturers is different. The corresponding relationship is as follows:
/mnt/huawei   --- local6
/mnt/h3c      --- local5
/mnt/cisco     --- local4
Network device configuration
Huawei:
info-center loghost source Vlanif99
info-center loghost 192.168.99.50 facility local5

H3C:
info-center loghost source Vlan-interface99
info-center loghost 192.168.99.50 facility local6

CISCO:
(config)#logging on
(config)#logging 192.168.99.50
(config)#logging facility local4
(config)#logging source-interface e0

Ruijie:
logging buffered warnings
logging source interface VLAN 99
logging facility local6
logging server 192.168.99.50
Note: 192.168.99.50 is the IP address of rsyslog server
Edit filebeat profile
Collect log files under rsyslog to logstash
[root@ZABBIX-Server mnt]# egrep -v "^#|^$" /etc/filebeat/filebeat.yml
filebeat.inputs:
- type: log
  enabled: true
  paths:
    - /mnt/huawei/*
  tags: ["huawei"]
  include_lines: ['Failed','failed','error','ERROR','\bDOWN\b','\bdown\b','\bUP\b','\bup\b']
  drop_fields:
    fields: ["beat","input_type","source","offset","prospector"]
- type: log
  paths:
    - /mnt/h3c/*
  tags: ["h3c"]
  include_lines: ['Failed','failed','error','ERROR','\bDOWN\b','\bdown\b','\bUP\b','\bup\b']
  drop_fields:
    fields: ["beat","input_type","source","offset","prospector"]
setup.template.settings:
  index.number_of_shards: 3
output.logstash:
  hosts: ["192.168.99.185:5044"]
processors:
  - add_host_metadata: ~
  - add_cloud_metadata: ~
Edit logstash profile
The logs sent from filebeat are processed according to different tags, and the processed log data is transferred to es for storage, and further visual display is made on kibana
[root@elk-node1 ~]# egrep -v "^#|^$" /etc/logstash/conf.d/networklog.conf
input {
  beats {
    port => 5044
  }

}
filter {
  if "huawei" in [tags] {
    grok{
      match => {"message" => "%{SYSLOGTIMESTAMP:time} %{DATA:hostname} %{GREEDYDATA:info}"}
        }
  }
   else if "h3c" in [tags] {
    grok{
      match => {"message" => "%{SYSLOGTIMESTAMP:time} %{YEAR:year} %{DATA:hostname} %{GREEDYDATA:info}"}
        }
  }
mutate {
      remove_field => ["message","time","year","offset","tags","path","host","@version","[log]","[prospector]","[beat]","[input][type]","[source]"]
    }
}
output{
stdout {codec => rubydebug}
elasticsearch {
    index => "networklogs-%{+YYYY.MM.dd}"
    hosts => ["192.168.99.185:9200"]
    sniffing => false
    }
}
Visual configuration on kibana
Create an index pattern matching the stored network device log index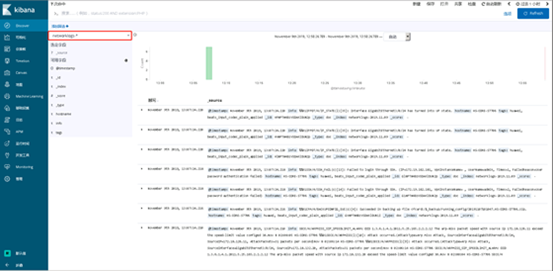
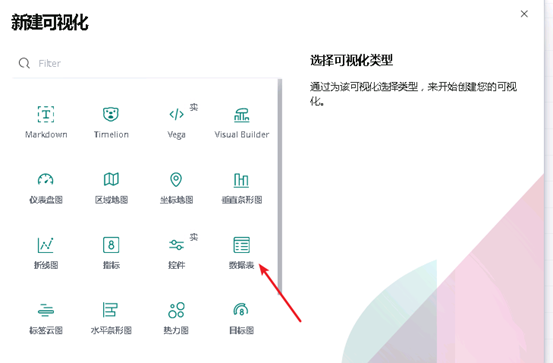
Create a data table
kibana's data table can be exported to a CSV file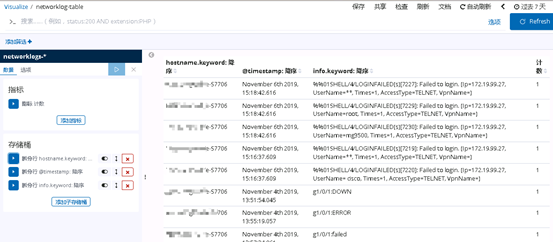
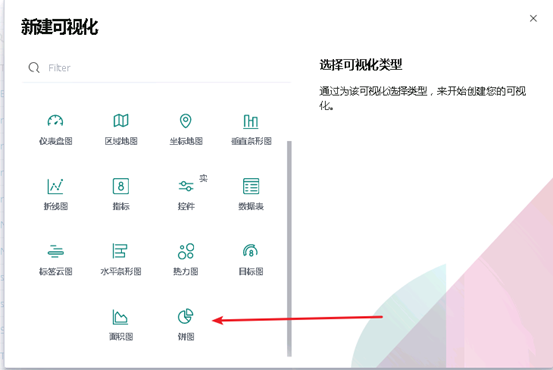
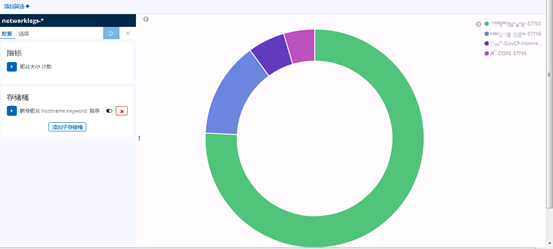
Create a pie chart
Welcome to pay attention to personal company name "master Chen without story"