Because of the need of the project, I am looking for some articles about drawing real-time curves recently, but I have seen a lot of my own implementations are too slow, so I use third-party controls to implement them (because it is used in the project, so I prefer to work with open source projects, if something goes wrong, I can find the root cause very well). The record here is for me to review in the future, and also for like-minded apes to reduce search time.
Next, we will introduce the function of real-time graph in DynamicData Display (there is no other time to study), because similar configuration articles can be found online.
First, we need to download DLL (or directly NuGet) from the official website. DynamicDataDisplay Find the required DynamicDataDisplay.dll and reference it in the project
Then configure the namespace xmlns:d3="http://research.microsoft.com/DynamicDataDisplay/1.0" in the project, and add <d3:ChartPlotter> basic configuration problem in the content.
Real-time display of CPU usage, the api used by CPU can be found by itself, I will not explain here.
Next, let's paste the code directly.
The MainWindow.xaml file is as follows:
<Window xmlns:dxga="http://schemas.devexpress.com/winfx/2008/xaml/gauges"

        xmlns="http://schemas.microsoft.com/winfx/2006/xaml/presentation"

        xmlns:x="http://schemas.microsoft.com/winfx/2006/xaml"

        x:Class="LinechartApplication.MainWindow"

        Title="MainWindow" Height="400" Width="650"

        xmlns:d3="http://research.microsoft.com/DynamicDataDisplay/1.0" Loaded="Window_Loaded">

    <Grid>

        <Grid.RowDefinitions>

            <RowDefinition Height="Auto"/>

            <RowDefinition Height="*"/>

        </Grid.RowDefinitions>

        <StackPanel Orientation="Horizontal">

            <Button Content="Rolling screen or No rolling screen"  Click="Button_Click"/>

        </StackPanel>

        <d3:ChartPlotter x:Name="plotter" Margin="10,10,20,10" Grid.Row="1">

            <d3:ChartPlotter.VerticalAxis>

                <d3:VerticalIntegerAxis />

            </d3:ChartPlotter.VerticalAxis>


            <d3:ChartPlotter.HorizontalAxis>

                <d3:HorizontalIntegerAxis />

            </d3:ChartPlotter.HorizontalAxis>


            <d3:Header Content="CPU real-time performance"/>

            <d3:VerticalAxisTitle Content="Percentage"/>

        </d3:ChartPlotter>

    </Grid>

</Window>
using System;

using System.Globalization;

using System.IO;

using System.Reflection;

using System.Threading;

using System.Windows;

using System.Diagnostics;

using System.Windows.Threading;

using System.Windows.Media;

using Microsoft.Research.DynamicDataDisplay;

using Microsoft.Research.DynamicDataDisplay.DataSources;

using System.Collections;


namespace LinechartApplication

{

    /// <summary>

    /// Interaction logic of MainWindow.xaml

    /// </summary>

    public partial class MainWindow : Window

    {


        private ObservableDataSource<Point> dataSource = new ObservableDataSource<Point>();

        private PerformanceCounter performanceCounter = new PerformanceCounter();

        private DispatcherTimer dispatcherTimer = new DispatcherTimer();

        private int currentSecond = 0;


        bool buttonbool = false;//Does the logo scroll?

        public MainWindow()

        {

            InitializeComponent();


        }


        private void Window_Loaded(object sender, RoutedEventArgs e)

        {

            plotter.AddLineGraph(dataSource, Colors.Red, 2, "Percentage");

            plotter.LegendVisible = true;

            dispatcherTimer.Interval = TimeSpan.FromSeconds(1);

            dispatcherTimer.Tick += timer_Tick;

            dispatcherTimer.IsEnabled = true;

            plotter.Viewport.FitToView();

        }


        int xaxis = 0;

        int yaxis = 0;

        int group = 20;//Default group distance


        Queue q = new Queue();

        private void timer_Tick(object sender, EventArgs e)

        {

            performanceCounter.CategoryName = "Processor";

            performanceCounter.CounterName = "% Processor Time";

            performanceCounter.InstanceName = "_Total";

            double x = currentSecond;

            double y = performanceCounter.NextValue();

            Point point = new Point(x, y);

            dataSource.AppendAsync(base.Dispatcher, point);

            if (wendu)

            {

                if (q.Count < group)

                {

                    q.Enqueue((int)y);//Join the team

                    yaxis  = 0;

                    foreach (int c in q)

                        if (c > yaxis)

                            yaxis = c;

                }

                else {

                    q.Dequeue();//Team out

                    q.Enqueue((int)y);//Join the team

                    yaxis = 0;

                    foreach (int c in q)

                        if (c > yaxis)

                            yaxis = c;

                }


                if (currentSecond - group > 0)

                    xaxis = currentSecond - group;

                else

                    xaxis = 0;


                Debug.Write("{0}\n", yaxis.ToString());

                plotter.Viewport.Visible = new System.Windows.Rect(xaxis, 0, group, yaxis);//Pay attention to this line.

            }

            currentSecond++;

        }


        private void Button_Click(object sender, RoutedEventArgs e)

        {

            if (wendu)

            {

                wendu = false;

            }

            else {

                wendu = true;

            }

        }

    }

}
DynamicData Display has many functions for real-time display of curves, but it can't see the x-axis moving, so here's the main content (how to move along the x-axis)
When I use DynamicData Display, I find that there will be image scaling (that is, the x-axis has been scaled, all the data will be compressed together, very inconvenient). Use plotter.Viewport.Visible = new System.Windows.Rect(xaxis, 0, group, yaxis); this line of code solves the function of moving along the X axis. This is like a window, we define the location and size of the window to see the data we need. The first and second parameters are origin coordinates, the third parameter is X-axis length, and the fourth parameter is Y-length. Once defined, all the contents in this range will be displayed, and the redundant parameters will not be displayed. As the window moves, it is also the function of X-axis movement.
In the code, using queues, the length of the queue is equal to the length of the display window, that is, the length of the X axis. The role of a queue is to determine the height of the window by taking the maximum value in the queue.
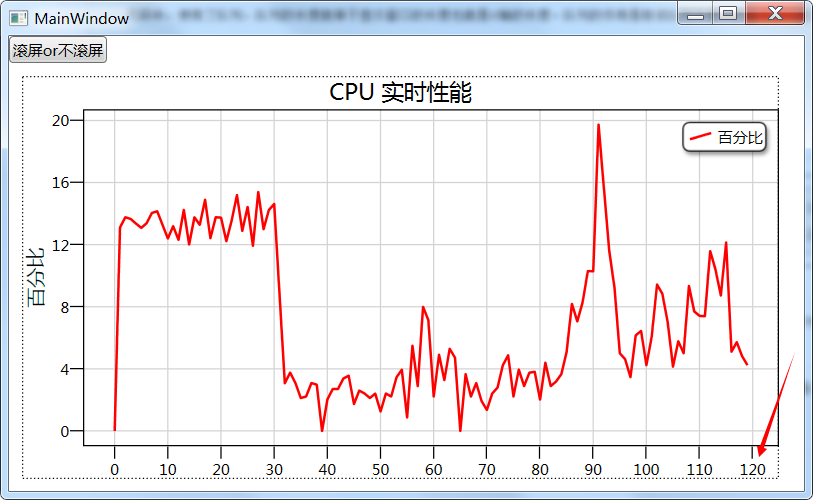
Images without scrolling (we can see that the X-axis is squeezed together)
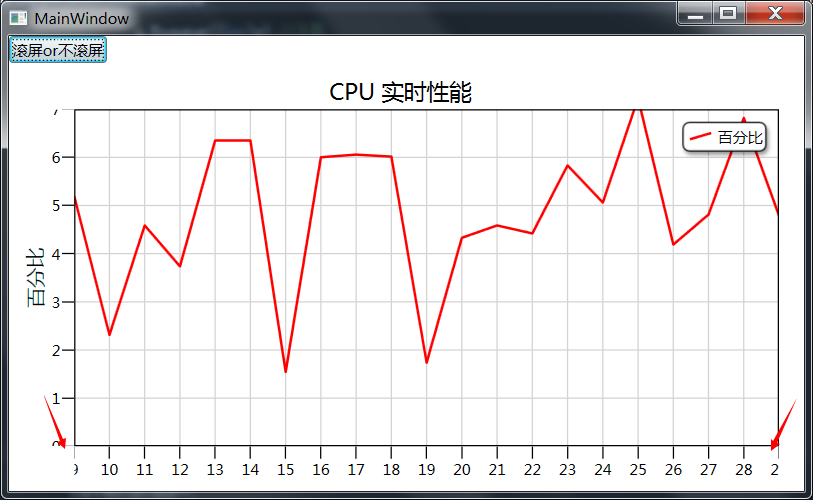
Rolling screen
Resources Download http://download.csdn.net/detail/u013187531/9842653