The first troubleshooting methods we contact are DEBUG and abnormal error reporting, which can solve most of the problems during our development. But sometimes the problems are not our code problems, and locating these problems requires the tools provided by the jvm.
Troubleshooting tools
jstack
introduce
jstack command tool can get thread stack information for easy analysis.
What's the usage?
- Deadlock can be detected
- Analyze the status of the thread and observe that there is a block
usage method
Pre knowledge
Status of threads in jstack:
- New creates a new thread object.
- After the runnable thread object is created, other threads call the start() method of the object. It is divided into ready state and running state
- Blocked (blocked state) a blocked state is when a thread gives up CPU usage for some reason and temporarily stops running. Until the thread enters the ready state, it has no chance to go to the running state.
- A waiting thread is in a waiting state, which means that it needs to wait for instructions from other threads to continue running
- TIMED_ Waiting (timeout wait state) the thread will enter this state when it calls sleep(time), wait, join, parkNanos and parkUntil. The difference from the waiting state: after the timeout, it automatically enters the blocking queue and starts competing for locks.
- Terminated (terminated) the state of a thread after its execution has ended.
Key information that appears in the jstack log
- Deadlock: indicates a deadlock
- Wait on condition: wait for a resource or condition to occur to wake yourself up.
- Blocked: blocked
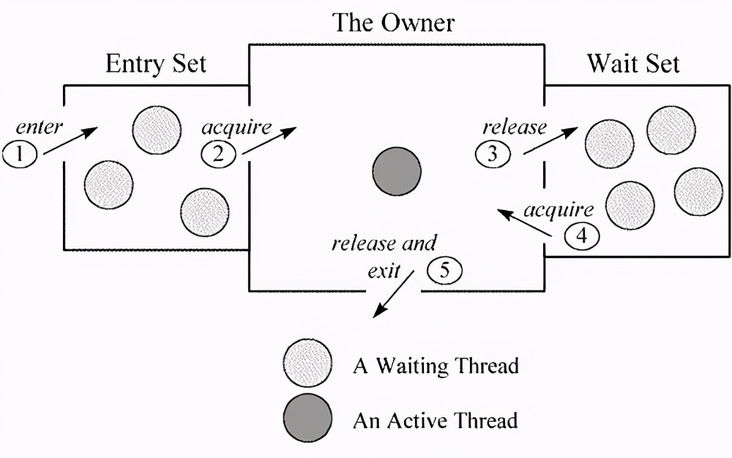
- Waiting on monitor entry: waiting to acquire the lock (it means that this thread enters the critical area through the synchronized(obj) {...} application, thus entering the "Entry Set" queue in Figure 1, but the monitor corresponding to this obj is owned by other threads, so this thread waits in the Entry Set queue.)
- in Object.wait(): execute obj after obtaining the lock Wait() discards the lock
- TIMED_ Timed in waiting (parking) "_ Waiting refers to the waiting state, but the time is specified here. When the specified time is reached, it will automatically exit the waiting state; Parking means that the thread is suspended.
- Waiting to lock < 0x00000000acf4d0c0 > "means that the thread is waiting to lock the 0x00000000acf4d0c0 address (if you can find who has obtained the lock in the log (for example, locked < 0x00000000acf4d0c0 >), you can follow the steps)
Log sample
import java.util.concurrent.TimeUnit;

public class MainThread {
 public static void main(String[] args) {
     final Thread thread2 = new Thread(){
       public void run(){
           synchronized (this){
               try{
                   System.out.println(Thread.currentThread());
                   TimeUnit.SECONDS.sleep(60);
               }catch (InterruptedException e){
                   e.printStackTrace();
               }
           }
       }
     };
     thread2.setName("thread2");
     thread2.start();

     synchronized (thread2){
         try{
             System.out.println(Thread.currentThread());
             TimeUnit.SECONDS.sleep(60);
         } catch (InterruptedException e) {
             e.printStackTrace();
         }
     }
 }
}
"main" #1 prio=5 os_prio=0 cpu=93.75ms elapsed=30.25s tid=0x0000027193f7e290 nid=0x4d00 waiting on condition  [0x000000fe36fff000]
   java.lang.Thread.State: TIMED_WAITING (sleeping)
        at java.lang.Thread.sleep(java.base@17/Native Method)
        at java.lang.Thread.sleep(java.base@17/Thread.java:337)
        at java.util.concurrent.TimeUnit.sleep(java.base@17/TimeUnit.java:446)
        at com.leecode.test.MainThread.main(MainThread.java:25)
        - locked <0x0000000711ae4be8> (a com.leecode.test.MainThread$1)

   Locked ownable synchronizers:
        - None

"thread2" #16 prio=5 os_prio=0 cpu=0.00ms elapsed=30.16s tid=0x00000271b7e8e020 nid=0x534c waiting for monitor entry  [0x000000fe383ff000]
   java.lang.Thread.State: BLOCKED (on object monitor)
        at com.leecode.test.MainThread$1.run(MainThread.java:11)
        - waiting to lock <0x0000000711ae4be8> (a com.leecode.test.MainThread$1)

   Locked ownable synchronizers:
        - None
    - "thread2"Is the thread name. When creating a thread or thread pool, be sure to take a clear thread name to facilitate troubleshooting;
    - prio=5: Thread priority, don't care;
    - tid=0x00000271b7e8e020: thread  id,Don't care;
    - nid=0x534c: Operating system mapped threads id, It's very critical. We'll use it later jstack Supplement when necessary;
    - waiting for monitor entry: Indicates that the thread is waiting to acquire a lock
    - 0x000000fe383ff000: Thread stack start address
analysis:
    The main thread got thread2 Object, so it is executing sleep Operation, status is TIMED_WAINTING, and thread2 Because no thread2 Object, so it is in BLOCKED Status.
    thread2 Is"waiting to lock <0x0000000711ae4be8>",That is, an attempt was made at address 0 x0000000711ae4be8 The object in which it is located acquires a lock, and the lock is locked main Thread occupancy( locked <0x0000000711ae4be8>). main Thread is"waiting on condition",Description: waiting for a condition to trigger, by jstacktrace Look, this thread is sleep.
Linux troubleshooting command:
- top command: check which process uses too much CPU. Locate to pid
- top -Hp pid command: view the threads in the problem process.
- jstack pid | grep nid -C10: check the status information of the corresponding thread in the first and last 10 lines (note that first use printf '%x\n' nid or other methods to convert decimal nid to hexadecimal nid)
Online positioning (Arthas tool)
Arthas is an open source Java diagnostic tool of Alibaba.
- First download Arthas boot Jar package, which is started directly through the java jar command. Then, it will list all running java processes, let the user select the processes to be monitored, and then enter the operation interface of Arthas
- Enter the dashboard command in the operation interface to see all thread information (thread ID, name, status, CPU occupation, memory occupation, whether it is a daemon thread, etc.), memory information (heap memory, Eden area, Survivor area, old age, method area), and machine conditions of the monitored process.
- You can view all System Properties information through the sysporp command.
- You can view all environment variable information through the sysenv command.
- JVM command to view the JVM parameters used by the current process.
- After knowing the thread id, you can use thread thread_id to view the stack information being executed by a thread.
- You can view the information of the loaded classes through the sc command.
- All functions of the class can be obtained by sm class name. Adding - d can obtain detailed function information or specify to view a function
- The code can be decompiled through the jad command. This function can help us see what kind of class is generated by the dynamic agent (for example, locate a class through sc + wildcard, and then decompile the code of this class through the jad command)
- You can view the parameter / return value / exception information of the current function through the watch command
- The ognl command is used to execute code dynamically and execute code in the current thread environment. ( ognl '@java.lang.System@out.println("hello ognl")')
- Use redefine / path / xxx Class, which can reload the compiled classes. It is usually convenient to realize some thermal repair. In fact, it is the same as the hot deployment principle of tomcat in IDEA, that is, reload the modified classes with ClasssLoader.