Use tools to understand global information (awr, awrdd, addm and other reports)
AWR report is often the most famous tool for overall analysis of oracle. Few people may use other reports. Although the AWR report information is detailed, if it is not for deep experience, some difficult and miscellaneous diseases may not be located quickly by relying on AWR alone. The same tools include ASH, ADDM, AWRDD, AWRSQRPT, etc., which can get twice the result with half the effort. In practice, of course, we should not only focus on tool reports, but also consider the system, network and storage.
Briefly summarize the functions of these tools:
| tool | Function Outline |
|---|---|
| AWR | Collect, process and maintain performance statistics for problem diagnosis (overall situation) |
| AWRDD | Performance comparison in different periods |
| ASH | The waiting events corresponding to sql are more accurate |
| ADDM | Give suggestions according to the operation |
| AWRSQRPT | According to sql_id get execution plan details |
1.AWR
AWR (Automatic Workload Repository) report is an important means for our daily database performance evaluation and SQL problem discovery.
AWR is essentially an Oracle built-in tool that collects performance related statistics and derives performance energy from those statistics to track potential problems. Snapshots are automatically collected hourly by a background process called MMON and its slave processes. In order to save space, the collected data is automatically cleared after 7 days. The snapshot frequency and retention time can be modified by the user. It produces two types of output: text format and default HTML format, providing a very user-friendly report.
AWR uses several tables to store the collected statistics. All tables are stored in the SYS mode in the specific table space of SYSAUX and are named in the format of WRM $* and WRH $*. The former type stores metadata information (such as checked databases and collected snapshots), and the latter type saves the actually collected statistics. H stands for "historical" and M stands for "metadata". Several prefixed DBAs were built on these tables_ HIST_ Views that can be used to write your own performance diagnostic tools. The name of the view is directly related to the table; For example, view DBA_HIST_SYSMETRIC_SUMMARY is in WRH$_ SYSMETRIC_ Built on the summary table.
There are two ways to obtain AWR reports. One is to obtain them directly by calling the background script awrrpt SQL. The execution method is generally executed under sqlplus @/ rdbms/admin/awrrpt.sql, and the other is to obtain DBMS by calling the command package_ workload_ The AWR of the repository package_ report_ HTML program, output content in the form of SQL commands.
Do you usually call @/ rdbms/admin/awrrpt.sql (that is, $ORACLE_HOME/rdbms/admin/awrrpt.sql) script generates html files
1.1 generate awr Report
Generated in sqlplus
connection to:
Oracle Database 19c Enterprise Edition Release 19.0.0.0.0 - Production
Version 19.3.0.0.0

SQL>@?/rdbms/admin/awrrpt.sql

Specify the Report Type
~~~~~~~~~~~~~~~~~~~~~~~
AWR reports can be generated in the following formats.  Please enter the
name of the format at the prompt.  Default value is 'html'.

'html'          HTML format (default)
'text'          Text format
'active-html'   Includes Performance Hub active report

input report_type Value of:	#Enter, default html
........
........
Specify the number of days of snapshots to choose from
~~~~~~~~~~~~~~~~~~~~~~~~~~~~~~~~~~~~~~~~~~~~~~~~~~~~~~
Entering the number of days (n) will result in the most recent
(n) days of snapshots being listed.  Pressing <return> without
specifying a number lists all completed snapshots.

#Enter the number of days. If you do not enter the default, press enter to list all snapshots
 input num_days Value of:1

#Interception time period. In the interception time period, the instance must not be shut down
Listing the last day's Completed Snapshots
Instance     DB Name      Snap Id       Snap Started    Snap Level
------------ ------------ ---------- ------------------ ----------

orcl         ORCL                53  17 1 September 2022:55   1
                                 54  17 1 November 2022:00   1
                                 55  17 1 December 2022:00   1
                                 56  17 1 February 13, 2022:00   1
                                 57  17 1 February 14, 2022:00   1
                                 58  17 1 February 15, 2022:00   1
                                 59  17 1 February 16, 2022:00   1
                                 60  17 1 February 17, 2022:02   1


Specify the Begin and End Snapshot Ids
~~~~~~~~~~~~~~~~~~~~~~~~~~~~~~~~~~~~~~
input begin_snap Value of:  53
Begin Snapshot Id specified: 53

input end_snap Value of:  55
End   Snapshot Id specified: 55


Specify the Report Name
~~~~~~~~~~~~~~~~~~~~~~~
The default report file name is awrrpt_1_53_55.html.  To use this name,
press <return> to continue, otherwise enter an alternative.

##awr output position
 input report_name Value of:  /tmp/test_awr.html
........
Report written to /tmp/test_awr.html
plsql client generation
select * from sys.wrh$_active_session_history order by snap_id desc;


   SELECT *  FROM TABLE( dbms_workload_repository.awr_report_html(
   (select dbid
   from v$database), 1,
   56896,  -- begin  snap_id Like at 8 a.m snap_id
   56897  --end snap_id Like at 5 p.m snap_id
    ));


#Expand all the viewing results, COPY them, save them to txt file, and modify the suffix to html to generate AWR report.
1.2 awr saving strategy
awr generates snapshots every hour by default, because snapshots are automatically collected every hour by a new background process called MMON and its slave processes
View current awr save policy
set linesize 250
col SNAP_INTERVAL format a20
col RETENTION format a20
SQL> select * from dba_hist_wr_control;

      DBID SNAP_INTERVAL        RETENTION            TOPNSQL        CON_ID   SRC_DBID SRC_DBNAME
---------- -------------------- -------------------- ---------- ---------- ---------- --------------------------------------------------------------------------------------------------------------------------------
1620367844 +00000 01:00:00.0    +00008 00:00:00.0    DEFAULT             0 1620367844 CDB$ROOT

#That is, one snapshot per hour for 8 days (generally 7 or 8 days, 7 days for 10g and 8 days for 11g)
1.2.1 adjust awr strategy
Adjust the frequency and retention policy of snapshot s generated by AWR, such as changing the collection interval to once every 15 minutes. And keep it for 10 days (all in minutes):
SQL> exec dbms_workload_repository.modify_snapshot_settings(interval=>15, retention=>10*24*60);
1.2.2 close awr
Set interval to 0 to turn off automatic snapshot capture
SQL> exec dbms_workload_repository.modify_snapshot_settings(interval=>0);
1.2.3 manually generating snapshots
The frequency of awr is too low. It is generated manually when a problem occurs to assist in problem analysis
SQL> exec DBMS_WORKLOAD_REPOSITORY.CREATE_SNAPSHOT();
1.2.4 manually delete snapshots in the specified range
SQL> exec DBMS_WORKLOAD_REPOSITORY.DROP_SNAPSHOT_RANGE(low_snap_id => 55, high_snap_id => 60, dbid => 2754187159);
1.2.5 create a baseline and save these data for future analysis and comparison
SQL> exec dbms_workload_repository.create_baseline(start_snap_id => 1000, end_snap_id => 1010, 'apply_interest_1');
1.2.6 view baseline
SQL> select dbid,baseline_id,baseline_name,start_snap_id,end_snap_id from dba_hist_baseline;
1.2.7 delete baseline
SQL> exec DBMS_WORKLOAD_REPOSITORY.DROP_BASELINE(baseline_name => 'apply_interest_1', cascade => FALSE);
1.2.8 export and migrate AWR data to other databases for later analysis
SQL> exec DBMS_SWRF_INTERNAL.AWR_EXTRACT(dmpfile => 'awr_data.dmp', mpdir => 'DIR_BDUMP', bid => 1000, eid => 1010);
1.2.9 migrating AWR data files to other databases
SQL> exec DBMS_SWRF_INTERNAL.AWR_LOAD(SCHNAME => 'AWR_TEST', dmpfile => 'awr_data.dmp', dmpdir => 'DIR_BDUMP');
Transfer AWR data to SYS mode:
SQL> exec DBMS_SWRF_INTERNAL.MOVE_TO_AWR (SCHNAME => 'TEST');
1.2.10 AWR report shows TOP 50 SQL
exec DBMS_WORKLOAD_REPOSITORY.AWR_SET_REPORT_THRESHOLDS(top_n_sql=>50);
2.ASH
Starting from Oracle 10g, Oracle introduced a new ASH feature, namely Active Session History (ASH).
ASH is based on v$session and samples every second to record the events waiting for the active session. Because recording the activity of all sessions is very expensive,
Therefore, inactive sessions are not sampled. The sampling work is completed by a background process MMNL newly introduced by Oracle 10g
Get ash Report
···ash can also be generated by calling packages
#Also, @? In sqlplus/ rdbms/admin/ashrpt.sql is enough

connection to:
Oracle Database 19c Enterprise Edition Release 19.0.0.0.0 - Production
Version 19.3.0.0.0

SQL> @?/rdbms/admin/ashrpt.sql
Specify the Report Type
~~~~~~~~~~~~~~~~~~~~~~~
Enter 'html' for an HTML report, or 'text' for plain text
Defaults to 'html'
input report_type Value of:		#Default html
......

Specify the timeframe to generate the ASH report
~~~~~~~~~~~~~~~~~~~~~~~~~~~~~~~~~~~~~~~~~~~~~~~~
Enter begin time for report:

--    Valid input formats:
--      To specify absolute begin time:
--        [MM/DD[/YY]] HH24:MI[:SS]
--        Examples: 02/23/03 14:30:15
--                  02/23 14:30:15
--                  14:30:15
--                  14:30
--      To specify relative begin time: (start with '-' sign)
--        -[HH24:]MI
--        Examples: -1:15  (SYSDATE - 1 Hr 15 Mins)
--                  -25    (SYSDATE - 25 Mins)

Defaults to -15 mins
 input begin_time Value of:	#Default before 15min
Report begin time specified:

Enter duration in minutes starting from begin time:
Defaults to SYSDATE - begin_time
Press Enter to analyze till current time
 input duration Value of:		#Default current
Report duration specified:

Using 18-1 month -22 14:29:30 as report begin time
Using 18-1 month -22 14:44:35 as report end time
.......
Specify the Report Name
~~~~~~~~~~~~~~~~~~~~~~~
The default report file name is ashrpt_1_0118_1444.html.  To use this name,
press <return> to continue, otherwise enter an alternative.
input report_name Value of:  /tmp/ashrpt_1_0118_1444.html	#Save location
View the status of ash enabled
SELECT x.ksppinm NAME, y.ksppstvl VALUE,x.ksppdesc describ
FROM SYS.x$ksppi x, SYS.x$ksppcv y
WHERE x.inst_id = USERENV ('Instance')
AND y.inst_id = USERENV ('Instance')
AND x.indx = y.indx
AND x.ksppinm LIKE '%&par%'

#Two values ash_en and ash_sample
The difference between ash and awr is that whether the snapshot segment is restarted directly does not affect ash
If the package is called:
#DBMS is called_ workload_ Ash of repository package_ report_ html
#The syntax is as follows, which has not been tested
select output from table(dbms_workload_repository.ash_report_html
( dbid,inst_num,l_btime,l_etime));

select output from table(dbms_workload_repository.ash_report_html
(1620367844,1,sysdate-30/1440,sysdate-1/1440));

#inst_num, 1 identifies the database instance. If it is rac, 1 and 2 are required
#l_btime start time
#l_etime end time
ASH information is designed to scroll in memory, and early information will be overwritten when needed. The information recorded by ASH can be accessed via v$active_session_history view,
For each active session, each sampling will record a row of information in this view.
select * from v$sgastat where name like'%ASH%';
select * from v$active_session_history;
select * from dba_hist_active_sess_history;
3.ADDM
This report is very useful to give corresponding suggestions according to the operation over a period of time
Similarly:
SQL> @?/rdbms/admin/addmrpt
3.1addm report cases
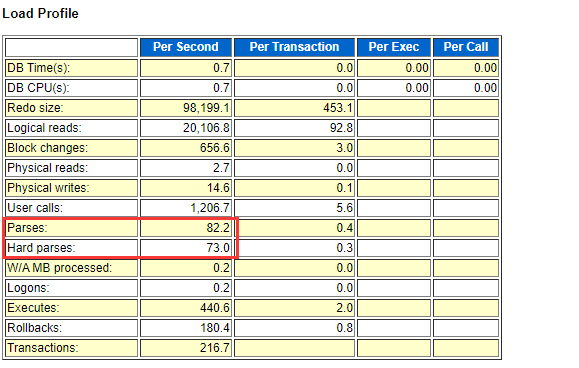
There is a production environment database with hardware configuration of 32c and 64g. The business volume is very small. After a while, the front end is very slow. After restarting the database, it is normal again.
The reason is that the hit rate of sql generated by the application is very low, almost all of which are hard parsing. After a short run, there are more than 300 million hard parsing, almost more than 80% of which are hard parsing
In addm, it is suggested to bind variables for optimization, but the sql is generated by the framework and cannot be changed. Therefore, finally, addm's suggestion is adopted:
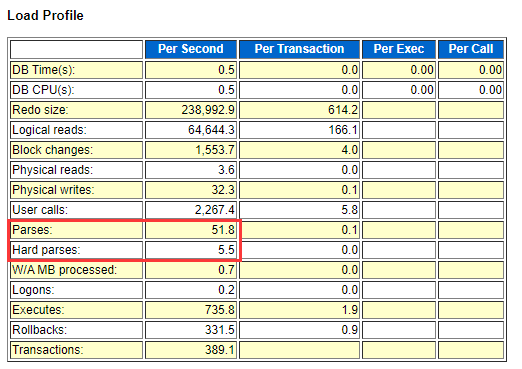
Alternatively, you may set the parameter "cursor_sharing" to "force". (default is exact)
alter system set cursor_sharing='force' scope=both;
You may not see the effect immediately after the modification. After confirming that it does not affect the business, refresh the shared pool for testing
That is, as long as oracle regards predicates similar to sql as a variable, it means to treat them as an sql
awr report:
Modifying cursor_ awr the next day after the sharing parameter:
The following is the original addm report:
          ADDM Report for Task 'TASK_16533'
          ---------------------------------

Analysis Period
---------------
AWR snapshot range from 3224 to 3255.
Time period starts at 17-JAN-22 12.00.31 AM
Time period ends at 18-JAN-22 07.01.01 AM

Analysis Target
---------------
Database 'ORCL' with DB ID 1607561855.
Database version 11.2.0.3.0.
ADDM performed an analysis of instance orcl, numbered 1 and hosted at mtdb01.

Activity During the Analysis Period
-----------------------------------
Total database time was 86567 seconds.
The average number of active sessions was .78.

Summary of Findings
-------------------
   Description                      Active Sessions      Recommendations
                                    Percent of Activity
   -------------------------------  -------------------  ---------------
1  Hard Parse Due to Literal Usage  .39 | 50.07          1
2  Commits and Rollbacks            .13 | 16.28          2
3  Soft Parse                       .03 | 3.68           2
4  Top SQL Statements               .02 | 2.09           1


~~~~~~~~~~~~~~~~~~~~~~~~~~~~~~~~~~~~~~~~~~~~~~~~~~~~~~~~~~~~~~~~~~~~~~~~~~~~~~
~~~~~~~~~~~~~~~~~~~~~~~~~~~~~~~~~~~~~~~~~~~~~~~~~~~~~~~~~~~~~~~~~~~~~~~~~~~~~~


          Findings and Recommendations
          ----------------------------

Finding 1: Hard Parse Due to Literal Usage
Impact is .39 active sessions, 50.07% of total activity.
--------------------------------------------------------
SQL statements were not shared due to the usage of literals. This resulted in
additional hard parses which were consuming significant database time.

   Recommendation 1: Application Analysis
   Estimated benefit is .39 active sessions, 50.07% of total activity.
   -------------------------------------------------------------------
   Action
      Investigate application logic for possible use of bind variables instead
      of literals.
   Action
      Alternatively, you may set the parameter "cursor_sharing" to "force".
   Rationale
      At least 3673 SQL statements with FORCE_MATCHING_SIGNATURE
      8464371428475771961 and PLAN_HASH_VALUE 3531511240 were found to be
      using literals. Look in V$SQL for examples of such SQL statements.
   Rationale
      At least 121 SQL statements with FORCE_MATCHING_SIGNATURE
      16690906714929480517 and PLAN_HASH_VALUE 3496227569 were found to be
      using literals. An example is SQL statement with SQL_ID "2ygfgj0pbsb63".
      Related Object
         SQL statement with SQL_ID 2ygfgj0pbsb63.

   Rationale
      At least 121 SQL statements with FORCE_MATCHING_SIGNATURE
      16690906714929480517 and PLAN_HASH_VALUE 3496227569 were found to be
      using literals. An example is SQL statement with SQL_ID "183bzftd6jkvq".
      Related Object
         SQL statement with SQL_ID 183bzftd6jkvq.

   Rationale
      At least 78 SQL statements with FORCE_MATCHING_SIGNATURE
      3805397472661015378 and PLAN_HASH_VALUE 3496227569 were found to be
      using literals. An example is SQL statement with SQL_ID "gfzdcyt5mxjq5".
      Related Object
         SQL statement with SQL_ID gfzdcyt5mxjq5.

   Rationale
      At least 78 SQL statements with FORCE_MATCHING_SIGNATURE
      3805397472661015378 and PLAN_HASH_VALUE 3496227569 were found to be
      using literals. An example is SQL statement with SQL_ID "7754p6x0r6kzr".
      Related Object
         SQL statement with SQL_ID 7754p6x0r6kzr.

   Rationale
      At least 74 SQL statements with FORCE_MATCHING_SIGNATURE
      12299295095435347513 and PLAN_HASH_VALUE 1419987341 were found to be
      using literals. An example is SQL statement with SQL_ID "bmxwt43j38wb6".
      Related Object
         SQL statement with SQL_ID bmxwt43j38wb6.

   Rationale
      At least 74 SQL statements with FORCE_MATCHING_SIGNATURE
      12299295095435347513 and PLAN_HASH_VALUE 1419987341 were found to be
      using literals. An example is SQL statement with SQL_ID "0r81jw9mg5tx4".
      Related Object
         SQL statement with SQL_ID 0r81jw9mg5tx4.

   Rationale
      At least 70 SQL statements with FORCE_MATCHING_SIGNATURE
      14736279330203604968 and PLAN_HASH_VALUE 1419987341 were found to be
      using literals. An example is SQL statement with SQL_ID "4g5mh3yg5csyc".
      Related Object
         SQL statement with SQL_ID 4g5mh3yg5csyc.

   Rationale
      At least 70 SQL statements with FORCE_MATCHING_SIGNATURE
      14736279330203604968 and PLAN_HASH_VALUE 1419987341 were found to be
      using literals. An example is SQL statement with SQL_ID "0yhm43m16jc86".
      Related Object
         SQL statement with SQL_ID 0yhm43m16jc86.


   Symptoms That Led to the Finding:
   ---------------------------------
      Hard parsing of SQL statements was consuming significant database time.
      Impact is .42 active sessions, 53.92% of total activity.


Finding 2: Commits and Rollbacks
Impact is .13 active sessions, 16.28% of total activity.
--------------------------------------------------------
Waits on event "log file sync" while performing COMMIT and ROLLBACK operations
were consuming significant database time.

   Recommendation 1: Application Analysis
   Estimated benefit is .13 active sessions, 16.28% of total activity.
   -------------------------------------------------------------------
   Action
      Investigate application logic for possible reduction in the number of
      COMMIT operations by increasing the size of transactions.
   Rationale
      The application was performing 12974 transactions per minute with an
      average redo size of 558 bytes per transaction.

   Recommendation 2: Host Configuration
   Estimated benefit is .13 active sessions, 16.28% of total activity.
   -------------------------------------------------------------------
   Action
      Investigate the possibility of improving the performance of I/O to the
      online redo log files.
   Rationale
      The average size of writes to the online redo log files was 3 K and the
      average time per write was 1 milliseconds.
   Rationale
      The total I/O throughput on redo log files was 136 K per second for
      reads and 132 K per second for writes.
   Rationale
      The redo log I/O throughput was divided as follows: 0% by RMAN and
      recovery, 49% by Log Writer, 0% by Archiver, 0% by Streams AQ and 50% by
      all other activity.

   Symptoms That Led to the Finding:
   ---------------------------------
      Wait class "Commit" was consuming significant database time.
      Impact is .13 active sessions, 16.28% of total activity.


Finding 3: Soft Parse
Impact is .03 active sessions, 3.68% of total activity.
-------------------------------------------------------
Soft parsing of SQL statements was consuming significant database time.

   Recommendation 1: Application Analysis
   Estimated benefit is .03 active sessions, 3.68% of total activity.
   ------------------------------------------------------------------
   Action
      Investigate application logic to keep open the frequently used cursors.
      Note that cursors are closed by both cursor close calls and session
      disconnects.

   Recommendation 2: Database Configuration
   Estimated benefit is .03 active sessions, 3.68% of total activity.
   ------------------------------------------------------------------
   Action
      Consider increasing the session cursor cache size by increasing the
      value of parameter "session_cached_cursors".
   Rationale
      The value of parameter "session_cached_cursors" was "50" during the
      analysis period.


Finding 4: Top SQL Statements
Impact is .02 active sessions, 2.09% of total activity.
-------------------------------------------------------
SQL statements consuming significant database time were found. These
statements offer a good opportunity for performance improvement.

   Recommendation 1: SQL Tuning
   Estimated benefit is .01 active sessions, 1.86% of total activity.
   ------------------------------------------------------------------
   Action
      Run SQL Tuning Advisor on the SELECT statement with SQL_ID
      "aq9t7f6xqvpjs".
      Related Object
         SQL statement with SQL_ID aq9t7f6xqvpjs.
         SELECT companyname FROM license
   Rationale
      The SQL spent 89% of its database time on CPU, I/O and Cluster waits.
      This part of database time may be improved by the SQL Tuning Advisor.
   Rationale
      Database time for this SQL was divided as follows: 90% for SQL
      execution, 10% for parsing, 0% for PL/SQL execution and 0% for Java
      execution.
   Rationale
      SQL statement with SQL_ID "aq9t7f6xqvpjs" was executed 20449339 times
      and had an average elapsed time of 0.000062 seconds.


~~~~~~~~~~~~~~~~~~~~~~~~~~~~~~~~~~~~~~~~~~~~~~~~~~~~~~~~~~~~~~~~~~~~~~~~~~~~~~
~~~~~~~~~~~~~~~~~~~~~~~~~~~~~~~~~~~~~~~~~~~~~~~~~~~~~~~~~~~~~~~~~~~~~~~~~~~~~~

          Additional Information
          ----------------------

Miscellaneous Information
-------------------------
Wait class "Application" was not consuming significant database time.
Wait class "Concurrency" was not consuming significant database time.
Wait class "Configuration" was not consuming significant database time.
CPU was not a bottleneck for the instance.
Wait class "Network" was not consuming significant database time.
Wait class "User I/O" was not consuming significant database time.
Session connect and disconnect calls were not consuming significant database
time.

The database's maintenance windows were active during 19% of the analysis
period.
4.AWRDD
awrdd needs to enter begin snap twice_ ID and end snap_id is two time periods. How to select and compare and generate reports
SQL> @?/rdbms/admin/awrddrpt
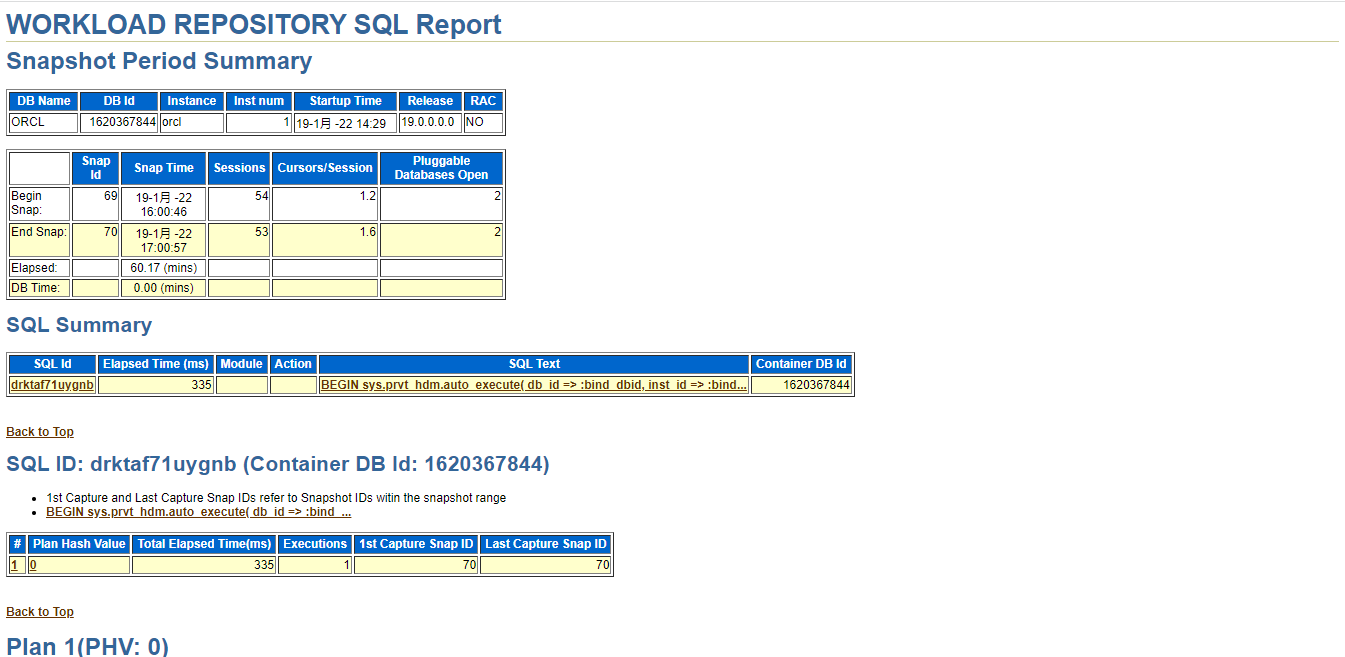
5.AWRSQ
Unlike other report acquisition, it requires an SQL of SQL_ID
The common operation is to get the SQL to be analyzed in the awr report_ ID, and then the SQL_ID to awrsq Report
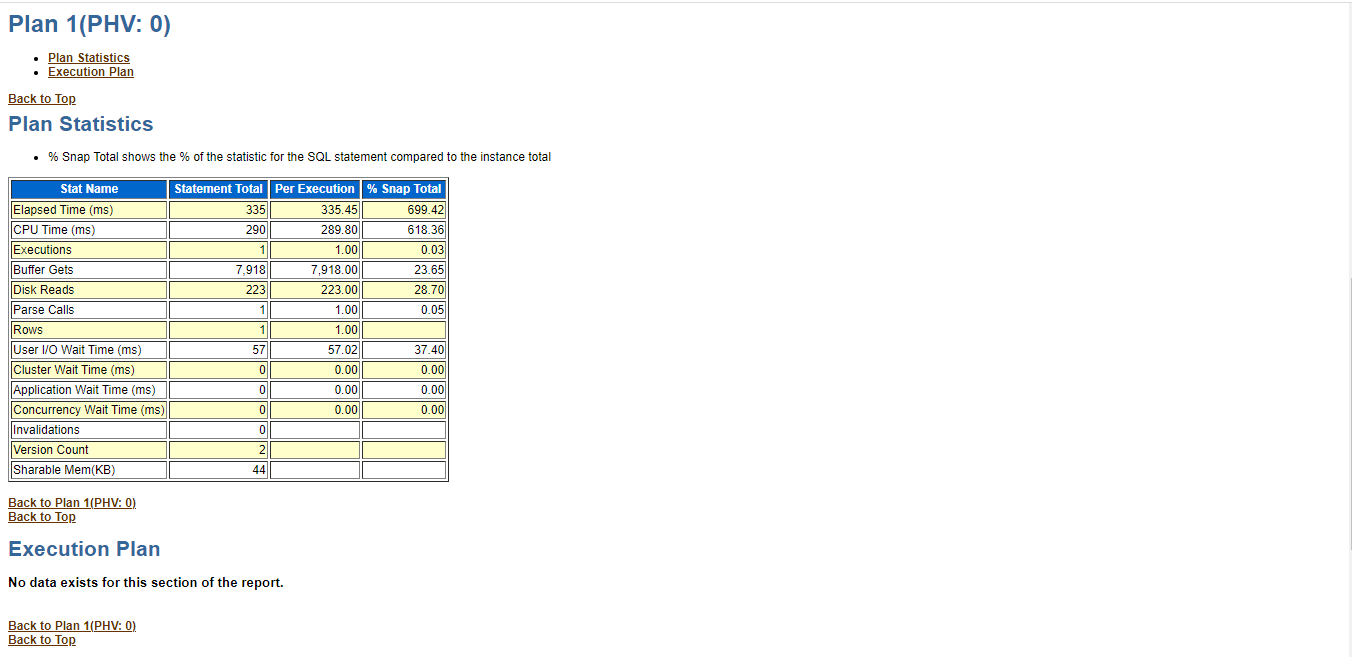
The report contains detailed implementation plan and statistics
SQL> @?/rdbms/admin/awrsqrpt
......
input num_days Value of:  1
......
Specify the Begin and End Snapshot Ids
~~~~~~~~~~~~~~~~~~~~~~~~~~~~~~~~~~~~~~
input begin_snap Value of:  69
Begin Snapshot Id specified: 69

input end_snap Value of:  70
End   Snapshot Id specified: 70


#This sql_ The ID comes from an sql in awr, which needs to be analyzed in combination with the snapshot segment
Specify the SQL Id
~~~~~~~~~~~~~~~~~~
input sql_id Value of:  drktaf71uygnb

Listing all available Container DB Ids for SQL Id drktaf71uygnb
  Container DB Id Container Name
----------------- --------------
*      1620367844 CDB$ROOT

Using Container DB Id 1620367844


Specify the Report Name
~~~~~~~~~~~~~~~~~~~~~~~
The default report file name is awrsqlrpt_1_69_70.html.  To use this name,
press <return> to continue, otherwise enter an alternative.

input report_name Value of:  /tmp/awrqs_test.html
Example:
......