WeChat official account: operation and development story: Author: Joker
summary
In the monitoring system, we usually think that monitoring is divided into white box monitoring and black box monitoring.
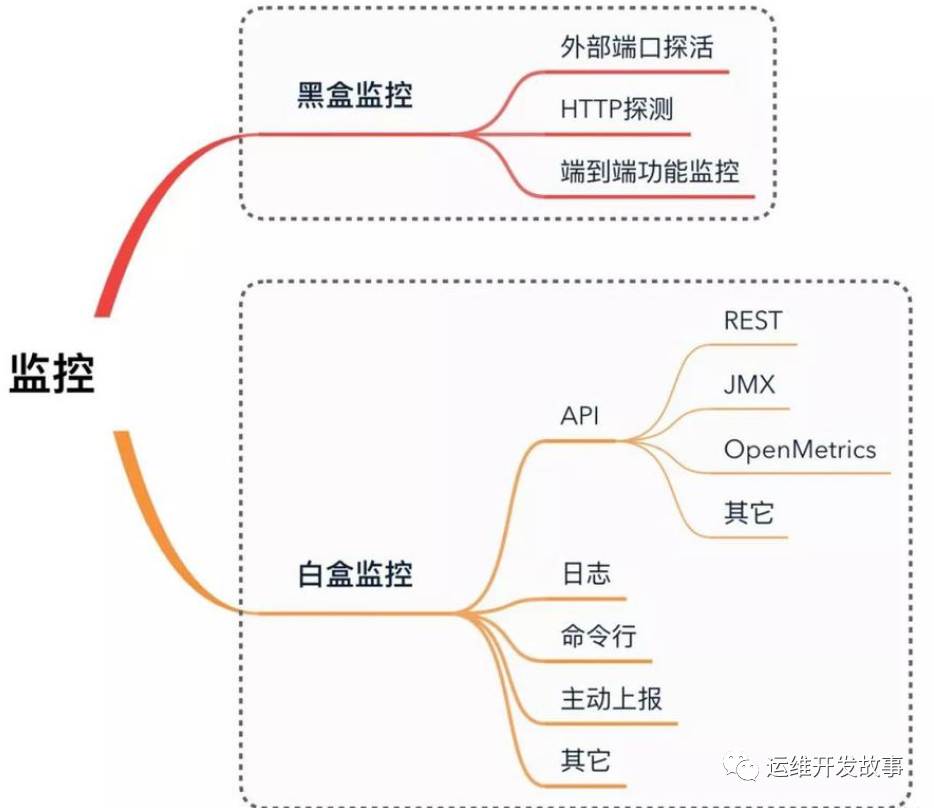
Black box monitoring: the phenomena mainly concerned are generally things that are happening. For example, if an alarm occurs and the service interface is abnormal, this monitoring is the monitoring that can be seen from the user's point of view, and the focus is to alarm the faults that are happening.
White box monitoring: the main concern is the reason, that is, some indicators exposed inside the system. For example, redis slave down is displayed in redis info, which is an internal indicator displayed in redis info. The key lies in the reason. It may be that redis down is seen in black box monitoring, and redis port is rejected connection is displayed when viewing internal information.
Blackbox Exporter
Blackbox Exporter is an official black box monitoring solution provided by Prometheus community, which allows users to detect the network through HTTP, HTTPS, DNS, TCP and ICMP.
1. HTTP test
-
Define Request Header information
-
Determine HTTP status / HTTP responses header / HTTP body content
2. TCP test
-
Business component port status listening
-
Application layer protocol definition and monitoring
3. ICMP test
- Host detection mechanism
4. POST test
- Port Connectivity
5. SSL certificate expiration time
Install Blackbox Exporter
(1) Create YAML configuration file (blackbox deployment. YAML)
apiVersion: v1
kind: Service
metadata:
  name: blackbox
  namespace: monitoring
  labels:
    app: blackbox
spec:
  selector:
    app: blackbox
  ports:
  - port: 9115
    targetPort: 9115
---
apiVersion: v1
kind: ConfigMap
metadata:
  name: blackbox-config
  namespace: monitoring
data:
  blackbox.yaml: |-
    modules:
      http_2xx:
        prober: http
        timeout: 10s
        http:
          valid_http_versions: ["HTTP/1.1", "HTTP/2"]
          valid_status_codes: [200]
          method: GET
          preferred_ip_protocol: "ip4"
      http_post_2xx:
        prober: http
        timeout: 10s
        http:
          valid_http_versions: ["HTTP/1.1", "HTTP/2"]
          valid_status_codes: [200]
          method: POST
          preferred_ip_protocol: "ip4"
      tcp_connect:
         prober: tcp
         timeout: 10s
      ping:
        prober: icmp
        timeout: 5s
        icmp:
          preferred_ip_protocol: "ip4"
      dns:
         prober: dns
         dns:
           transport_protocol: "tcp"
           preferred_ip_protocol: "ip4"
           query_name: "kubernetes.defalut.svc.cluster.local"
---
apiVersion: apps/v1
kind: Deployment
metadata:
  name: blackbox
  namespace: monitoring
spec:
  selector:
    matchLabels:
      app: blackbox
  template:
    metadata:
      labels:
        app: blackbox
    spec:
      containers:
      - name: blackbox
        image: prom/blackbox-exporter:v0.18.0
        args:
        - "--config.file=/etc/blackbox_exporter/blackbox.yaml"
        - "--log.level=error"
        ports:
        - containerPort: 9115
        volumeMounts:
        - name: config
          mountPath: /etc/blackbox_exporter
      volumes:
      - name: config
        configMap:
          name: blackbox-config
(2) Just create
kubectl apply -f blackbox-deploymeny.yaml
Configuration monitoring
Since the cluster is deployed in the Prometheus Operator mode, the configuration is added in the form of additional.
(1) Create Prometheus additional Yaml file, defined as follows:
- job_name: "ingress-endpoint-status"
  metrics_path: /probe
  params:
    module: [http_2xx]  # Look for a HTTP 200 response.
  static_configs:
    - targets:
      - http://172.17.100.134/healthz
      labels:
        group: nginx-ingress
  relabel_configs:
    - source_labels: [__address__]
      target_label: __param_target
    - source_labels: [__param_target]
      target_label: instance
    - target_label: __address__
      replacement: blackbox.monitoring:9115
- job_name: "kubernetes-service-dns"
  metrics_path: /probe
  params:
    module: [dns]
  static_configs:
  - targets:
    - kube-dns.kube-system:53
  relabel_configs:
  - source_labels: [__address__]
    target_label: __param_target
  - source_labels: [__param_target]
    target_label: instance
  - target_label: __address__
    replacement: blackbox.monitoring:9115
- job_name: "node-icmp-status"
(2) Create secret
kubectl -n monitoring create secret generic additional-config --from-file=prometheus-additional.yaml
(3) Modify the configuration file of prometheus, prometheus Prometheus yaml
Add the following three lines:
additionalScrapeConfigs:
  name: additional-config
  key: prometheus-additional.yaml
The complete configuration is as follows:
apiVersion: monitoring.coreos.com/v1
kind: Prometheus
metadata:
  labels:
    prometheus: k8s
  name: k8s
  namespace: monitoring
spec:
  alerting:
    alertmanagers:
    - name: alertmanager-main
      namespace: monitoring
      port: web
  baseImage: quay.io/prometheus/prometheus
  nodeSelector:
    kubernetes.io/os: linux
  podMonitorNamespaceSelector: {}
  podMonitorSelector: {}
  replicas: 2
  resources:
    requests:
      memory: 400Mi
  ruleSelector:
    matchLabels:
      prometheus: k8s
      role: alert-rules
  securityContext:
    fsGroup: 2000
    runAsNonRoot: true
    runAsUser: 1000
  additionalScrapeConfigs:
    name: additional-config
    key: prometheus-additional.yaml
  serviceAccountName: prometheus-k8s
  serviceMonitorNamespaceSelector: {}
  serviceMonitorSelector: {}
  version: v2.11.0
  storage:
    volumeClaimTemplate:
      spec:
        storageClassName: managed-nfs-storage
        resources:
          requests:
            storage: 10Gi
(4) Re apply configuration
kubectl apply -f prometheus-prometheus.yaml
(5)reload prometheus
Find the IP address of svc first
# kubectl get svc -n monitoring -l prometheus=k8s
NAME             TYPE        CLUSTER-IP     EXTERNAL-IP   PORT(S)    AGE
prometheus-k8s   ClusterIP   10.99.93.157   <none>        9090/TCP   33m
Use the following command reload
curl -X POST "http://10.99.93.157:9090/-/reload"
To modify the configuration file later, use the following three commands
kubectl delete secret additional-config -n monitoring
kubectl -n monitoring create secret generic additional-config --from-file=prometheus-additional.yaml
curl -X POST "http://10.99.93.157:9090/-/reload"
After waiting for a while, you can see the following target in the web interface of prometheus
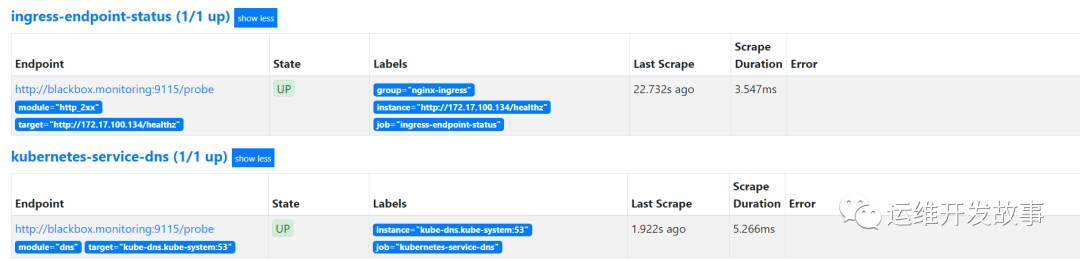
image.png
ICMP monitoring
ICMP mainly detects the connectivity of the destination host through the ping command.
The configuration is as follows:
- job_name: "node-icmp-status"
  metrics_path: /probe
  params:
    module: [ping]  # Look for a HTTP 200 response.
  static_configs:
    - targets:
      - 172.17.100.134
      - 172.17.100.50
      - 172.17.100.135
      - 172.17.100.136
      - 172.17.100.137
      - 172.17.100.138
      labels:
        group: k8s-node-ping
  relabel_configs:
    - source_labels: [__address__]
      target_label: __param_target
    - source_labels: [__param_target]
      target_label: instance
    - target_label: __address__
      replacement: blackbox.monitoring:9115
Then reload the configuration file
kubectl delete secret additional-config -n monitoring
kubectl -n monitoring create secret generic additional-config --from-file=prometheus-additional.yaml
curl -X POST "http://10.99.93.157:9090/-/reload"
Next, you can see that the monitoring is successful, as follows:
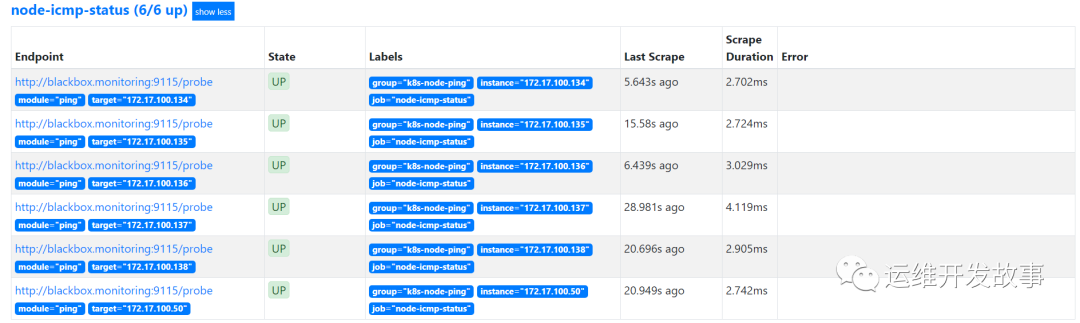
image.png
HTTP monitoring
HTTP is to detect whether the application is normal through GET or POST.
GET mode is configured here.
- job_name: "check-web-status"
  metrics_path: /probe
  params:
    module: [http_2xx]  # Look for a HTTP 200 response.
  static_configs:
    - targets:
      - https://www.coolops.cn
      - https://www.baidu.com
      labels:
        group: web-url
  relabel_configs:
    - source_labels: [__address__]
      target_label: __param_target
    - source_labels: [__param_target]
      target_label: instance
    - target_label: __address__
      replacement: blackbox.monitoring:9115
After reloading the configuration, you can see the following monitoring:
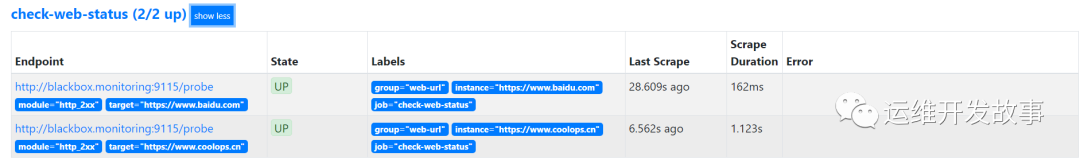
image.png
TCP monitoring
TCP monitoring is mainly detected in a way similar to Telnet. The configuration is as follows:
- job_name: "check-middleware-tcp"
  metrics_path: /probe
  params:
    module: [tcp_connect]  # Look for a HTTP 200 response.
  static_configs:
    - targets:
      - 172.17.100.135:80
      - 172.17.100.74:3306
      - 172.17.100.25:3306
      - 172.17.100.8:3306
      - 172.17.100.75:3306
      - 172.17.100.72:3306
      - 172.17.100.73:3306
      labels:
        group: middleware-tcp
  relabel_configs:
    - source_labels: [__address__]
      target_label: __param_target
    - source_labels: [__param_target]
      target_label: instance
    - target_label: __address__
      replacement: blackbox.monitoring:9115
After reloading the configuration file, the monitoring is as follows:
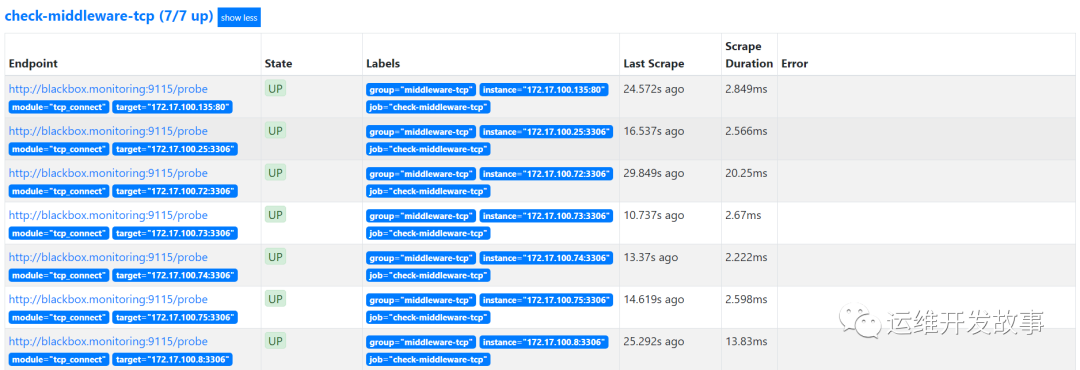
image.png
Alarm rules
1. Business normality
-
Whether icmp, tcp, http and post monitoring are normal, probe can be observed_ The indicator of success
-
probe_success == 0 ## connectivity exception
-
probe_success == 1 ## connectivity is normal
-
Alarm is also used to judge whether this indicator is equal to 0. If it is equal to 0, an abnormal alarm will be triggered
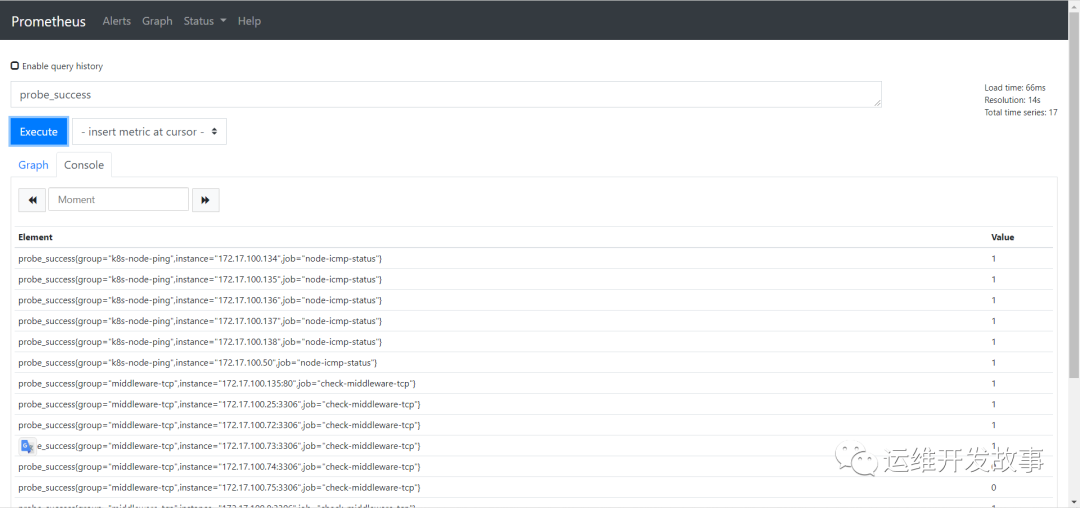
image.png
2. Through the http module, we can obtain the expiration time of the certificate and add relevant alarms according to the expiration time
probe_ssl_earliest_cert_expiry: you can query the expiration time of the certificate.
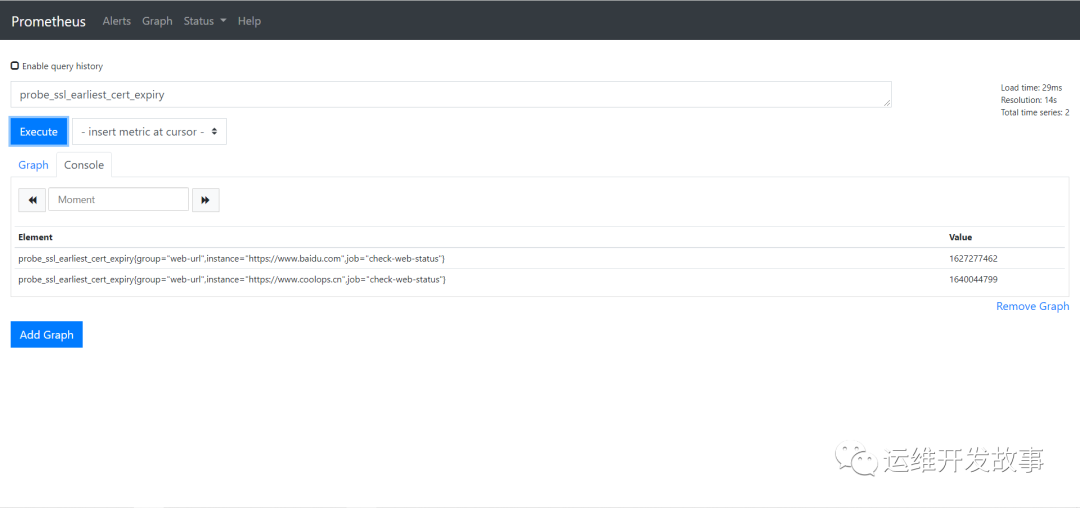
image.png
After unit conversion, we can get: (probe_ssl_early_cert_expiry - time()) / 86400
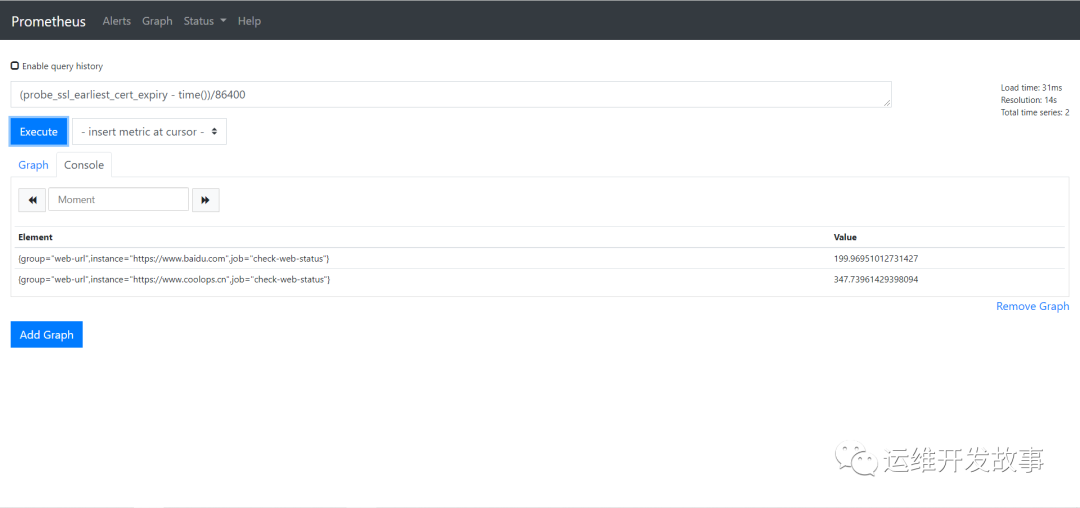
image.png
3. Therefore, we can customize the following alarm rules in combination with the above configuration
groups:
- name: blackbox_network_stats
  rules:
  - alert: blackbox_network_stats
    expr: probe_success == 0
    for: 1m
    labels:
      severity: critical
    annotations:
      summary: "Interface/host/Abnormal port connection alarm"
      description: "Interface/host/port {{ $labels.instance }}  Connectivity anomaly"
ssl detection
groups:
- name: check_ssl_status
  rules:
  - alert: "ssl Certificate expiration warning"
    expr: (probe_ssl_earliest_cert_expiry - time())/86400 <30
    for: 1h
    labels:
      severity: warn
    annotations:
      description: 'domain name{{$labels.instance}}Your certificate and{{ printf "%.1f" $value }}Days will expire,Please update the certificate as soon as possible'
      summary: "ssl Certificate expiration warning"
Grafana panel
Directly use 12559 to import.
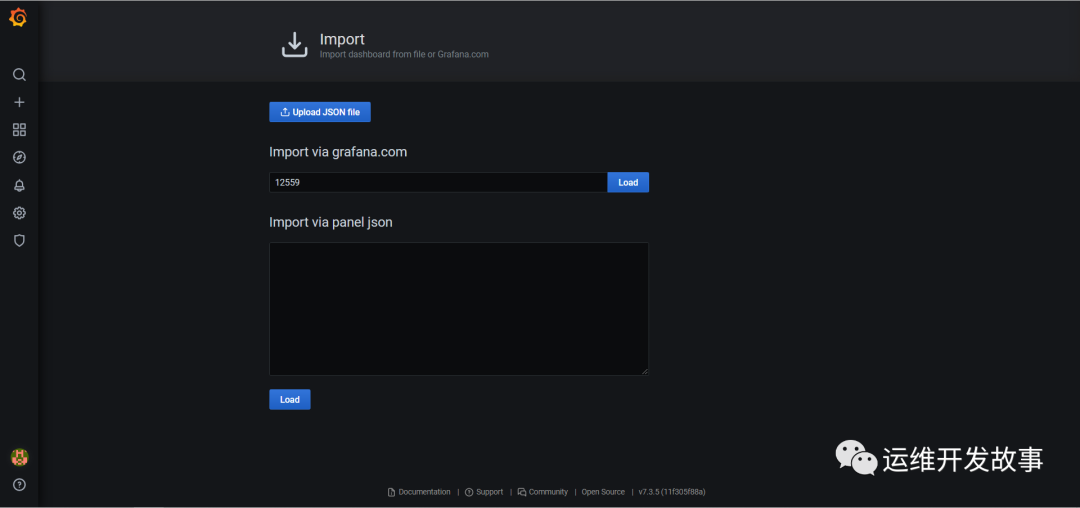
image.png
This is what it looks like after importing.
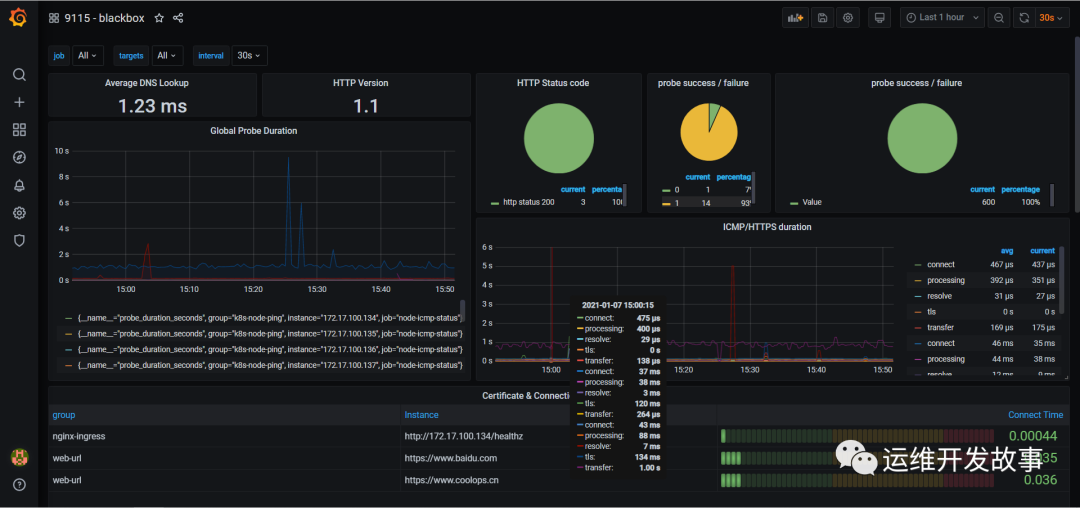
image.png
Official account: operation and development story
github: https://github.com/orgs/sunsharing-note/dashboard
Love life, love operation and maintenance
If you think the article is good, please click on the top right corner to send it to your friends or forward it to your circle of friends. Your support and encouragement is my greatest motivation. If you like, please pay attention to me~

Scanning QR code
Pay attention to me and maintain high-quality content from time to time
reminder
If you like this article, please share it with your circle of friends. For more information, please follow me.
........................