1, Gephi
Gephi It is an open source free cross platform JVM based complex network analysis software. It is mainly used for various networks and complex systems. It is an open source tool for interactive visualization and detection of dynamic and hierarchical graphs. It is a very easy-to-use network relationship drawing software with a wide range of applications. Most of the relationship data that can be abstracted into node s and edge s can be drawn with Gephi, such as social networks, transportation networks, etc.
This paper mainly introduces how to use the jar package of Gephi source code and sigma JS plug-in realizes the automation of Gephi and embeds the generated graph results into the web.
2, Toolkit
Toolkit is a standard jar package provided by Gephi. You can import the jar package in any java project to break away from Gephi's UI interface and realize automation. At the same time, it supports converting the nbm format plug-in provided by Gephi into a jar package and importing it for use.
Toolkit Download: https://gephi.org/toolkit/
Toolkit API documentation: https://gephi.org/gephi-toolkit/0.9.2/apidocs/
Github:https://github.com/gephi/gephi/wiki/Toolkit
If it is a maven project, it can be found in POM Import toolkit dependencies in XML:
		<dependency>
			<groupId>org.gephi</groupId>
			<artifactId>gephi-toolkit</artifactId>
			<version>0.9.2</version>
		</dependency>
3, Sigma js
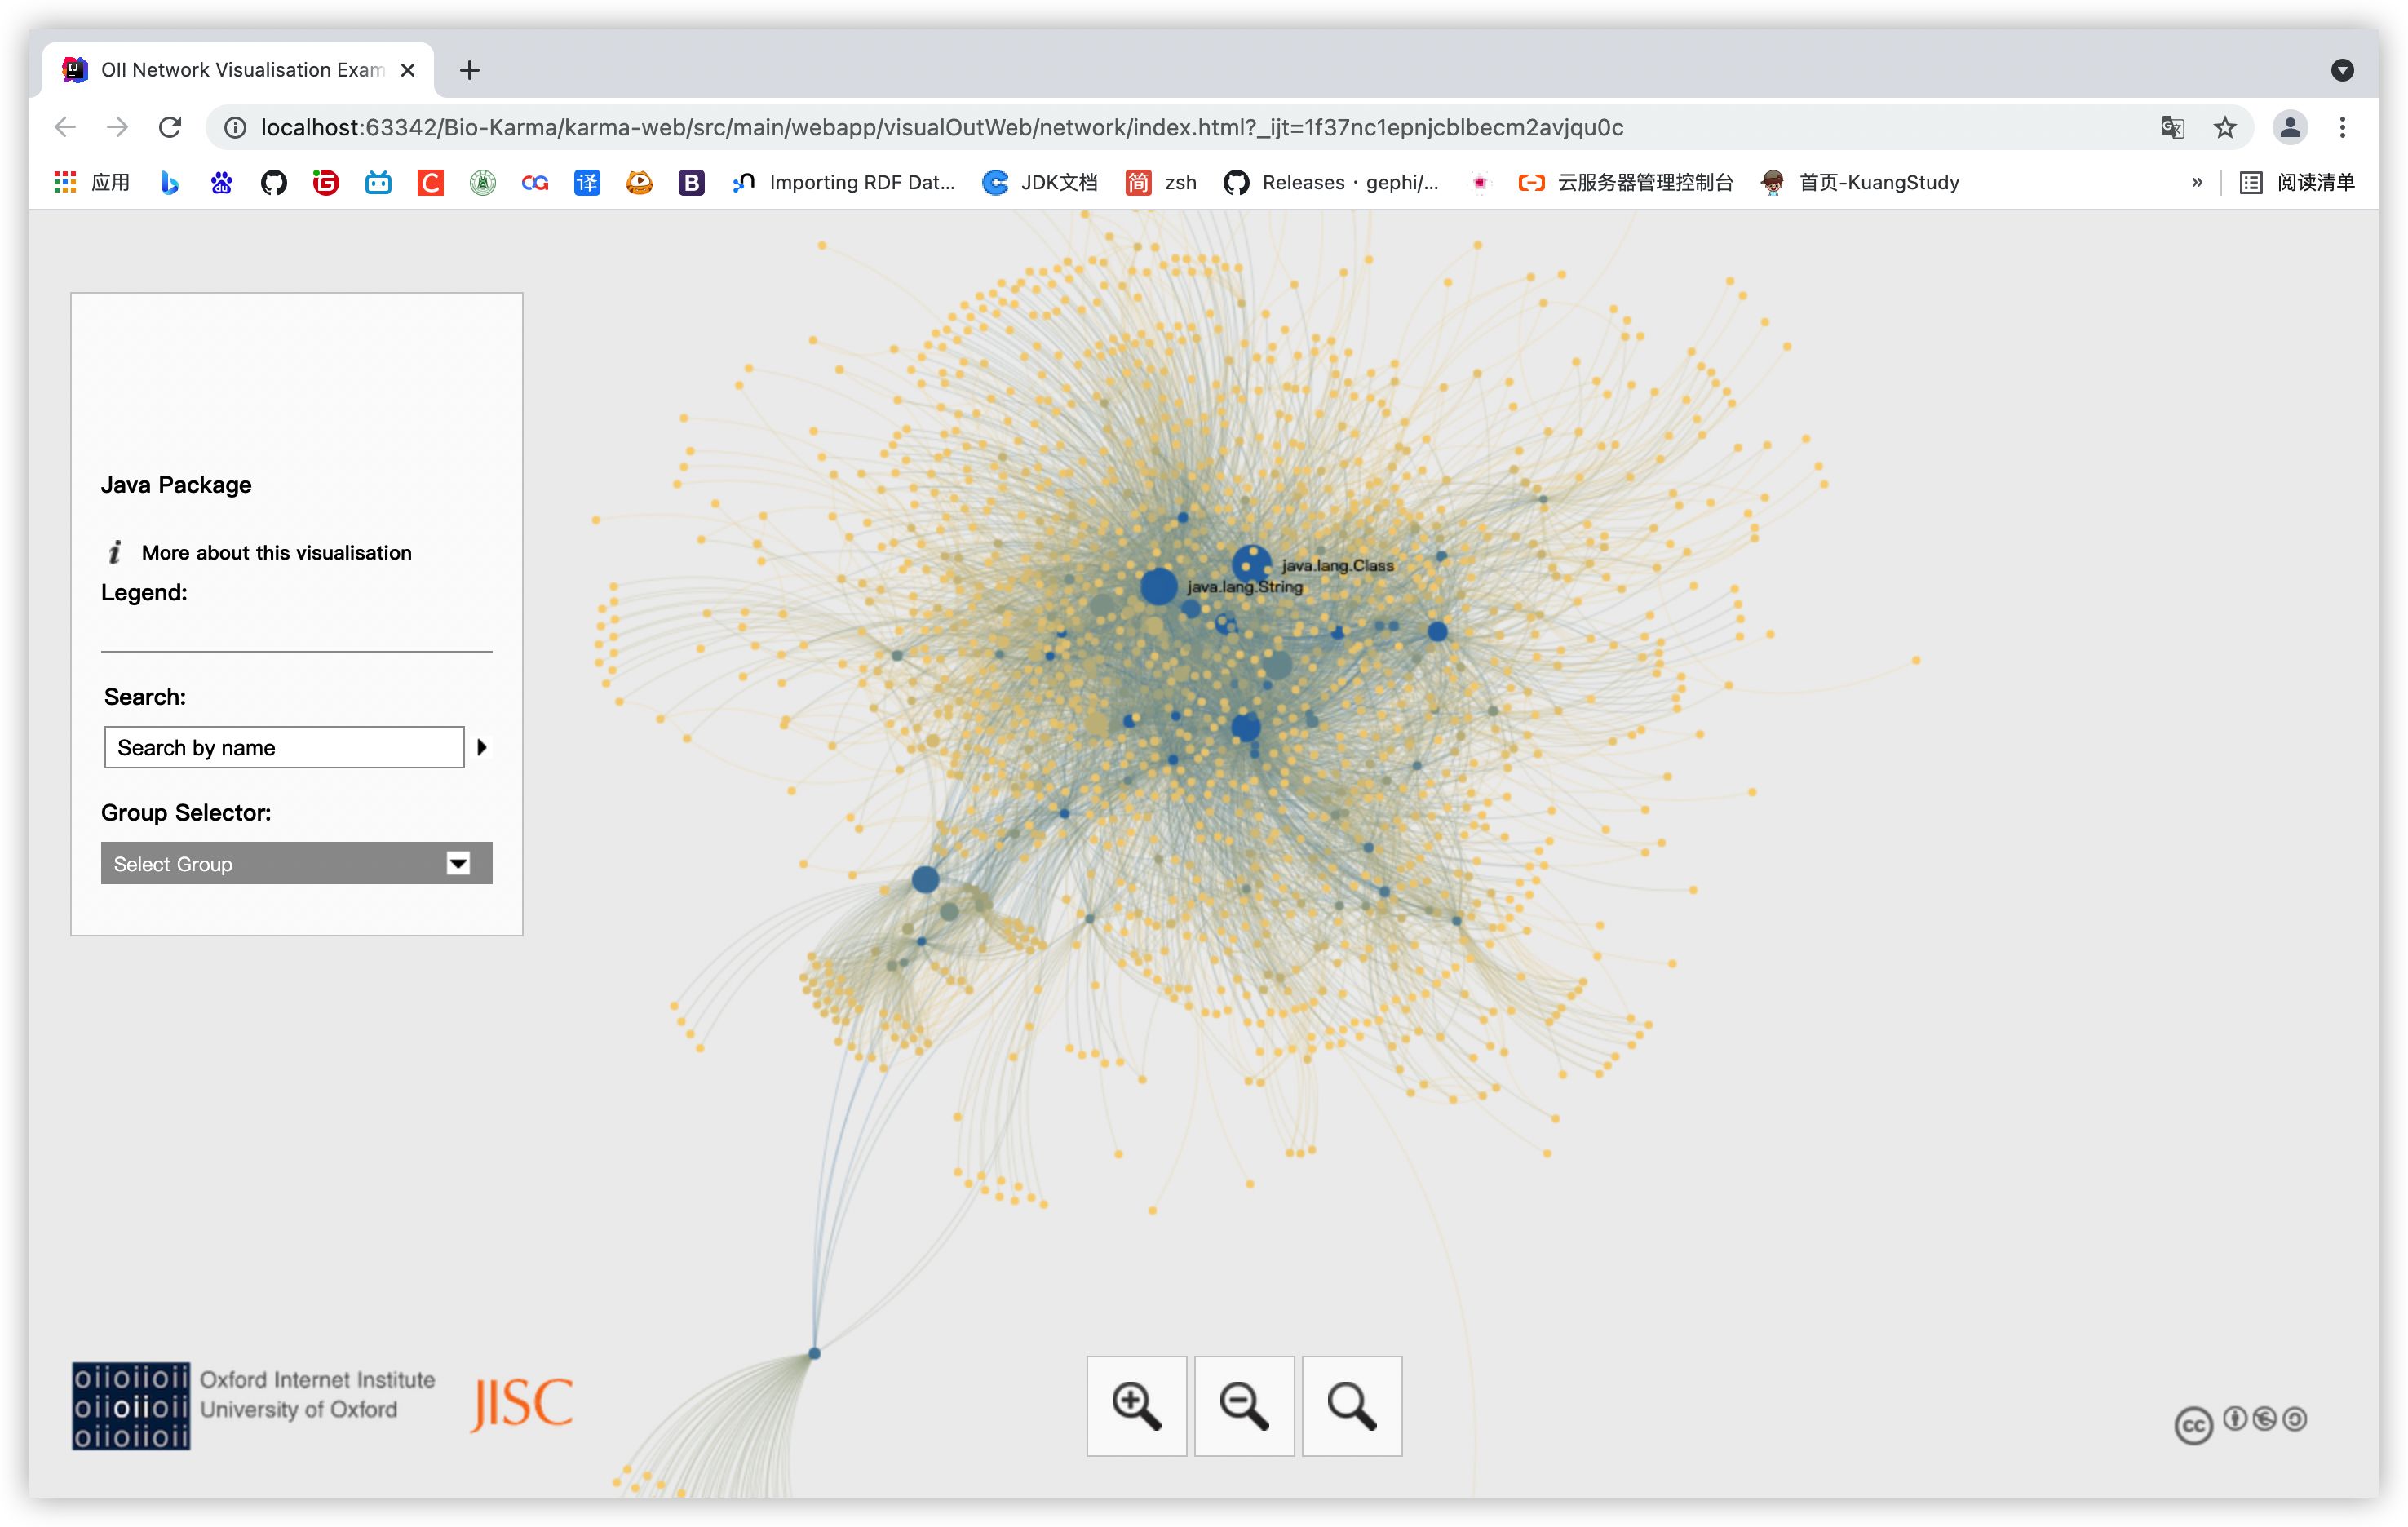
Sigma.js is a plug-in of Gephi. It can embed the graph results generated by Gephi into the web and realize simple statistics and analysis at the same time. The following is a through sigma JS image of embedding the network generated by Java package into the Web:

First, Download sigma from Gephi plug-in library JS plug-in: https://gephi.org/plugins/#/plugin/sigmaexporter
If you are too lazy, you can extract it from the online disk. Link: https://pan.baidu.com/s/1UTBMK_6bGDpX_urP39G5hg Password: 6cw2
After downloading, there is a file in nbm format, which can be imported and used in Gephi, but that is not what we need. We need to convert nbm into jar package and use it in the Toolkit.
Using the UnpackNBM toolkit provided by Gephi, you can convert nbm files into jar packages: https://github.com/gephi/gephi/wiki/How-to-use-plug-ins-with-the-Toolkit
After conversion, sigma is obtained JS jar package: UK ax ox oii sigma exporter Jar, import the jar package into the java project and use it!
4, Apply
The following is how to use Toolkit and sigma JS implementation of network generation and Web embedding example, after execution, you will get a network folder, where index Html is the result we want.
//If an error is reported, check whether the jar package of sigma is successfully imported
import org.gephi.appearance.api.AppearanceController;
import org.gephi.appearance.api.AppearanceModel;
import org.gephi.appearance.api.Function;
import org.gephi.appearance.plugin.RankingElementColorTransformer;
import org.gephi.appearance.plugin.RankingLabelSizeTransformer;
import org.gephi.appearance.plugin.RankingNodeSizeTransformer;
import org.gephi.filters.api.FilterController;
import org.gephi.filters.api.Query;
import org.gephi.filters.api.Range;
import org.gephi.filters.plugin.graph.DegreeRangeBuilder;
import org.gephi.graph.api.*;
import org.gephi.io.exporter.api.ExportController;
import org.gephi.io.importer.api.Container;
import org.gephi.io.importer.api.EdgeDirectionDefault;
import org.gephi.io.importer.api.EdgeMergeStrategy;
import org.gephi.io.importer.api.ImportController;
import org.gephi.io.processor.plugin.AppendProcessor;
import org.gephi.io.processor.plugin.DefaultProcessor;
import org.gephi.layout.plugin.force.StepDisplacement;
import org.gephi.layout.plugin.force.yifanHu.YifanHuLayout;
import org.gephi.preview.api.PreviewController;
import org.gephi.preview.api.PreviewModel;
import org.gephi.preview.api.PreviewProperty;
import org.gephi.preview.types.EdgeColor;
import org.gephi.project.api.ProjectController;
import org.gephi.project.api.Workspace;
import org.gephi.statistics.plugin.GraphDistance;
import org.junit.jupiter.api.Test;
import org.openide.util.Lookup;
import uk.ac.ox.oii.sigmaexporter.SigmaExporter;
import uk.ac.ox.oii.sigmaexporter.model.ConfigFile;

public static void main(String[] args){
        //Initialize workbench
        ProjectController pc = Lookup.getDefault().lookup(ProjectController.class);
        pc.newProject();
        Workspace workspace = pc.getCurrentWorkspace();

        //Get each module and controller
        //The edge and node information module of the whole graph
        GraphModel graphModel = Lookup.getDefault().lookup(GraphController.class).getGraphModel();
        //Preview module
        PreviewModel model = Lookup.getDefault().lookup(PreviewController.class).getModel();
        //Import module
        ImportController importController = Lookup.getDefault().lookup(ImportController.class);
        //Filter module
        FilterController filterController = Lookup.getDefault().lookup(FilterController.class);
        //Appearance display module
        AppearanceController appearanceController = Lookup.getDefault().lookup(AppearanceController.class);
        AppearanceModel appearanceModel = appearanceController.getModel();

        //Import drawing file
        Container container;
        try {
            File file = new File("Java.gexf");
            container = importController.importFile(file);
            container.getLoader().setEdgeDefault(EdgeDirectionDefault.DIRECTED);   //Force DIRECTED
        } catch (Exception ex) {
            ex.printStackTrace();
            return;
        }
        importController.process(container, new DefaultProcessor(), workspace);

        //Print information to see whether the drawing file is successfully imported
        DirectedGraph graph = graphModel.getDirectedGraph();
        System.out.println("Nodes: " + graph.getNodeCount());
        System.out.println("Edges: " + graph.getEdgeCount());

        //filter
        DegreeRangeBuilder.DegreeRangeFilter degreeFilter = new DegreeRangeBuilder.DegreeRangeFilter();
        degreeFilter.init(graph);
        //Nodes with filter degree less than 10
        degreeFilter.setRange(new Range(10, Integer.MAX_VALUE));
        Query query = filterController.createQuery(degreeFilter);
        GraphView view = filterController.filter(query);
        graphModel.setVisibleView(view);

        //Check whether the filter is effective
        UndirectedGraph graphVisible = graphModel.getUndirectedGraphVisible();
        System.out.println("After filter:");
        System.out.println("Nodes: " + graphVisible.getNodeCount());
        System.out.println("Edges: " + graphVisible.getEdgeCount());

        //Use YifanHu layout
        YifanHuLayout layout = new YifanHuLayout(null, new StepDisplacement(1f));
        layout.setGraphModel(graphModel);
        layout.resetPropertiesValues();
        layout.setOptimalDistance(200f);
        layout.initAlgo();
        for (int i = 0; i < 100 && layout.canAlgo(); i++) {
            layout.goAlgo();
        }
        layout.endAlgo();
        GraphDistance distance = new GraphDistance();
        distance.setDirected(true);
        distance.execute(graphModel);

        //Assign node color according to node degree value
        Function degreeRanking = appearanceModel.getNodeFunction(graph, AppearanceModel.GraphFunction.NODE_DEGREE, RankingElementColorTransformer.class);
        RankingElementColorTransformer degreeTransformer = degreeRanking.getTransformer();
        //The degree of the node changes from less to more, and the color changes from color1 to color2
        degreeTransformer.setColors(new Color[]{new Color(249,210,125), new Color(43,115,174)});
        degreeTransformer.setColorPositions(new float[]{0f, 0.1f});
        appearanceController.transform(degreeRanking);

        //Assign node size
        Column centralityColumn = graphModel.getNodeTable().getColumn(GraphDistance.BETWEENNESS);
        Function centralityRanking = appearanceModel.getNodeFunction(graph, centralityColumn, RankingNodeSizeTransformer.class);
        RankingNodeSizeTransformer centralityTransformer = centralityRanking.getTransformer();
        centralityTransformer.setMinSize(3);
        centralityTransformer.setMaxSize(10);
        appearanceController.transform(centralityRanking);

        //Label size
        Function centralityRanking2 = appearanceModel.getNodeFunction(graph, centralityColumn, RankingLabelSizeTransformer.class);
        RankingLabelSizeTransformer labelSizeTransformer = centralityRanking2.getTransformer();
        labelSizeTransformer.setMinSize(1);
        labelSizeTransformer.setMaxSize(3);
        appearanceController.transform(centralityRanking2);

        //Preview settings
        model.getProperties().putValue(PreviewProperty.SHOW_NODE_LABELS, Boolean.TRUE);
        model.getProperties().putValue(PreviewProperty.EDGE_COLOR, new EdgeColor(Color.GRAY));
        model.getProperties().putValue(PreviewProperty.EDGE_THICKNESS, 0.1f);
        model.getProperties().putValue(PreviewProperty.NODE_LABEL_FONT,       model.getProperties().getFontValue(PreviewProperty.NODE_LABEL_FONT).deriveFont(8));

        //Export pdf
        ExportController ec = Lookup.getDefault().lookup(ExportController.class);
        try {
            ec.exportFile(new File("demo.pdf"));
        } catch (IOException ex) {
            ex.printStackTrace();
        }

        //Export web
        SigmaExporter se = new SigmaExporter();
        se.setWorkspace(workspace);
        ConfigFile cf = new ConfigFile();
        cf.setDefaults();
        se.setConfigFile(cf,"visualOutWeb/",false);
        se.execute();
    }

}