matplotlib is a module of python, which is used to draw various graphs. Today, I will introduce the drawing of line graph.
Let's start with a simple example:
from matplotlib import pyplot as plt
x=range(4,26,2)
y=[32,43,21,54,32,3,21,32,21,32,43]
plt.plot(x,y)
plt.show()
The above lines of code can draw a simple line chart, in which x and Y constitute several points (Note: x and y can be of range type or list type, but the number of elements of both must be equal). The module can draw corresponding figures according to the points you provide.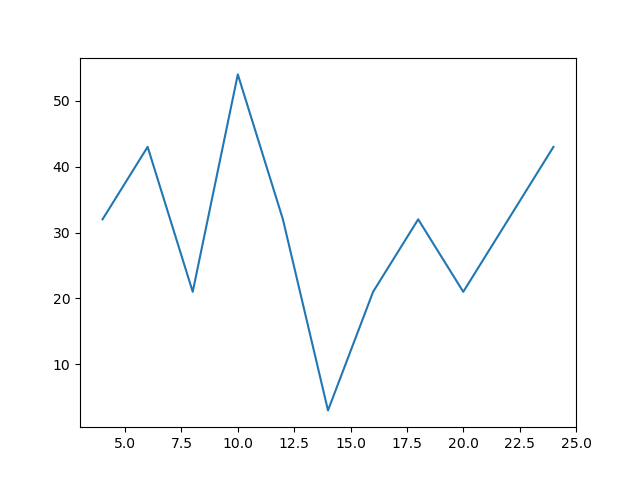 We can find that the numbers on the x-axis and y-axis are not the coordinates of our points. In fact, matplotlib allows us to customize the numbers displayed on the x-axis and y-axis, for example, add the following two lines of code
plt.xticks(range(1,10))
plt.yticks(range(min(y),max(y)+1,5))
It's like this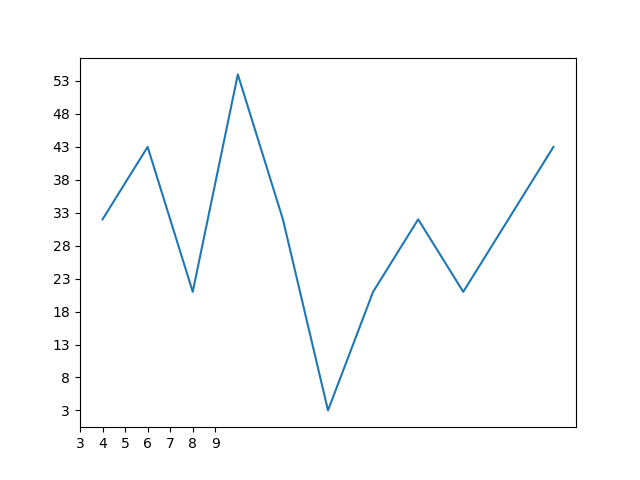 We found that: Although we set the x-axis number from 1-9, it starts from 3. Why? Since the coordinate X of our point has a minimum value of 4, it will automatically start from a number smaller than the minimum value and closest to the minimum value.
We can also set the size and clarity of the graph, such as
plt.figure(dpi=80,figsize=(50,70))
dpi is the number of pixels per inch, followed by height and width
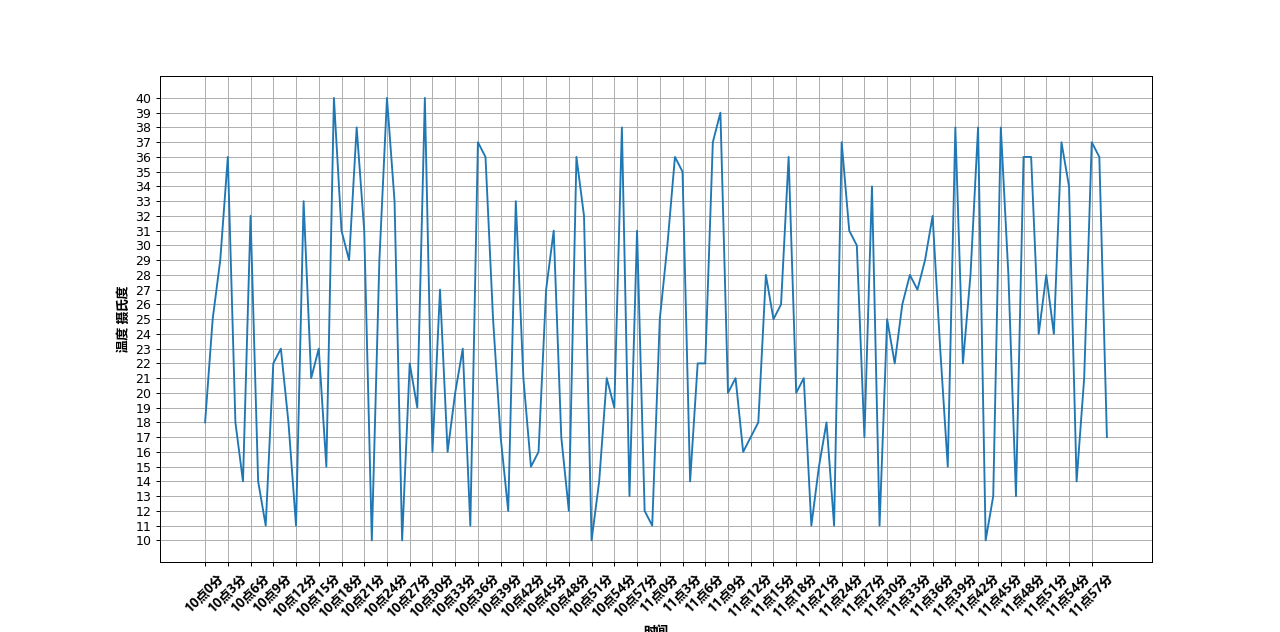
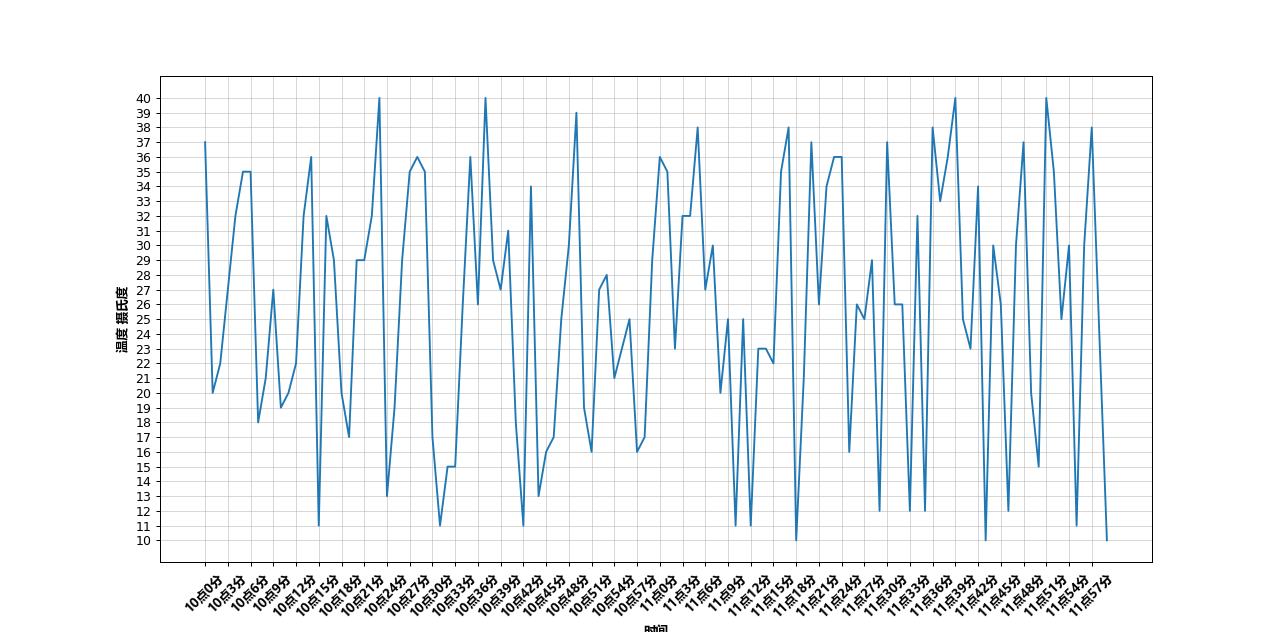
But when we want x-axis or y-axis to display Chinese characters (only numbers or letters can be displayed if it is not set), what should we do? Let's take an example. We want to plot the temperature from 10 to 12
from matplotlib import pyplot as plot
from  matplotlib import  font_manager
import random
#Set font
my_font=font_manager.FontProperties(fname='C:/Windows/WinSxS/amd64_microsoft-windows-f..-microsoftyaheibold_31bf3856ad364e35_10.0.18362.1_none_e1230363312b5372/msyhbd.ttc')
x=[ i for i in range(120)]
y=[random.randint(10,40)for i in range(120)]
plot.figure(dpi=90,figsize=(80,40))
#Set x scale
plot.yticks(range(10,41))
x_ticks=["10 spot{}branch".format(i) for i in range(60)]
x_ticks+=["11 spot{}branch".format(i) for i in range(60)]
plot.xticks(x[::3],x_ticks[::3],rotation=45,fontproperties=my_font)
plot.plot(x,y)
plot.show()
The fifth line is a way of setting font for windows system. The parameter is the location of font file in the system (you can search the. ttc file to find the location of simplified Chinese). The penultimate line uses the second parameter instead of the first one. Rotation is the degree of rotation, the direction is counter clockwise, fontproperties=my_font use our font file.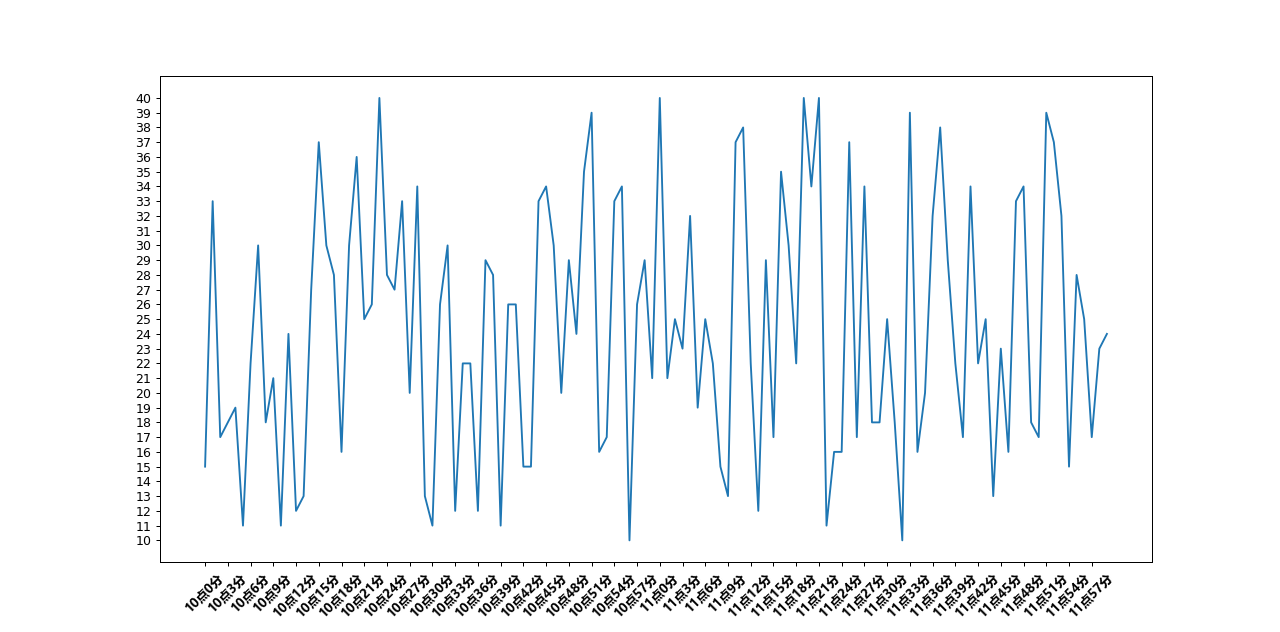 When we want to tell people what x-axis and y-axis represent, we can do this
plot.xlabel("time",fontproperties=my_font)
plot.ylabel("Temperature ° C",fontproperties=my_font)
We still need to use the font file above, otherwise Chinese cannot be displayed.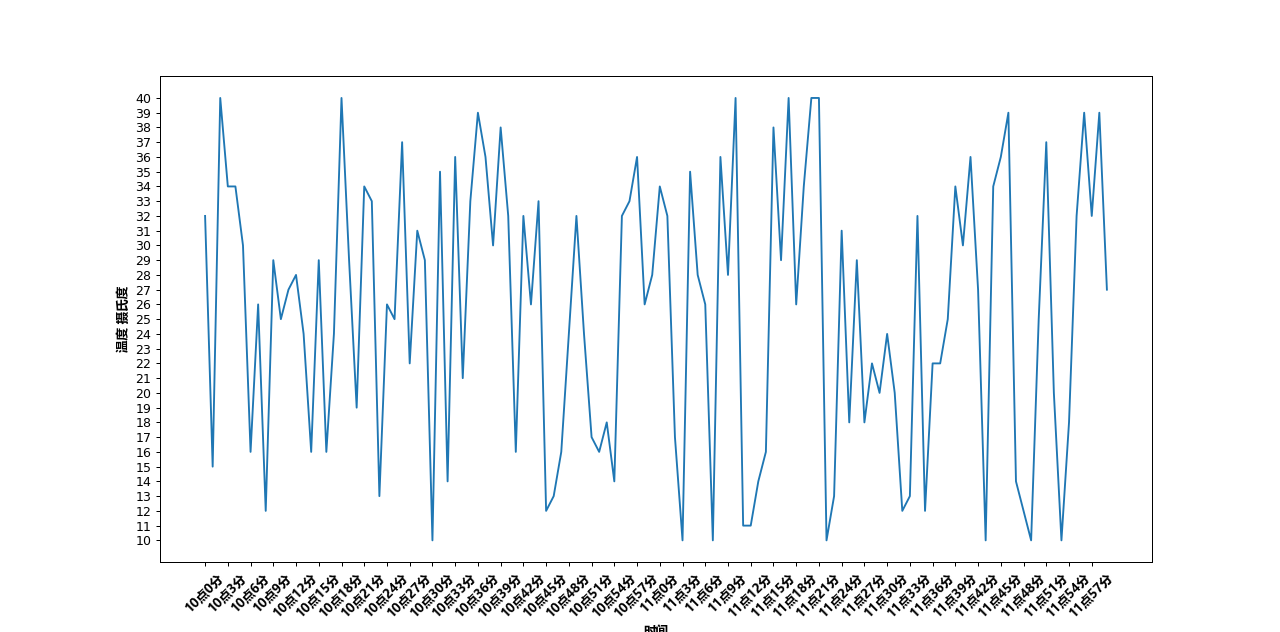
We can also display the grid in the graph
plot.grid()
Of course, you can also customize the clarity of the grid
plot.grid(alpha=0.5)
When we want to draw two broken lines in a broken line graph, we only need to plot twice, for example (because the graph above is too dense, I changed to a simple one)
from matplotlib import pyplot as  plt
import random
from  matplotlib import  font_manager
my_font=font_manager.FontProperties(fname='C:/Windows/WinSxS/amd64_microsoft-windows-f..-microsoftyaheibold_31bf3856ad364e35_10.0.18362.1_none_e1230363312b5372/msyhbd.ttc')
x=[i for i in range(11,31)]
y1=[random.randint(1,6) for i in range(11,31)]
y2=[random.randint(1,6) for i in range(11,31)]
x_ticks=["{}year".format(i) for i in range(11,31)]
plt.grid()

plt.xticks(x[::4],x_ticks[::4],rotation=45,fontproperties=my_font)
plt.xlabel("Age",fontproperties=my_font)
plt.ylabel("Number of girlfriends",fontproperties=my_font)
**plt.plot(x,y1)
plt.plot(x,y2)**
plt.show()
Look at the two lines of bold code to achieve the following effects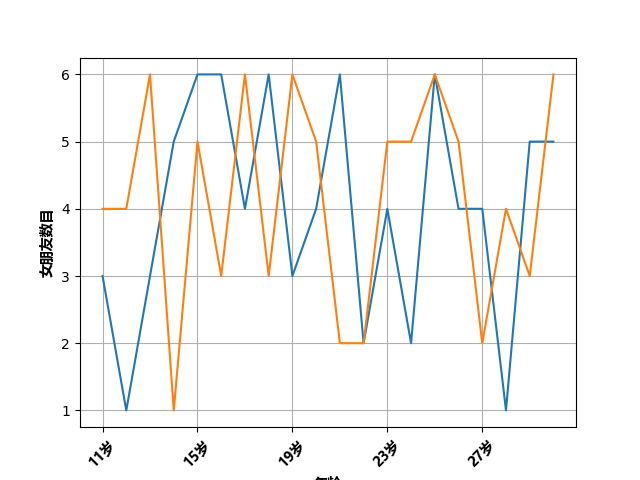
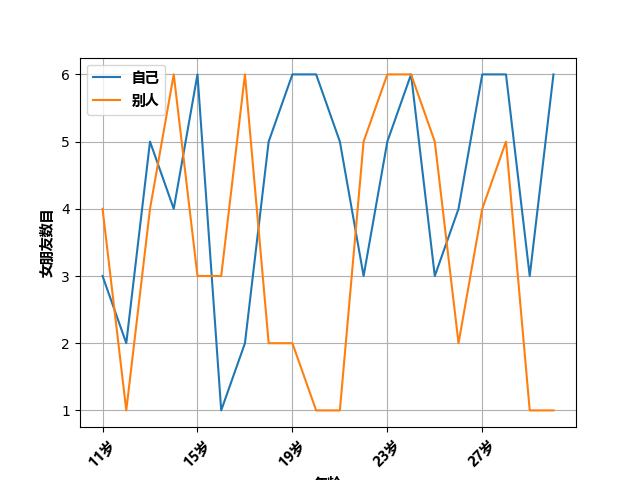
We can also mark what two broken lines represent in the figure, just add the following code
plt.plot(x,y1,label="own")
plt.plot(x,y2,label="others")
plt.legend(prop=my_font)
 matplotlib can also set the color, thickness, transparency and so on of lines. I will not list them here. You can check them again when you use them.