1, Say something
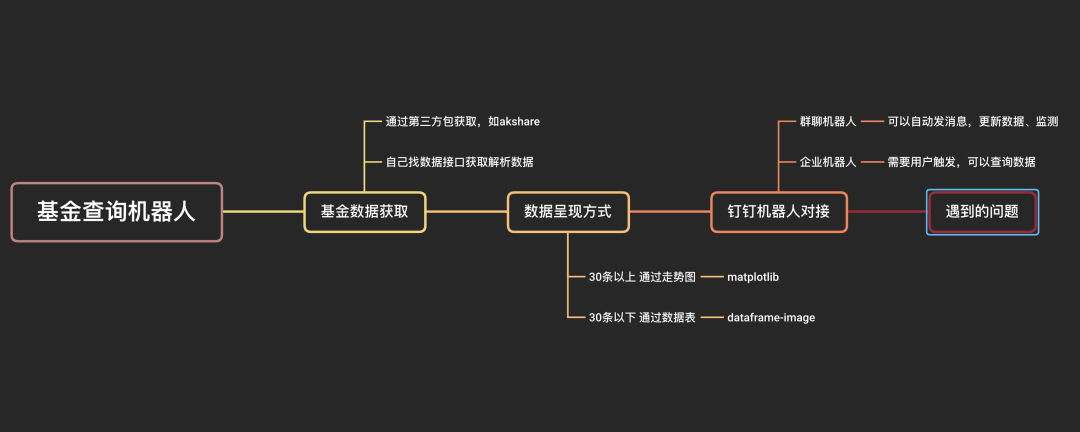
I have long wanted to build a fund monitoring robot to facilitate myself to check the rise and fall of various indexes of the fund and stop the loss or profit in time. From today on, we will build a building foundation and take you to realize a fund query robot. At present, we can mainly query the data of the specified date period of the fund and view the trend chart of the net value of the fund, and slowly add new functions later.
2, Start thinking
2.1 environmental preparation
- Linux, Mac and Windows are OK
- python 3.7 and above
- Relevant third-party packages: pandas (data processing), requests (crawling data), re (text content analysis), akshare (obtaining fund stock data), matplotlib (data visualization), dataframe image (transforming dataframe table into picture)
2.2 obtain fund data of specified date period
Fund data can be obtained from some financial related websites, such as Tiantian fund website and Sina fund website. You can write your own crawler program to obtain website data, or use the ready-made toolkit to obtain data, such as: One line code to obtain stock and fund data, and draw K-line chart akshare used in.
Here we also introduce the following two methods:
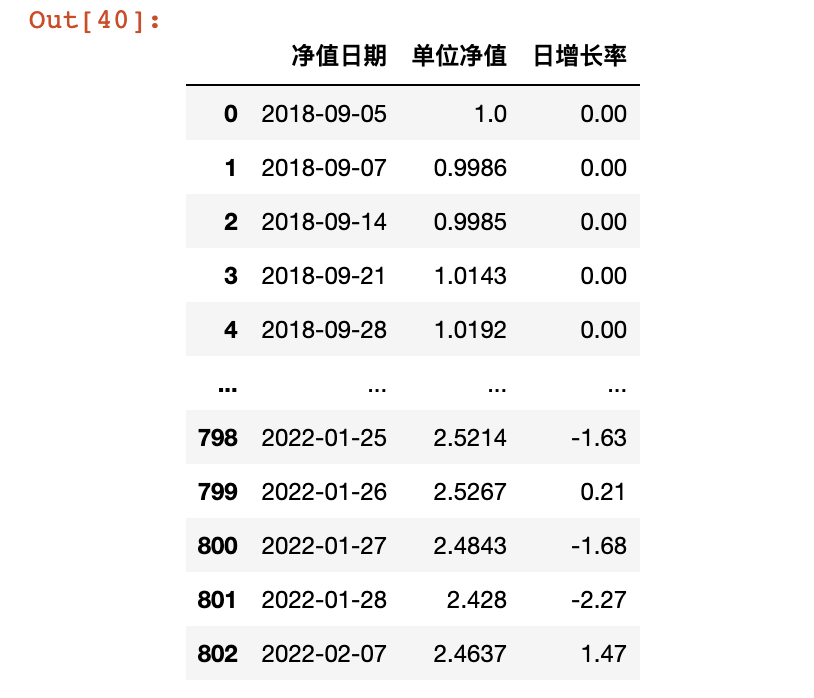
2.2.1 review the fund data obtained by akshare
At present, akshare does not support obtaining the fund net value data within the specified date range, but you can obtain the fund historical net value data at one time and call the function fund_em_open_fund_info obtains the historical data of the fund, and then selects the time break according to the date for analysis.
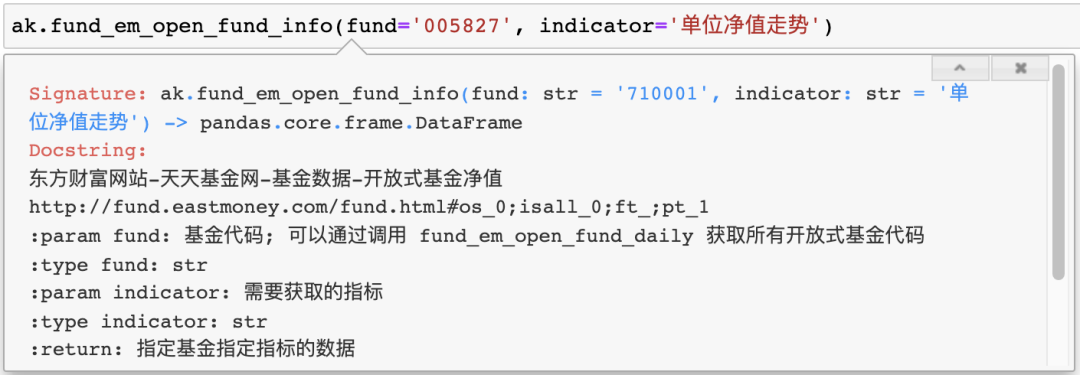
import akshare as ak
fund_data = ak.fund_em_open_fund_info(fund='005827', indicator='Trend of unit net worth')

print(fund_data)
Call the ready-made data interface by yourself
In essence, akshare also obtains data from some financial related websites, and we can also write our own code to obtain it. Through the browser, we can quickly search the fund data interface, the daily fund network from Oriental wealth.
f'http://fund.eastmoney.com/f10/F10DataApi.aspx?type=lsjz&code={code}&page={page}&sdate={start_date}&edate={end_date}&per={per}'

code - Fund code
page - Fund data page
start_date - Data start date
end_date - Data end date
per - Amount of data displayed per page, up to 40
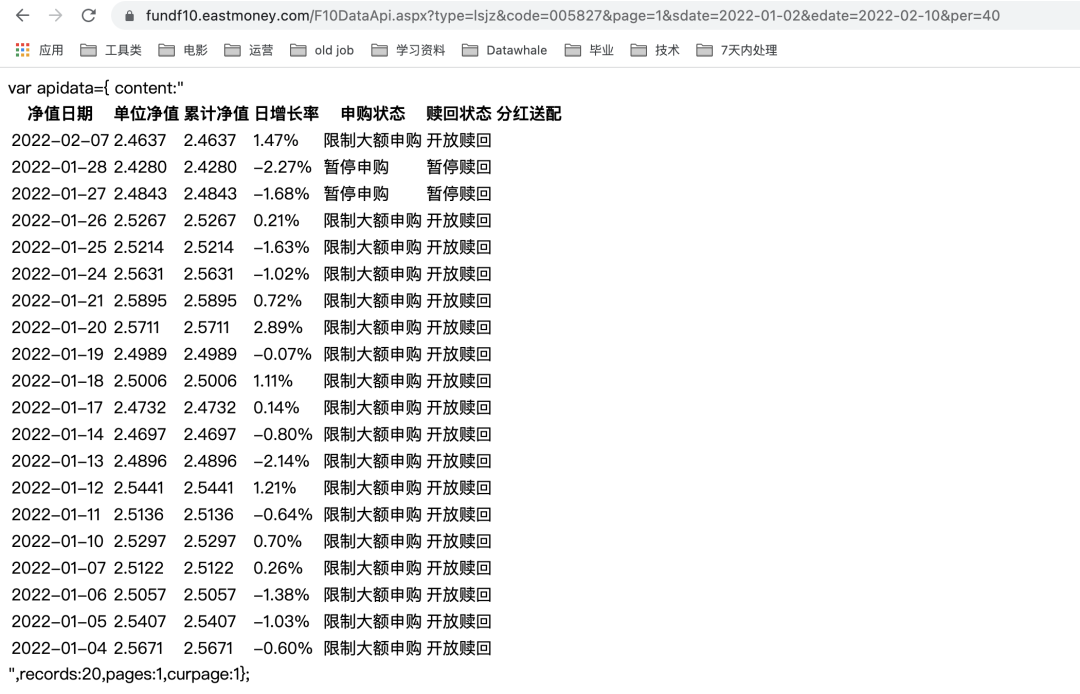
According to the specified parameters, the browser will return the specified parameters and a js assignment code, including fund data (content), total records, total pages and current pages.
The format is very regular. We can extract data directly through regularization,
'''
Get single page fund data
'''
def get_html(code, start_date, end_date, page=1, per=40):
    url = f'http://fund.eastmoney.com/f10/F10DataApi.aspx?type=lsjz&code={code}&page={page}&sdate={start_date}&edate={end_date}&per={per}'
    # print(url)
    rsp = requests.get(url)
    html = rsp.text

    return html
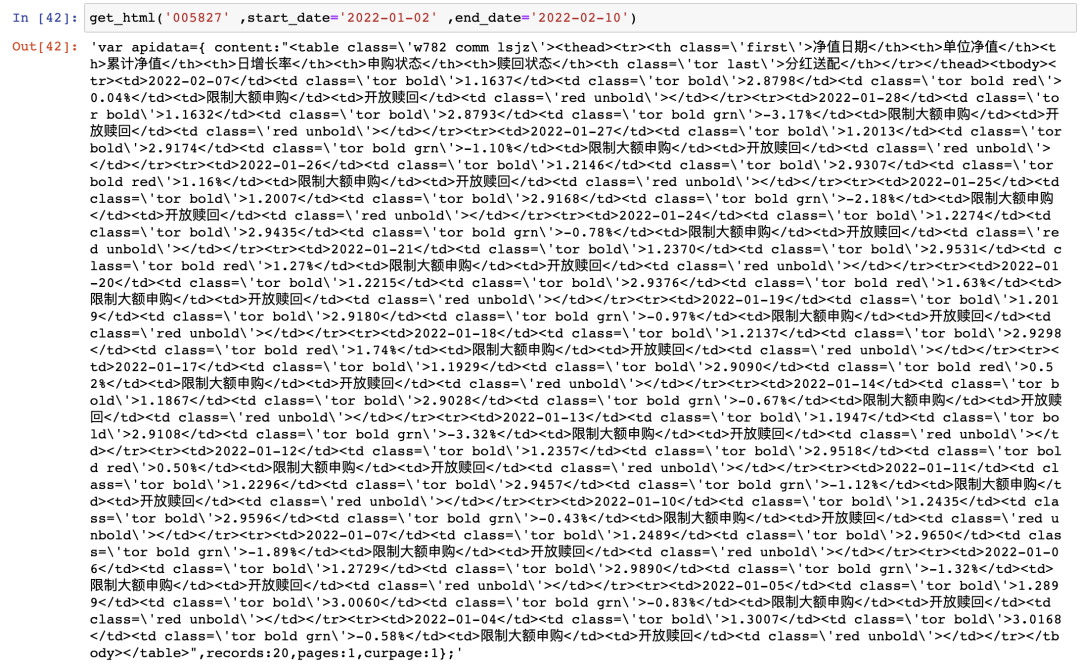
Through the returned data, we can find that the fund data part is an html code wrapped by the table tag, so we can directly use pandas read_html to parse the data.
# Parse the data table part from html and parse it into df
def parses_table(html):
    # Get fund data sheet
    pattern = 'content:"<table(.*)</table>",'
    table = re.search(pattern, html).group(1)
    table = '<table' + table + '</table>'
    fund_data = pd.read_html(table)[0]
    return fund_data
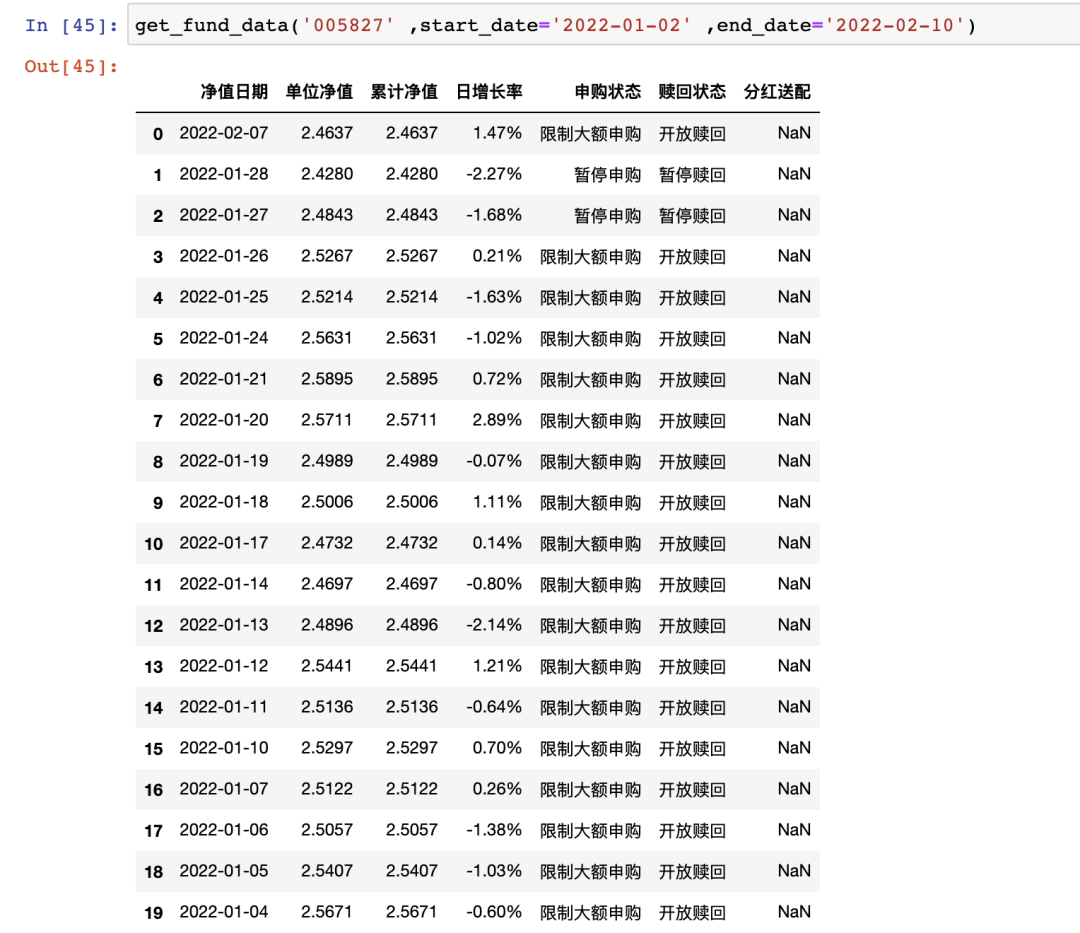
As mentioned earlier, the fund data interface can display up to 40 pieces of data per page. Therefore, in order to obtain all data, we may need to traverse each page, so we also need to obtain the total pages through regular pages, and then traverse and call get_html and parses_ The table function parses all the data.
# Obtain the cumulative net value and other data within the specified date
def get_fund_data(code, start_date, end_date):
    first_page = get_html(code, start_date, end_date)
    # Get total pages
    pattern = 'pages:(.*),'
    pages = re.search(pattern, first_page).group(1)
    # Convert to int data
    try:
        pages = int(pages)
    except Exception as e:
        r = f'[Error message]{e}'
        # print(r)
        return r

    # Store the fund data obtained on each page in dataframe format for later consolidation
    fund_df_list = []

    # Cycle to facilitate all pages
    for i in range(pages):
        if i == 0:
            fund_data = parses_table(first_page)
        else:
            page_html = get_html(code, start_date, end_date, page=i+1)
            fund_data = parses_table(page_html)
        fund_df_list.append(fund_data)

    # Merge data from each page together
    fund_df = pd.concat(fund_df_list)

    return fund_df
The above two methods can obtain the fund net value data. Finally, I chose akshare to obtain it. I set a regular task to update all the data of the fund I pay attention to at three o'clock every day and store it locally. When I want to query later, I can directly read the local file for query.
- Scheduled task: obtain all concerned fund historical data at 3 a.m. every day and store them locally
# Scheduled task: obtain all concerned fund historical data at 3 a.m. every day and store them locally
def get_all():
    try:
        # Read the fund code list you are interested in from the file
        with open('./FD/funds.txt') as f:
            funds = [i.strip() for i in f.readlines()]
        # Traverse the updated data one by one
        for fund in funds:
            fund_df = ak.fund_em_open_fund_info(fund, indicator='Trend of unit net worth')
            fund_df = fund_df.sort_values(by=['Net worth date'], ascending=False)
            fund_df.to_csv(f"./FD/DATA/F{fund}_data.csv", index=False)
            # print(f"./FD/DATA/F{fund}_data.csv")
            time.sleep(random.randint(1,5))
        return 'Fund data update completed'
    except Exception as e:
        r = f"[Error message]{e}"
        return r
- Get the net value data of the specified fund on the specified date period
# Get the net value data of the specified fund on the specified date period
def get_fund_data(fund, start_d, end_d):
    fund_df = pd.read_csv(f'./FD/DATA/{fund}_data.csv')
    result_df = fund_df.query(f"'{start_d}'<=Net worth date<='{end_d}'")
    return result_df
2.3 presentation method of returned data
At present, the setting rules are as follows:
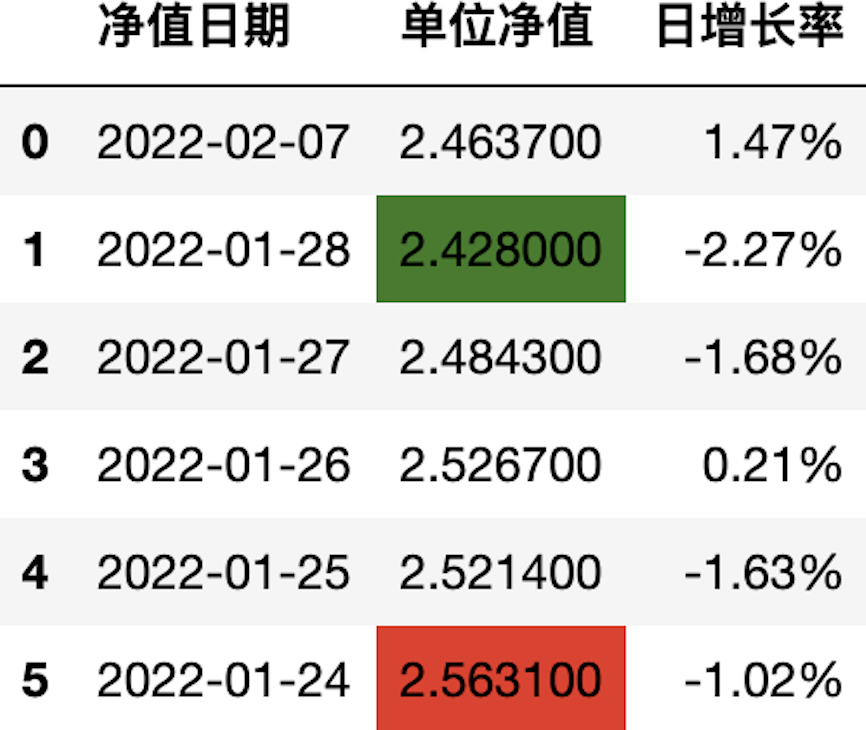
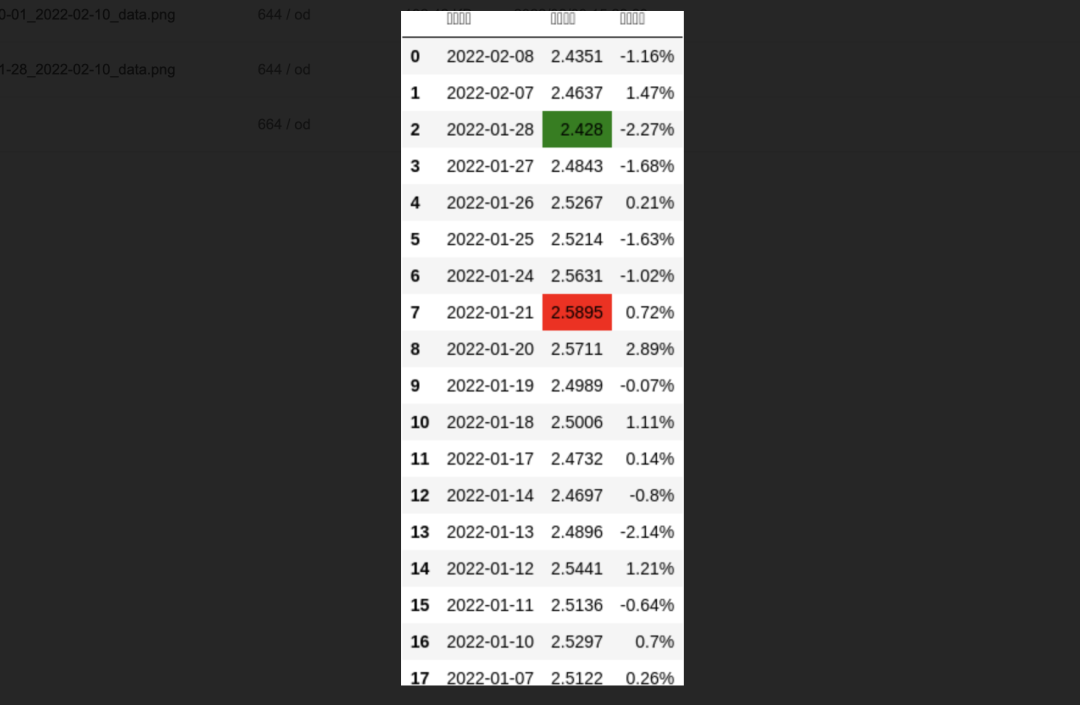
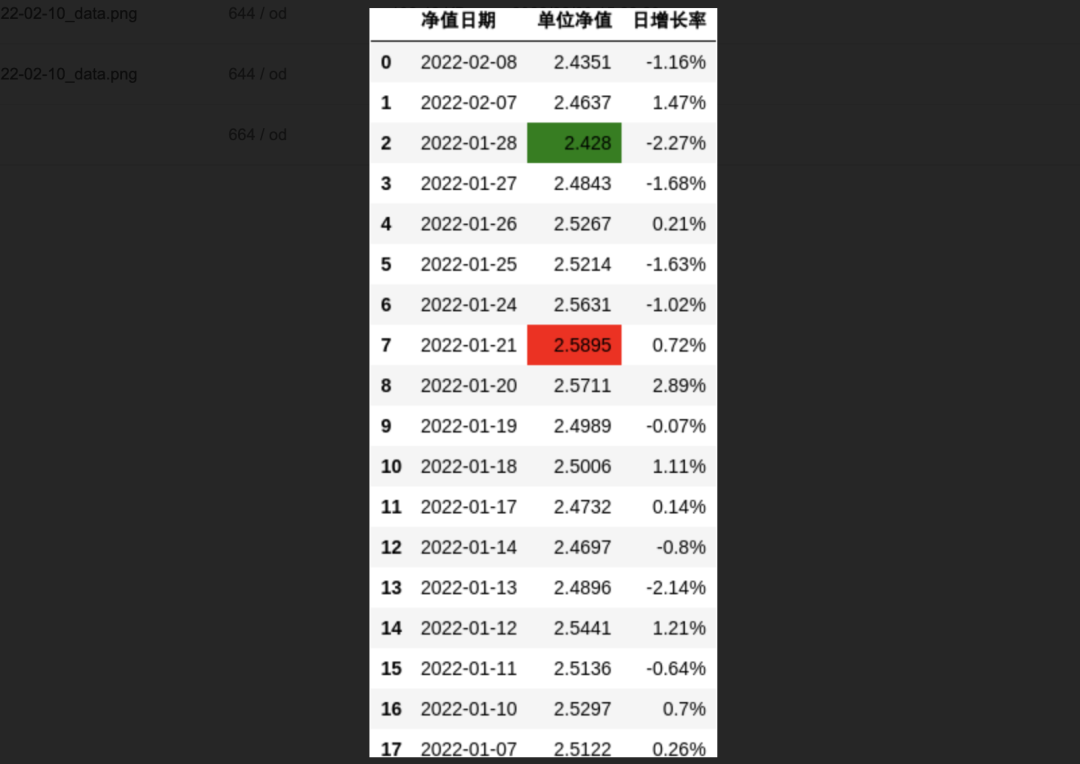
- 1) If the amount of data is less than or equal to 30, the original data graph is returned
The original data graph is to directly convert the obtained data into pictures and send them to users. Here, we use the third-party package dataframe image, which is very simple to use. After pip is installed, we can quickly convert datafrmae data into pictures by directly calling the export function.
# Convert dtaframe table to picture
def df_to_img(fund_df, fund, start_d, end_d):
    if fund_df.shape[0] <=1:
        dfi.export(fund_df, f'./FD/IMG/{fund}_{start_d}_{end_d}_data.png')
        return

    # Format table highlight max min
    fund_df = fund_df.style.highlight_max(subset=['Average NAV'], color='red')\
             .highlight_min(subset=['Average NAV'], color='green')\
             .format({'Daily growth rate': '{:}%'})

    dfi.export(fund_df, f'./FD/IMG/{fund}_{start_d}_{end_d}_data.png')
For better picture data, we also use DF Style set the data table style (highlight the maximum value and minimum value of unit net worth and add a percentage sign to the daily growth rate).
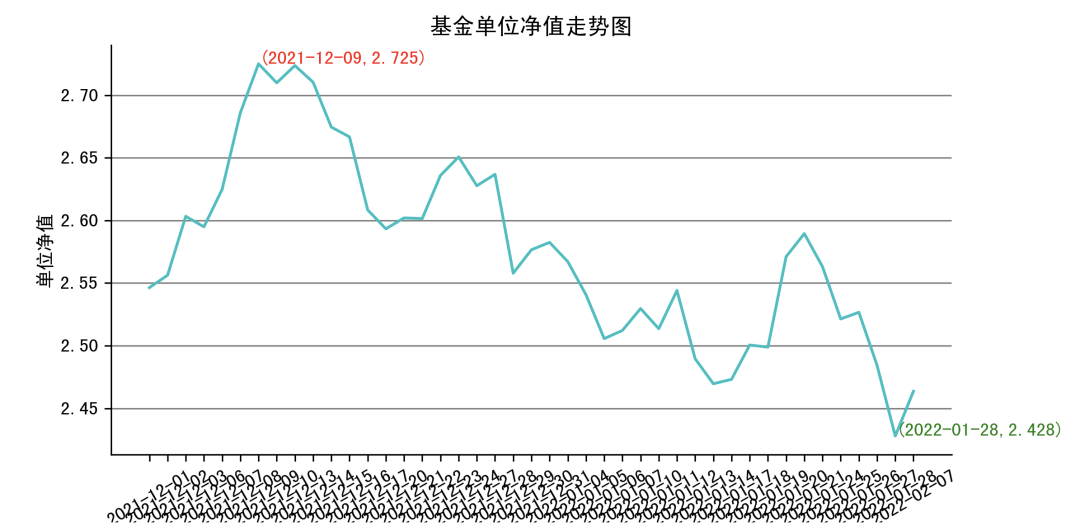
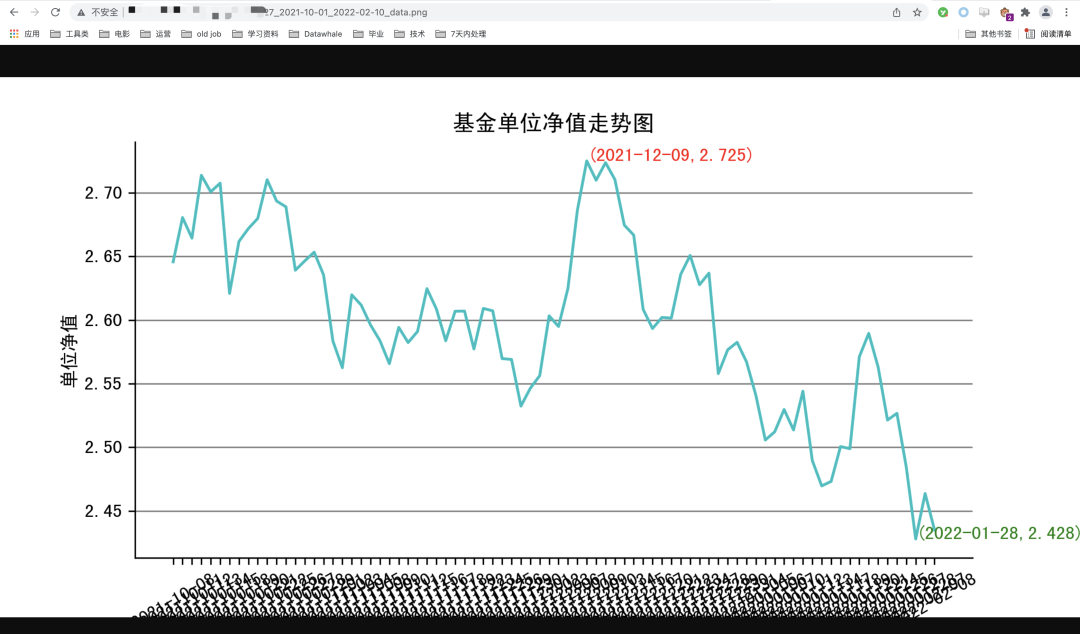
- 2) If the amount of data is more than 30, the original data trend chart will be returned
The original data trend chart is to visualize the data and then return it to the user. Here, we choose to draw the data trend chart and use matplotlib to draw it.
# Draw the trend chart of net value of fund units
def draw_fund_line(fund_df, fund, start_d, end_d):
    plt.rcParams['figure.figsize'] = (8.0, 4.0) # Setting figure_size size
    plt.rcParams['savefig.dpi'] = 300 #Save picture resolution

    # The right and top borders are not displayed
    ax=plt.gca()
    ax.spines['right'].set_color('none')
    ax.spines['top'].set_color('none')

    # Set coordinate grid
    plt.grid(axis="y", color='gray')

    # Calculate the maximum and minimum coordinates and mark them in the figure
    fund_max = fund_df.loc[fund_df['Average NAV'].idxmax()]
    fund_min = fund_df.loc[fund_df['Average NAV'].idxmin()]

    ax.annotate(f'({fund_max[0]},{fund_max[1]})', xy=(fund_max[0], fund_max[1]), color='red')
    ax.annotate(f'({fund_min[0]},{fund_min[1]})', xy=(fund_min[0], fund_min[1]), color='green')

    # Draw a picture
    plt.plot(fund_df['Net worth date'],fund_df['Average NAV'], color="c")
    plt.title('Trend chart of net value of fund units')
    plt.xticks(rotation=30)
    plt.xlabel('Net worth date')
    plt.ylabel('Average NAV')
    plt.savefig(f'./FD/IMG/{fund}_{start_d}_{end_d}_data.png')
The line chart is used here. There are some settings for the picture style, such as size, border and maximum / minimum value annotation, but it is still not very beautiful. Continue to optimize later.
- Full call
# Return data
def response_data(fund, start_d, end_d):
    # Check whether the query result already exists locally
    imgs = os.listdir('./FD/IMG/')
    if f'{fund}_{start_d}_{end_d}_data.png' in imgs:
        return f'./FD/IMG/{fund}_{start_d}_{end_d}_data.png'

    # get data
    fund_df = get_fund_data(fund, start_d, end_d)

    # If the amount of data is less than or equal to 30, the original data graph is returned
    if fund_df.shape[0]<= 30:
        df_to_img(fund_df, fund, start_d, end_d)
    else:
        # Otherwise, the data trend chart will be returned
        fund_df = fund_df.sort_values(by=['Net worth date'])
        draw_fund_line(fund_df, fund, start_d, end_d)

    return f'./FD/IMG/{fund}_{start_d}_{end_d}_data.png'
2.4 setup daemon of docking nail robot
At present, two kinds of robots introduced before are used in the project: nail group robot and enterprise robot. The relevant configuration methods and codes can be viewed in the previous articles: How to send alarm notification to nail in Python? and How to build a nail robot that can reply automatically , very detailed.
Nail group robots are mainly used to automatically report the fund data update every day, and the fund rise and fall detection can be added later.
The enterprise robot is mainly used for the automatic reply function of fund data query, and can also expand the initiative to send messages to users, which will be studied later.
2.5 problems encountered and Solutions
2.5.1 error in converting datafrmae image to image on Linux
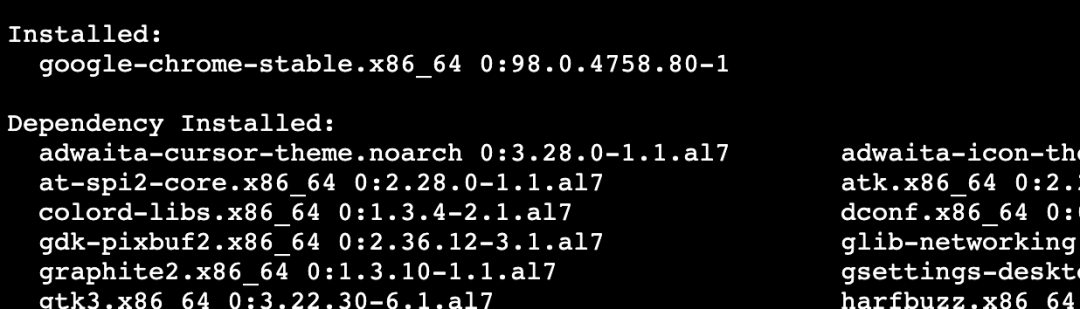
At first, I was prompted that there was no chrom e, and then I installed Google Chrome according to the online tutorial.
reference resources: https://segmentfault.com/a/1190000022425145
After installation, run the code to prompt SyntaxError: not a PNG file.
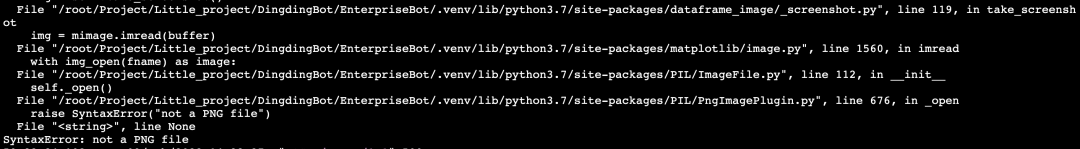
Looking at the error prompt, I thought it was the problem of pilot and matplotlib. It can't be modified to the same version as the local version.
Finally, after looking at the source code, I found that the conversion method can not only use chrom e, but also use matplotlib. After modification, the picture can be generated normally, but there is no format!!!
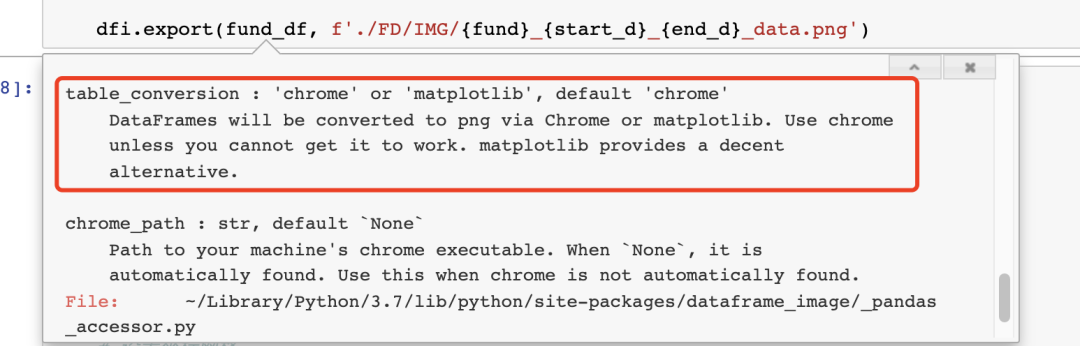
Finally, change back to the default table_conversion, look carefully and find the following prompt, which roughly means that you can't directly use the root user permission under linux to allow Google chrome. The simplest way is to create an ordinary user.
[0209/162730.350381:ERROR:zygote_host_impl_linux.cc(90)] Running as root without --no-sandbox is not supported. See https://crbug.com/638180
Under the root permission, create a new user od, grant the / root directory permission to it, and then enter the su command to switch to the new user.
useradd od
chown -R od /root
su od
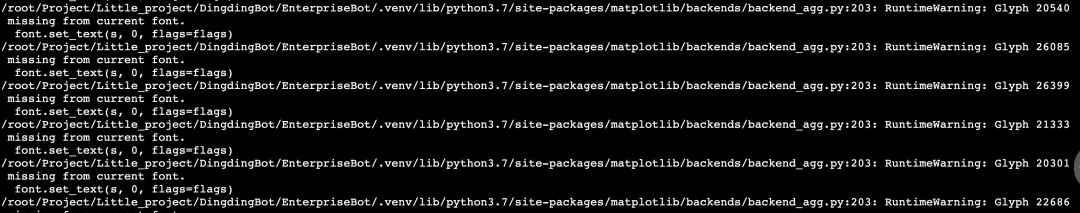
Running again can really solve the problem of image generation and data format, but there is a new problem: the header Chinese cannot be displayed...
All kinds of searching, looking at the source code debugging and the project warehouse have not been solved. Finally, I suddenly thought that I can do it locally. The versions of the two packages are the same. It should not be a code problem. Is it because there is no Chinese font installed in linux, so I can't display Chinese?
Under the permission of root user, first create a directory to store Chinese fonts. After creation, you can directly use pagoda to upload the local SimHei fonts to the corresponding directory.
mkdir -p /usr/share/fonts/my_fonts
You can check whether the Chinese font is successfully installed through the following instructions,
fc-list :lang=zh

Run the code again and the generated picture will be normal ~ happy!
2.5.2 Chinese display of Matplotlib pictures
Detailed solutions have been written before. You can directly view the previous articles: Permanently solve matplotlib Chinese garbled code
2.5.3 the nail robot cannot transmit pictures directly
At present, the nailing robot only supports transmission: normal text, markdown text, connection, actionCard message and feedCard message types.
If I want to send the generated fund data map to users, the best way is to turn the picture into a link and then transmit it in the form of markdown.
If the system is only for personal use and the amount of data is small, we don't have to choose the existing drawing bed tool on the network (so we have to write interface docking code). We can directly open an http port to share our pictures. Our enterprise robots use flash, so we can realize this function more simply.
app = Flask(__name__, static_folder='xxx/FD/IMG', static_url_path='/static')
When initializing the flash app, specify the directory where the static file is located and the static file routing suffix. In this way, we can access the corresponding image through: http: / / server IP address: port number / static / image file name.
Then embed the picture link into markdown and return to the user normally.
2.6 final effect drawing
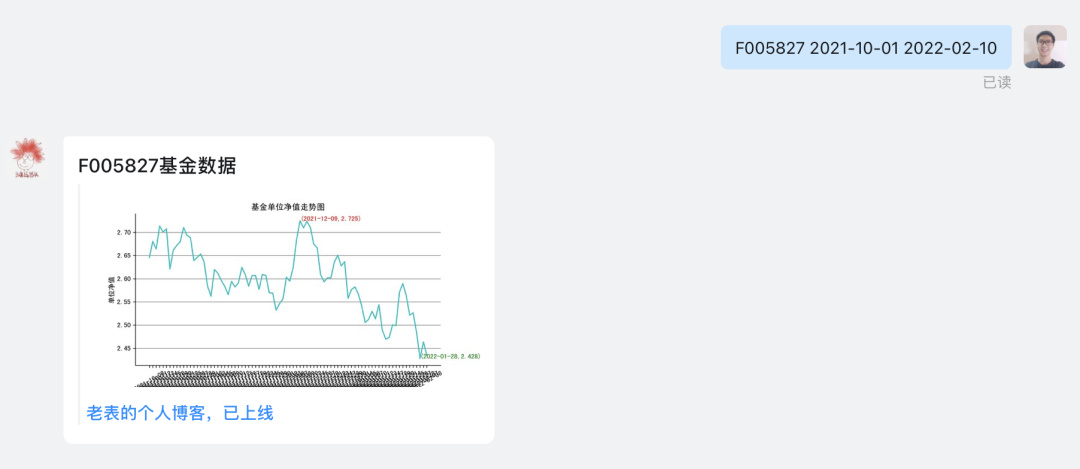
- Specify query
View the fund net value data of a fund in a certain period of time. (data less than 30 items are displayed in tables; more than 30 items are displayed in trend charts) Query format: F fund code start date end date, for example: F005827 2021-12-03 2022-02-10
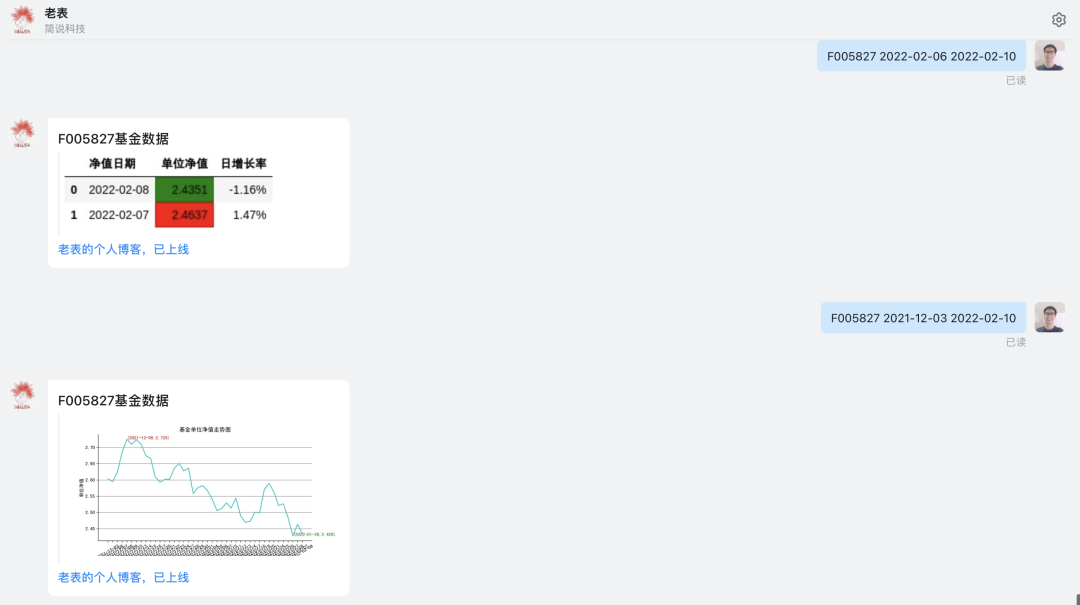
design sketch
- General query
View the net value and daily growth rate data + trend chart of a fund in recent 10 days Query format: F fund code, such as F005827
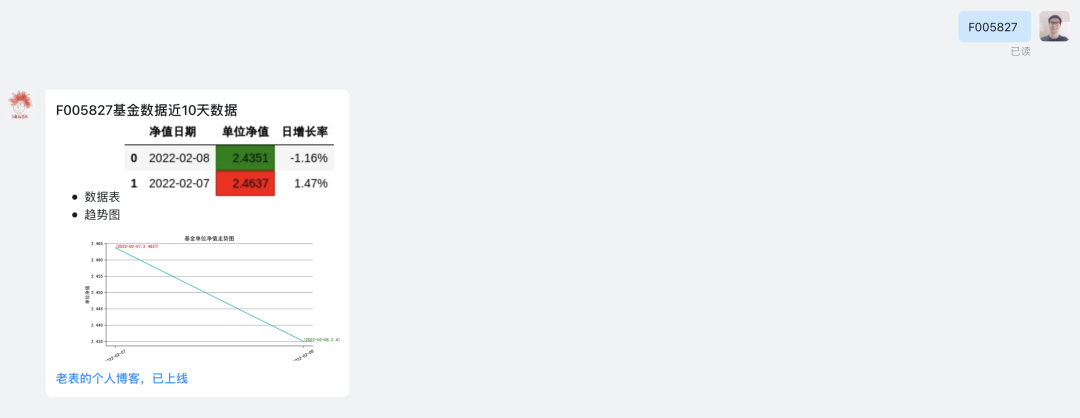
In the last 10 days, there are only two trading days
3, Later speech and later language
This project is neither small nor large. The native test of 100 lines of code is still very smooth. It is mainly due to some problems after migrating to Linux, from the initial python version problem (installing a 3.7.9), to the datafrmae image problem, extended Linux Installation Google, setting up new users, assigning permissions, and source code test learning.
The process of encountering and solving problems did take me a long time and once bothered me. However, this process also made me feel very beneficial. It is a process of continuous accumulation, practice and consolidation. After solving problems, I will cheer for myself.
At present, the fund monitoring robot is still relatively simple, and even has no monitoring function (at present, it only supports data query and update), but the building foundation is very stable and deep, and adding other functions later will be much simpler and more convenient. Please leave a message in the comment area and talk about the functions you want to add for this robot.