install
Select the appropriate download method here: https://software.intel.com/content/www/cn/zh/develop/tools/oneapi/base-toolkit/download.html
If there is no GUI, use the command in Command Line Installation to download and install. My is this:
wget https://registrationcenter-download.intel.com/akdlm/irc_nas/17769/l_BaseKit_p_2021.2.0.2883.sh
sudo bash l_BaseKit_p_2021.2.0.2883.sh
Note that when installing on the command line, the terminal window should be large enough, otherwise the display is incomplete.
Running sample project
After installation, you can use vscode to connect to the server and use vtune. Official tutorial: https://software.intel.com/content/www/us/en/develop/documentation/get-started-with-intel-oneapi-base-linux/top/run-a-sample-project-with-vscode.html
Here is a brief introduction to the basic usage.
First, install two plug-ins: Sample Browser for Intel oneAPI Toolkits and Environment Configurator for Intel oneAPI Toolkits
Then press Ctrl+Shift+P, enter Intel oneAPI, and click Intel oneAPI: Initialize environment variables to automatically find the installation directory (if installed under the default / opt/intel/oneapi).
Then click the oneapi icon in the leftmost navigation bar, it will prompt that oneapi cli cannot be found, ask you whether to download it, and click Yes. However, the download may fail. At this time, it may be necessary to https://github.com/intel/oneapi-cli Manually download it and upload it to the server, then rename it oneapi CLI and put it in / usr/local/bin. Remember to give execution permission.
Then select CPP - > get started - > base: Vector Add, and click the plus sign on the right. After editing the path, vscode will create a new sample project and open it in a new window. You can view README.md, which contains the introduction and operation process of the sample project. For the example Vector Add, the process is:
First Ctrl+Shift+P run Intel oneAPI: Initialize environment variables, then create a new terminal, and execute:
make all
./vector-add-buffers
Running on device: Intel(R) Xeon(R) Platinum 8269CY CPU @ 2.50GHz
Vector size: 10000
[0]: 0 + 0 = 0
[1]: 1 + 1 = 2
[2]: 2 + 2 = 4
...
[9999]: 9999 + 9999 = 19998
Vector add successfully completed on device.
vtune
vtune tutorial: https://software.intel.com/content/www/us/en/develop/documentation/get-started-with-vtune/top.html
If it is used on the server, it mainly depends on the usage of the command line interface: https://software.intel.com/content/www/us/en/develop/documentation/vtune-help/top/command-line-interface/command-syntax.html
Note that if you open an ordinary terminal instead of using it in vscode, you should first
source /opt/intel/oneapi/setvars.sh
You can run vtune --help to view the basic usage and vtune -help collect to view the performance data that can be collected.
example:
vtune -collect hotspots -result-dir hotspots -quiet ./vector-add-buffers
Note that this. / cannot be omitted- collect can be abbreviated to - c, - result dir can be abbreviated to - r, and - quiet can be abbreviated to - q.
Output:
vtune: Warning: Hardware collection of CPU events is not possible on this system. Microarchitecture performance insights will not be available.
Running on device: Intel(R) Xeon(R) Platinum 8269CY CPU @ 2.50GHz
Vector size: 10000
[0]: 0 + 0 = 0
[1]: 1 + 1 = 2
[2]: 2 + 2 = 4
...
[9999]: 9999 + 9999 = 19998
Vector add successfully completed on device.
vtune: Warning: Cannot locate debugging information for file `/lib/x86_64-linux-gnu/libgcc_s.so.1'.
vtune: Warning: Cannot locate debugging information for file `/opt/intel/oneapi/vtune/2021.2.0/lib64/runtime/libittnotify_collector.so'.
vtune: Warning: Cannot locate debugging information for file `/opt/intel/oneapi/compiler/2021.2.0/linux/lib/libOpenCL.so.1'.
vtune: Warning: Cannot locate debugging information for file `/opt/intel/oneapi/vtune/2021.2.0/lib64/libtpsstool.so'.
vtune: Warning: Cannot locate debugging information for file `/usr/lib/x86_64-linux-gnu/libstdc++.so.6'.
vtune: Warning: Cannot locate debugging information for file `/lib64/ld-linux-x86-64.so.2'.
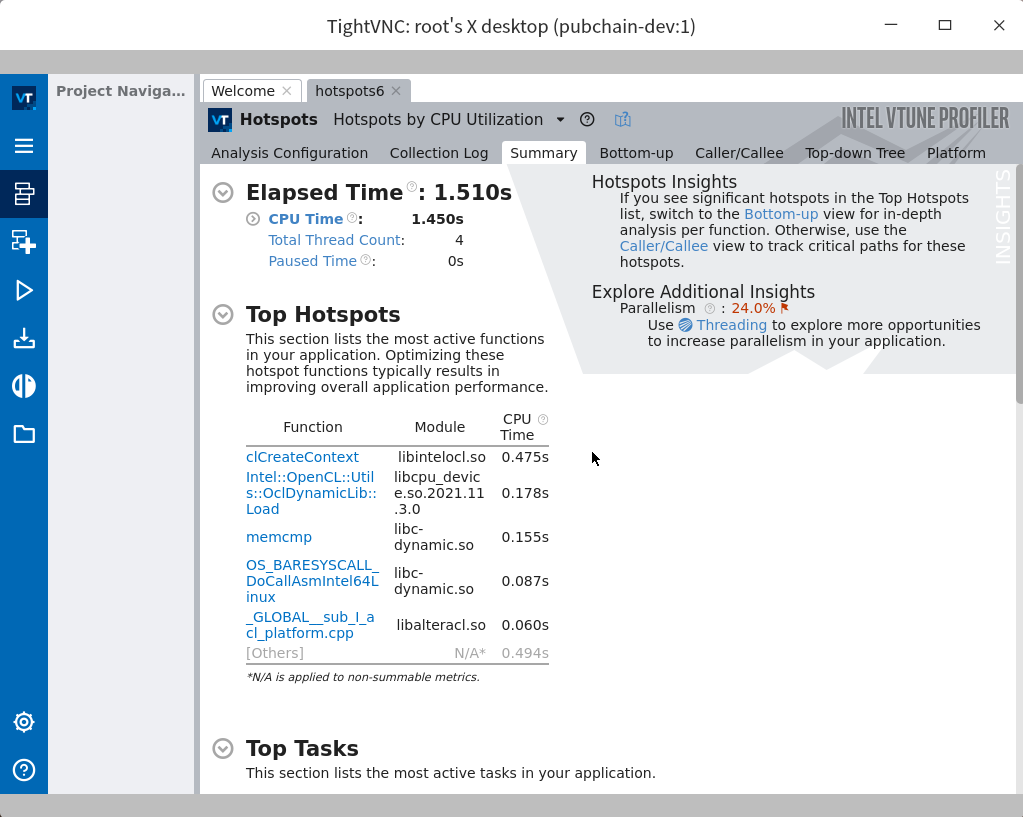
Elapsed Time: 1.510s
CPU Time: 1.450s
Effective Time: 1.450s
Idle: 0.030s
Poor: 1.420s
Ok: 0s
Ideal: 0s
Over: 0s
Spin Time: 0s
Imbalance or Serial Spinning: 0s
Lock Contention: 0s
Other: 0s
Overhead Time: 0s
Creation: 0s
Scheduling: 0s
Reduction: 0s
Atomics: 0s
Other: 0s
Total Thread Count: 4
Paused Time: 0s
Top Hotspots
Function Module CPU Time
----------------------------------------- ---------------------------- --------
clCreateContext libintelocl.so 0.475s
Intel::OpenCL::Utils::OclDynamicLib::Load libcpu_device.so.2021.11.3.0 0.178s
memcmp libc-dynamic.so 0.155s
OS_BARESYSCALL_DoCallAsmIntel64Linux libc-dynamic.so 0.087s
_GLOBAL__sub_I_acl_platform.cpp libalteracl.so 0.060s
[Others] N/A 0.494s
Top Tasks
Task Type Task Time Task Count Average Task Time
---------------- --------- ---------- -----------------
tbb_parallel_for 0.086s 11 0.008s
tbb_custom 0.033s 8 0.004s
Collection and Platform Info
Application Command Line: ./vector-add-buffers
Operating System: 4.15.0-144-generic DISTRIB_ID=Ubuntu DISTRIB_RELEASE=18.04 DISTRIB_CODENAME=bionic DISTRIB_DESCRIPTION="Ubuntu 18.04.5 LTS"
Computer Name: pubchain-dev
Result Size: 7.2 MB
Collection start time: 06:18:08 19/09/2021 UTC
Collection stop time: 06:18:10 19/09/2021 UTC
Collector Type: User-mode sampling and tracing
CPU
Name: Intel(R) Xeon(R) Processor code named Cascadelake
Frequency: 2.500 GHz
Logical CPU Count: 4
Cache Allocation Technology
Level 2 capability: not detected
Level 3 capability: not detected
If you want to skip descriptions of detected performance issues in the report,
enter: vtune -report summary -report-knob show-issues=false -r <my_result_dir>.
Alternatively, you may view the report in the csv format: vtune -report
<report_name> -format=csv.
View results
Run vtune -help report to see how the report is generated. The simplest example:
vtune -report hotspots -r <Result directory>
Or generate a summary (in fact, the one that just finished running the output):
vtune -report summary -r hotspots6/
Or transfer the result directory locally, and then install vtune locally
vtune-gui <Result directory>
To see the results. Related documents: https://software.intel.com/content/www/us/en/develop/documentation/vtune-help/top/command-line-interface/working-with-results-from-the-command-line/viewing-command-line-results-in-the-gui.html
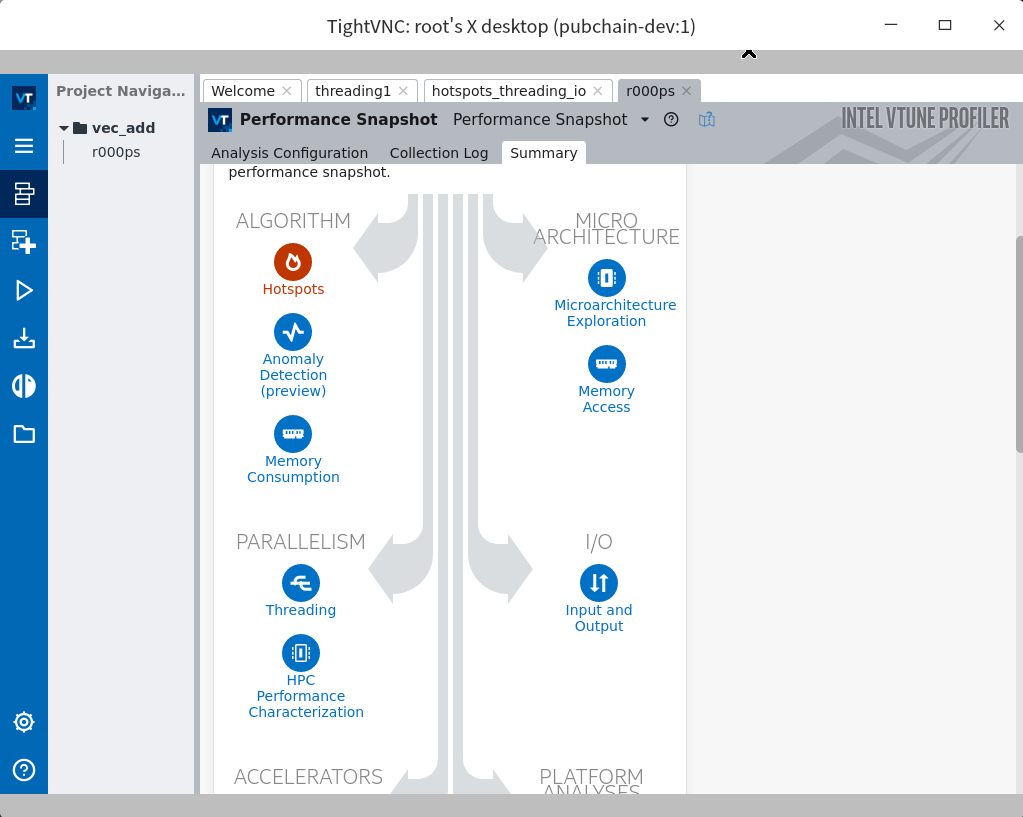
Or you can refer to this article: vnc connects to the Linux server through ssh tunnel , then directly open the result file with the VTune GUI on the server and display the window locally:
In fact, through vnc, you can directly build a vtune project for performance testing: