Vmstat is the abbreviation of virtual memory statistics, which can monitor the virtual memory, process and CPU activity of the operating system. He makes statistics on the overall situation of the system. The disadvantage is that it is unable to make an in-depth analysis of a process. The vmstat tool provides a low overhead way to observe system performance. Because vmstat itself is a low overhead tool, you need to check and monitor the health of the system on very high load servers. You can still use vmstat to output results in the control window
Difference between physical memory and virtual memory
Reading and writing data directly from physical memory is much faster than reading and writing data from hard disk. Therefore, we hope that all data reading and writing are completed in memory, and the memory is limited, which leads to the concept of physical memory and virtual memory.
Physical memory is the size of memory provided by the system hardware. It is real memory. Compared with physical memory, there is also a concept of virtual memory under linux. Virtual memory is a strategy proposed to meet the shortage of physical memory. It is a piece of logical memory virtualized by using disk space. The disk space used as virtual memory is called Swap Space.
As an extension of physical memory, linux will use the virtual memory of the swap partition when the physical memory is insufficient. More specifically, the kernel will write the temporarily unused memory block information to the swap space. In this way, the physical memory is released and this memory can be used for other purposes. When the original content is needed, This information will be re read from the swap space into physical memory.
The memory management of linux adopts the paging access mechanism. In order to make full use of the physical memory, the kernel will automatically exchange the infrequently used data blocks in the physical memory to the virtual memory at an appropriate time, and keep the frequently used information to the physical memory.
To deeply understand the memory operation mechanism of linux, you need to know the following aspects:
- First, the Linux system will exchange pages from time to time to keep as much free physical memory as possible. Even if there is nothing to need memory, Linux will exchange temporarily unused memory pages. This avoids the time required to wait for the exchange.
- Secondly, page exchange in linux is conditional. Not all pages are exchanged to virtual memory when not in use, The linux kernel has been used most frequently recently "The algorithm only exchanges some infrequently used page files into virtual memory. Sometimes we see such a phenomenon: there is still a lot of physical memory in linux, but the exchange space is also used. In fact, this is not surprising. For example, when a process that occupies a lot of memory runs, it needs a lot of memory resources, and there will be some infrequently used page files Pieces are exchanged into the virtual memory, but later, when the process that occupies a lot of memory resources ends and releases a lot of memory, the page file just exchanged will not be automatically exchanged into the physical memory. Unless it is necessary, the physical memory of the system will be much idle at the moment, and the exchange space is also being used, which leads to the phenomenon just mentioned. Don't worry about this, just know what's going on.
- Finally, the pages of swap space will be swapped to physical memory first. If there is not enough physical memory to hold these pages at this time, they will be swapped out immediately. In this way, there may not be enough space in virtual memory to store these swap pages, which will eventually lead to problems such as false crash and service exception in linux, Although linux can recover itself in a period of time, the recovered system is basically unavailable.
Virtual memory principle
Every process running in the system needs to use memory, but not every process needs to use the memory space allocated by the system all the time. When the memory required for the system operation exceeds the actual physical memory, the kernel will release some or all of the unused physical memory occupied by some processes, store this part of the data on the disk until the next call of the process, and provide the released memory to the processes in need.
In Linux memory management, the above memory scheduling is mainly completed through "paging" and "switching Swapping". Paging algorithm is to replace the recently unused pages in memory to disk, and keep the active pages in memory for the process to use. Exchange technology is to exchange the whole process, not part of the page, to the disk.
The process of writing pages to disk is called page out, and the process of returning pages from disk to memory is called page in. When the kernel needs a page, but it is found that the page is not in physical memory (because it has been page out), a Page Fault occurs.
When the system kernel finds that the runnable memory becomes less, it will release part of the physical memory through page out. Although page out does not occur frequently, if page out occurs frequently, the system performance will decline sharply until the kernel manages pages for more than the time of running the program. At this time, the system has been running very slowly or has entered a pause state, which is also called thrashing.
Command format
vmstat [-a] [-n] [-S unit] [delay [ count]]
vmstat [-s] [-n] [-S unit]
vmstat [-m] [-n] [delay [ count]]
vmstat [-d] [-n] [delay [ count]]
vmstat [-p disk partition] [-n] [delay [ count]]
vmstat [-f]
vmstat [-V]
Command function
Used to display information about virtual memory
Command parameters
- -a: Show active and inactive memory
- -f: Displays the number of fork s since the system was started.
- -m: Display slabinfo
- -n: Each field name is displayed only once at the beginning.
- -s: Displays memory related statistics and the number of various system activities.
- delay: refresh interval. If not specified, only one result is displayed.
- count: refresh times. If the refresh times are not specified, but the refresh time interval is specified, the refresh times are infinite.
- -d: Displays disk related statistics.
- -p: Displays statistics for the specified disk partition
- -S: Displays in the specified units. The parameters are k, K, m and m, which represent 1000, 1024, 1000000 and 1048576 bytes respectively. The default unit is K (1024 bytes)
- -5: Displays vmstat version information.
Displays virtual memory usage
> vmstat | column -t

column -t is used to align the header with the data column for easy viewing
Header field description
- Procs (process):
- r: Number of processes in the run queue
- b: Number of processes waiting for IO
- Memory:
- swpd: use virtual memory size
- free: available memory size
- buff: size of memory used as buffer
- Cache: size of memory used as cache
Swap:
- si: the size of writes from swap to memory per second
- so: the amount of memory written to the swap per second
- IO: (the block size of the current Linux version is 1024bytes)
- bi: number of blocks read per second
- bo: number of blocks written per second
System:
- in: number of interrupts per second, including clock interrupts.
- cs: number of context switches per second.
- CPU (in percentage):
- us: user process execution time (user time)
- sy: system process execution time
- id: idle time (including IO waiting time), the idle time of the CPU. Expressed as a percentage.
- wa: wait for IO time
Note: if r is often greater than 4 and id is often less than 40, it indicates that the load of cpu is very heavy. If pi and po are not equal to 0 for a long time, it indicates that there is insufficient memory. If disk is often not equal to 0 and the queue in b is greater than 3, it indicates that io performance is poor. While Linux has high stability and reliability, it has good scalability and scalability. It can be adjusted for different applications and hardware environments to optimize the best performance to meet the needs of current applications. Therefore, it is very important for enterprises to understand the system performance analysis tools when maintaining the Linux system and tuning the system.
5 samples in 5 seconds
> vmstat 1 5
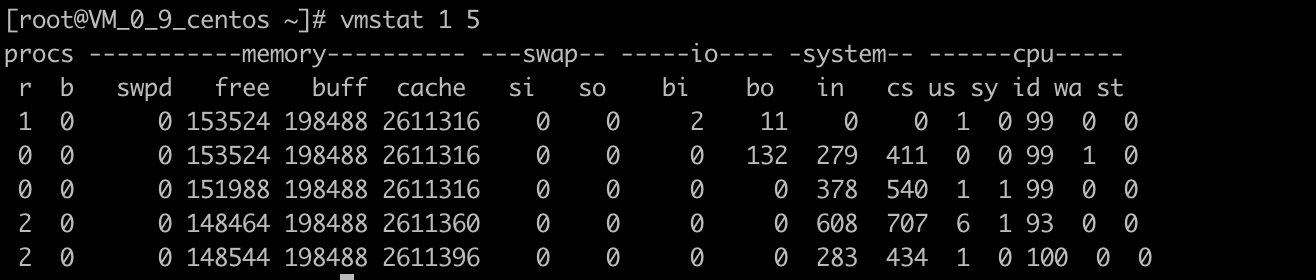
The unit is the sampling interval of 1 second 5 is the total number of samples
Show active and inactive memory
> vmstat -a 1 5
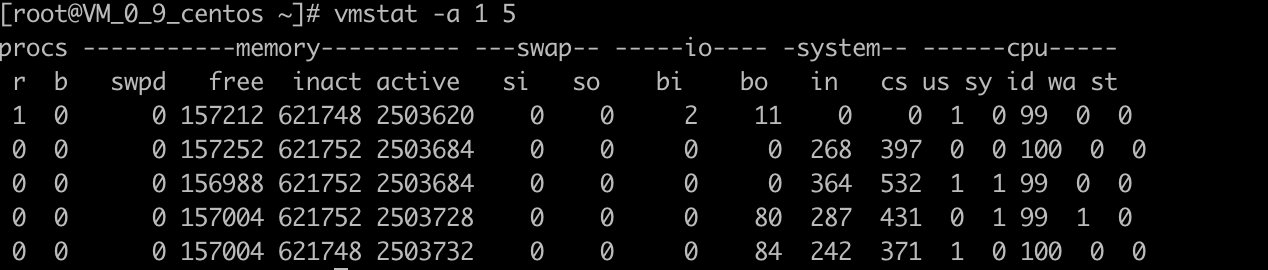
When the - a option is used to display active and inactive memory, the contents displayed are the same as those in example 1 except for adding inact and active.
Memory
- inact: inactive memory size (displayed when - a option is used)
- Active: active memory size (displayed when - a option is used)
Check how many times the system has fork ed
> vmstat -f
164889872 forks
This data is obtained from the processes field in / proc/stat
View details of memory usage
> vmstat -s
       3882032 K total memory
       921952 K used memory
      2505960 K active memory
       621748 K inactive memory
       154180 K free memory
       198460 K buffer memory
      2607440 K swap cache
            0 K total swap
            0 K used swap
            0 K free swap
    111113294 non-nice user cpu ticks
        17688 nice user cpu ticks
     52090953 system cpu ticks
  17962243142 idle cpu ticks
     20022667 IO-wait cpu ticks
            0 IRQ cpu ticks
       888181 softirq cpu ticks
            0 stolen cpu ticks
    442073539 pages paged in
   2006672432 pages paged out
            0 pages swapped in
            0 pages swapped out
    252048353 interrupts
   2496649494 CPU context switches
   1524477152 boot time
    164890019 forks
The information comes from / proc/meminfo,/proc/stat and / proc/vmstat respectively
View disk read / write
> vmstat -d

This information is mainly from / proc / diskstats Merged: indicates a write / read request from a merge. Generally, the system will merge multiple connection / adjacent read / write requests into one operation
View the read / write of / dev/sda1 disk
> vmstat -p /dev/vda1
vda1          reads   read sectors  writes    requested writes
            30818491  884145470  230580804 4013352345
This information mainly comes from / proc/diskstats.
- Reads: the number of reads from this partition.
- Read sectors: the number of read sectors from this partition.
- Writes: the number of writes from this partition.
- requested writes: the number of write requests from this partition.
View the slab information of the system
> vmstat -m
Cache                       Num  Total   Size  Pages
isofs_inode_cache            12     12    640     12
ext4_groupinfo_4k           420    420    136     30
ext4_inode_cache         208902 208995   1032     15
ext4_xattr                   92     92     88     46
ext4_free_data             1408   1408     64     64
ext4_allocation_context      64     64    128     32
ext4_io_end                3416   3528     72     56
ext4_extent_status        96068 257346     40    102
jbd2_journal_handle         170    170     48     85
jbd2_journal_head           900    900    112     36
jbd2_revoke_table_s         256    256     16    256
jbd2_revoke_record_s       1152   1664     32    128
ip6_dst_cache                36     36    448     18
RAWv6                        13     13   1216     13
UDPLITEv6                     0      0   1216     13
UDPv6                        26     26   1216     13
tw_sock_TCPv6               240    240    256     16
TCPv6                        76    135   2176     15
cfq_queue                    34     34    232     17
Cache                       Num  Total   Size  Pages
bsg_cmd                       0      0    312     13
mqueue_inode_cache           18     18    896     18
hugetlbfs_inode_cache        13     13    608     13
configfs_dir_cache           92     92     88     46
dquot                       208    208    256     16
userfaultfd_ctx_cache         0      0    128     32
fanotify_event_info        2044   2044     56     73
dnotify_mark                630    952    120     34
pid_namespace                 0      0   2176     15
posix_timers_cache            0      0    248     16
UDP-Lite                      0      0   1088     15
flow_cache                    0      0    144     28
xfrm_dst_cache                0      0    576     14
UDP                         135    135   1088     15
tw_sock_TCP                 256    256    256     16
TCP                         144    144   1984     16
scsi_data_buffer              0      0     24    170
blkdev_queue                 15     15   2128     15
blkdev_requests              63     63    384     21
Cache                       Num  Total   Size  Pages
blkdev_ioc                  195    195    104     39
user_namespace                0      0    280     14
sock_inode_cache            185    252    640     12
net_namespace                 0      0   4992      6
shmem_inode_cache           855    888    680     12
Acpi-ParseExt              3472   3472     72     56
Acpi-Namespace              510    510     40    102
taskstats                    24     24    328     12
proc_inode_cache          22416  22980    656     12
sigqueue                     50     50    160     25
bdev_cache                   38     38    832     19
sysfs_dir_cache           12276  12276    112     36
inode_cache                8602   8840    592     13
dentry                   760606 769671    192     21
iint_cache                    0      0     80     51
selinux_inode_security     9843   9843     80     51
buffer_head              337830 354003    104     39
vm_area_struct             5411   5940    216     18
mm_struct                   180    240   1600     20
Cache                       Num  Total   Size  Pages
files_cache                 173    204    640     12
signal_cache                147    168   1152     14
sighand_cache               137    180   2112     15
task_xstate                 361    361    832     19
task_struct                 202    224   4016      8
anon_vma                   2604   3162     80     51
shared_policy_node         9652  12325     48     85
numa_policy                  15     15    264     15
radix_tree_node           97524 106330    584     14
idr_layer_cache             240    240   2112     15
dma-kmalloc-8192              0      0   8192      4
dma-kmalloc-4096              0      0   4096      8
dma-kmalloc-2048              0      0   2048     16
dma-kmalloc-1024              0      0   1024     16
dma-kmalloc-512              32     32    512     16
dma-kmalloc-256               0      0    256     16
dma-kmalloc-128               0      0    128     32
dma-kmalloc-64                0      0     64     64
dma-kmalloc-32                0      0     32    128
Cache                       Num  Total   Size  Pages
dma-kmalloc-16                0      0     16    256
dma-kmalloc-8                 0      0      8    512
dma-kmalloc-192               0      0    192     21
dma-kmalloc-96                0      0     96     42
kmalloc-8192                 28     44   8192      4
kmalloc-4096                 86    128   4096      8
kmalloc-2048                354    512   2048     16
kmalloc-1024               1135   1360   1024     16
kmalloc-512                 638    688    512     16
kmalloc-256                1907   2704    256     16
kmalloc-192               99755  99855    192     21
kmalloc-128               11290  11616    128     32
kmalloc-96                 2028   2352     96     42
kmalloc-64                11465  25600     64     64
kmalloc-32                 1792   1792     32    128
kmalloc-16                 2816   2816     16    256
kmalloc-8                  3584   3584      8    512
kmem_cache_node             192    192     64     64
kmem_cache                  112    112    256     16
This set of information comes from / proc/slabinfo
Slab: there are many small objects in the kernel. These objects are constructed and destroyed very frequently, such as i-node and dentry. If these objects ask for a page (4kb) from the memory every time they are built, but in fact they only have a few bytes, it will be very wasteful. In order to solve this problem, a new mechanism is introduced to deal with how to allocate small storage areas in the same page box, The slab can allocate small objects, so that there is no need to allocate page boxes for each object, thus saving space. The kernel creates and destructs some small objects very frequently. The slab buffers these small objects, which can be reused and reduce the number of memory allocation.
Original link: https://rumenz.com/rumenbiji/linux-vmstat.html