1. Overview of volume price relationship
"Volume" has many forms, such as trading volume (number of shares), transaction amount, turnover rate and so on. "Volume" generally refers to the trading volume of a certain securities in the trading market in a specific period of time. The trading volume reflects the game of long and short forces in the market.
- The number of shares traded is generally in the unit of "hand", and the first hand is 100 shares.
- The turnover directly reflects the capital volume of the transaction.
- Turnover rate refers to the ratio of the daily trading volume of stocks to the circulating share capital of stocks, which mainly reflects the liquidity and activity of individual stocks.
"Closing price" means the closing price of a security.
There is an obvious correlation between the change of price and trading volume. Trading volume is a manifestation of market supply and demand
- When the market is in short supply, that is, when the market is better than many forces, investors will enter the market to buy stocks, and the trading volume will increase.
- On the other hand, when the market is in a cold state, the strength of stock buyers is weak, the purchase volume is small, and the trading volume may be reduced.
Generally speaking, low trading volume will be accompanied by the decrease of price, and high trading volume will be accompanied by the rise of price. When the trading volume is large and the price rises, it is suitable to be bullish; When the trading volume is small and the price decreases, it is suitable to be bearish.
2. Analysis of volume price relationship
The relationship between volume and price is not only in two simple forms: high volume and low volume. In the rising market, the price rise may correspond to the decline of trading volume; In the market, the trading volume may fall, but the trading volume may rise.
Like the price, the trading volume can be up, down and flat. Each trading volume state can be associated with three price change forms, and then there are a total of 9 corresponding relationships. Below are some common:
2.1 increase in price and volume
"Price increase and volume increase" refers to the simultaneous increase of price and trading volume, or the increase of price with the increase of trading volume.
The increase of price rise mainly occurs in the rising market. The increase of trading volume indicates the enhancement of the rising momentum of stock price, and the stock price will continue to rise.
In the relationship between medium and long-term price rise and volume increase, the medium and long-term market is rising, and the short-term price reduction correction of the stock market is a good opportunity to enter the market. The increase of price rise may occur when the bottom of the falling market picks up, and there are many positive factors in the market, indicating that the stock price is in the recovery stage, and investors can enter from the bottom and make profits when the price rising market emerges.
2.2 price rise and volume leveling
"Price rise and volume leveling" indicates that when the price continues to rise, the trading volume of stocks will no longer rise, but remain flat. That is, the trading volume changes little, and the kinetic energy of price rise may not increase any more. Price rise and volume level reflect a deviation relationship, and the deviation of volume and price releases the signal that the market may reverse.
In the rising market, the price continues to rise and the trading volume remains unchanged, which may indicate that the price is about to reach the top. If the trading volume is then flat or reduced, the price may reverse from the top to the downward trend.
In addition, the volume price deviation of price rise and leveling is not necessarily a reversal, or the market may be in an adjustment period. After some washing up of the market. After some washing up of the market, there may be price rise and volume leveling. Another state is that the price rises too sharply (such as the limit for many consecutive days), investors are unanimously optimistic about the market, buy a lot, but sell very little, and the trading volume presents a relatively mild state. At this time, the trading volume loses the significance of reflecting the market momentum. The level of price rise also reflects that the market is in an indicator repairer.
2.3 price rise and volume contraction
"Price rise and quantity contraction" is also a deviation relationship. After the horizontal adjustment of the market, there may be price rise and quantity contraction. After some adjustment, some investors are washed out, and the market participants gradually decrease in the process of washing. At the beginning of the end of the washing, the market was optimistic and the price rose, but there was less profit-making selling, and the trading volume showed a contraction.
2.4 price adjustment and volume increase
Price adjustment increases occur when the bottom of a falling market may reverse. In the falling market, the price is no longer falling but flat, but the trading volume is increasing, indicating that many forces (makers) may have made a low-level layout. There are some good news in the market, and the buyer's power is gradually increasing. Many investors predict the possible upward trend in the future, and enter at a low level to promote the rise of trading volume. In addition, in the rising market, "price adjustment and volume increase" indicates that there is a "high stagflation" in the market. When the price is high, the price will no longer rise, but the trading volume is increasing. One possibility is that the stock market is changing the "banker". Generally, the form of price adjustment and volume increase cannot be understood as that the market is in the medium-term washing and adjustment period, because the washing trading volume will shrink rather than increase.
2.5 price level and volume reduction
Generally, it appears in the early stage of a new round of rising market, the price remains stable and the trading volume is decreasing. When the market adjusts and washes dishes, there may be "price leveling and volume contraction".
2.6 increase in price decline
"Price decline and volume increase" refers to the decline of stock price when the trading volume increases.
It usually appears in the early stage of high and falling market. Investors are not optimistic about the market, the seller has great power, and investors sell a lot.
Another possibility is that in the market at the end of the decline, the long power will gradually increase and the trading volume will increase, but the competition between various forces and short forces will not raise the stock price, and the price will still fall.
2.7 price decline and leveling
"Flat price drop" means that when the price falls, the marriage remains stable. The level of price decline releases the signal of trend stabilization, but there is still no way to predict the future trend. If the "price drop and quantity level" follows the "price level and quantity level", it indicates that a downward market has begun to appear, the trading volume remains unchanged, the stock price has fallen sharply, and investors may have to consider fleeing in time.
2.8 price decline and volume contraction
Trading volume is shrinking as share prices fall.
This may happen when the market is in the consolidation period, the market price falls and some investors flee the market.
In the stage of unilateral decline, the form of "price decline and volume decline" reflects that the market is about to stop falling. The short side power is gradually exhausted, the selling power is small, and the trading volume is also decreasing.
In addition, in the unilateral downward market, the market is not good, the buyer's power is very weak, and the power to take the offer is small. There will also be a situation of "price decline and volume contraction".
3. Formulate trading strategy by combining trading volume and moving average
The steps are summarized as follows:
- Obtain the volume of trading volume data, calculate the 5-day simple moving average VolSMA5 and 10-day simple moving average VolSMA10 of trading volume, and formulate the average VolSMA of trading volume,
V o l S M A = V o l S M A 5 + V o l S M A 10 2 \displaystyle VolSMA=\frac{VolSMA5+VolSMA10}{2} VolSMA=2VolSMA5+VolSMA10 - Obtain price data, and obtain 5-day moving average and 20-day simple moving average
- Formulate trading signal: when the volume of trading volume is greater than the average VolSMA of trading volume, the buying signal is released; When the volume of trading volume is less than or equal to the mean value of trading volume VolSMA, the selling signal is released.
- When the 5-day moving average of the price rises above the 20-day moving average, the buying signal is released; On the contrary, selling releases the signal.
- Merger transaction signal. When the trading volume and moving average are released, the buyer will buy, and when the trading volume and moving average are released, the seller will sell.
- Trading strategy evaluation.
# get data
import tushare as ts
import pandas as pd
import numpy as np
token = 'Your token'   # Enter your interface key, access method and relevant permissions. See Tushare official website. This sentence cannot be copied!
pro = ts.pro_api(token)
def get_data(tscode):
	df = pro.daily(ts_code=tscode)
	df = df.loc[:, ['trade_date', 'open', 'high', 'low', 'close', 'vol']]
	df.rename(
	    columns={
	        'trade_date': 'Date', 'open': 'Open',
	        'high': 'High', 'low': 'Low',
	        'close': 'Close', 'vol': 'Volume'},
	    inplace=True)       # Redefine the column name to facilitate unified and standardized operation.
	df['Date'] = pd.to_datetime(df['Date'])  # Convert the format of date column to facilitate drawing
	df.set_index(['Date'], inplace=True)  # Date column as row index
	df = df.sort_index() # Reverse order for drawing
	return df

df = get_data('002271.SZ')   # Take Dongfang Yuhong as an example
# Define simple moving average function
def smaCal(tsPrice, k):
	import pandas as pd
	Sma = pd.Series(0.0, index=tsPrice.index)
	for i in range(k-1, len(tsPrice)):
		Sma[i] = sum(tsPrice[(i-k+1):(i+1)])/k
	return(Sma)
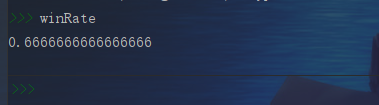
# Find the average value of trading volume VolSMA
VolSMA5 = smaCal(df.Volume, 5)[9:]
VolSMA10 = smaCal(df.Volume, 10)[9:]
VolSMA = ((VolSMA5+VolSMA10)/2)

# Develop trading signals
VolSignal=(df.Volume[9:] > VolSMA) *1

sma5=smaCal(df.Close,5)[19:]
sma20=smaCal(df.Close,20)[19:]

# Define upward breakthrough function
def upbreak(Line,RefLine):
	signal = np.all([Line > RefLine,Line.shift(1) < RefLine.shift(1)],axis=0)
	return pd.Series(signal[1:],index=Line.index[1:])*1

# Define downward breakthrough function
def downbreak(Line,RefLine):
	signal = np.all([Line < RefLine,Line.shift(1) > RefLine.shift(1)],axis=0)
	return pd.Series(signal[1:],index=Line.index[1:])*1

# Capture the date when the 5-day moving average breaks through the 20 day moving average
UpSMA = upbreak(sma5,sma20)
# Capture the date when the 5-day moving average breaks through the 20 day moving average
DownSMA = downbreak(sma5,sma20)

# Specify the buying and selling signals crossed by the moving average and combine the buying and selling signals
SMAsignal = UpSMA - DownSMA

# Sum up the trading volume signal and the price moving average signal
signal = VolSignal + SMAsignal
signal = signal.dropna()
trade = signal.replace([2,-2,1,-1,0],[1,-1,0,0,0])
trade = trade.shift(1)[1:]

# Find the winning rate of the strategy
ret = ((df.Close-df.Close.shift(1)) / df.Close.shift(1))['2020']
ret.name = 'stockRet'
tradeRet = (trade * ret)['2020']
tradeRet.name = 'tradeRet'
winRate = len(tradeRet[tradeRet>0]) / len(tradeRet[tradeRet != 0])