After the epidemic happened, almost all the people of the whole country obeyed the call to isolate themselves at home. However, there are such a group of people, called "retrograders", who are the medical staff from all provinces of the country who went to Hubei to support them. They rushed to the central point of the epidemic without fear of hardship and difficulties and formed a "new Great Wall" to isolate viruses.Below we will show how to reveal the "retrograde" data of each province on the map. The main body of information is the number of medical staff supporting Hubei in each province of the country. The platform used is SuperMap iClient3D 10i for WebGL.
1. Data preparation
(1) Basemap
With the National Administrative Region Map, under the SuperMap iDesktop sample data is the National Administrative Region Vector Polygon Data named "China Province pg". After deleting unnecessary attribute fields, export them directly to GeoJson.
Making three-dimensional label thematic maps by provincial names throughout the country, and then generating s3m cache, this is the way to make labels instead of front-end lable entity. Because the previous two days of research and development said that the s3m cache and local map cache optimized the display effect on WebGL, I rushed to find a colleague to ask for a temporary version of WebGL, testing found that the text was displayed.Clearly, previous versions of text are fake, especially when the computer resolution is set to 125%.
(2) Trailing effect data
To make a dynamic trail line effect that each province of the country flows to Hubei separately, we need the coordinates of the central point of each province. Here we use the interior points of the provincial area data directly, which can be achieved by "type conversion" - "polygon turning point" in iDesktop.
(3) Number of medical and nursing personnel supported by provinces throughout the country in Hubei
This data comes from Changjiang Daily, which does not include the number of PLA medical teams. The deadline is February 15. This article is not responsible for the authenticity and accuracy of this data.After editing the data into the properties of the provincial point data, the point data is exported to GeoJson.
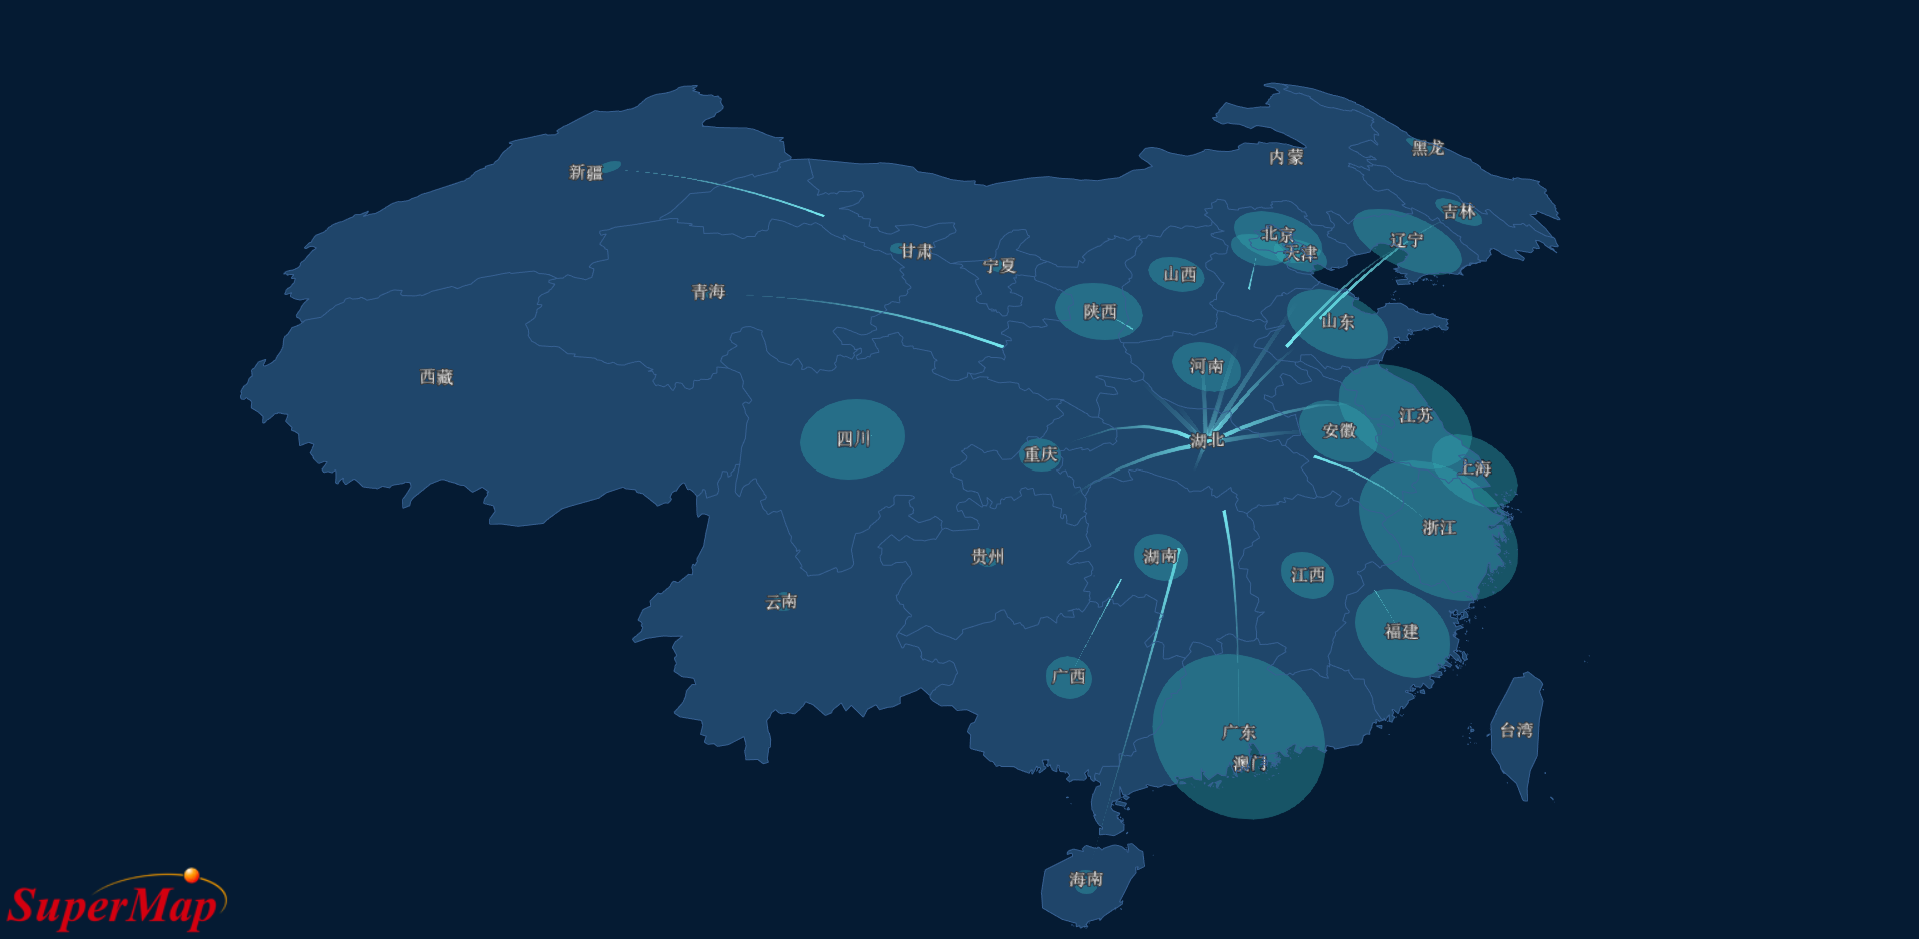
Let's start with a picture of the results:
2. Functional implementation
(1) Creating a three-dimensional sphere
We hide the navigation controls, hide the sun, the sky background and the three-dimensional sphere, and change the background color of the scene to blue. The overall administrative dividing surface is a curved surface. Information boxes are prohibited and selection tips are hidden so that when the mouse clicks on a surface entity, there will be no prompts on the interface. The code is as follows:
    var viewer = new Cesium.Viewer('cesiumContainer',{
		navigation:false,//Hide navigation controls
		infoBox:false,//Prohibit message boxes
		selectionIndicator : false//Hide selection tips
	});
    var scene = viewer.scene;
	viewer.scene.backgroundColor = new Cesium.Color(5/255, 27/255, 51/255, 255/255);//Set scene background color
	scene.globe.show=false;//Hide 3-D Sphere
	scene.sun.show=false;//Hide the Sun
	scene.skyBox.show=false;//Hide Sky Box
(2) Open label thematic maps
Publish the label thematic map as a three-dimensional service using iserver first, then open the service data, coded as follows:
	var promise = scene.open("http://localhost:8090/iserver/services/3D-China_Province_pg/rest/realspace ";//Open Tagged Thematic Map Service
        Cesium.when(promise,function(layers){

     })//Callbacks for service loading completion, in which administrative divisions, trailing lines, and circles representing the number of medical staff are loaded
(3) Add administrative divisions
The code is added to the callback above, as follows:
Cesium.loadJson('China_Data.json').then(function(jsonData) {

			    var polygonfeatures=jsonData.features;//Collection of provincial features
				var color=new Cesium.Color(26/255, 59/255, 90/255, 255/255);//Face color
				var linecolor=new Cesium.Color(54/255, 96/255, 146/255, 255/255);//Face border line color
						 for(var i=0;i<polygonfeatures.length;i++)
						 {
							 var polygonfeature=polygonfeatures[i].geometry.coordinates;//Area elements for each province
							for(var j=0;j<polygonfeature.length;j++)
							{
								if(polygonfeature.length>1)//The case where a province's vector surface is composed of multiple polygon objects
								{
									var feature=polygonfeature[j][0];
									var points=[];

									for(var k=0;k<feature.length;k++)//Reads node information for each facet and stores it in an array
									{
															 var x=feature[k][0];
															 var y=feature[k][1];
															 var z=0;
															 points.push(x);
															 points.push(y);
															 points.push(z)
									}
									if(points[0]!=undefined)//Surface Node Abnormal Judgment
									{
													viewer.entities.add({//Constructing surface entities

																 polygon : {
																	 hierarchy : Cesium.Cartesian3.fromDegreesArrayHeights(points),
																	 perPositionHeight : true,
																	 material : color,
																	 outline:true,
																	 outlineColor : linecolor
																 }

															 });
									}
								}
								else
								{
									var feature=polygonfeature[0];
									var points=[];
									for(var k=0;k<feature.length;k++)
									{
															 var x=feature[k][0];
															 var y=feature[k][1];
															 var z=0;
															 points.push(x);
															 points.push(y);
															 points.push(z);
									}
									if(points[0]!=undefined)
									{
															 viewer.entities.add({
																 polygon : {
																		 hierarchy : Cesium.Cartesian3.fromDegreesArrayHeights(points),
																		 perPositionHeight : true,
																		 material : color,
																		 outline:true,
																		 outlineColor : linecolor
																 }
															 });
									}
								}

							}

						 }
			}).otherwise(function(error) {
			});
(4) Adding a trailing line and a circle representing the number of medical staff supporting each province in Hubei Province
The tail line is pointed from each province to Hubei Province, and the number of medical staff determines the radius of the circle. The code is as follows:
var ellipsecolor=new Cesium.Color(50/255, 173/255, 180/255, 100/255);//Circle color
			Cesium.loadJson('China_Doc.json').then(function(DocData) {
				for(var i=0;i<DocData.features.length;i++)
				{
					var point=DocData.features[i].geometry.coordinates;//Inner Point Coordinates of All Provinces except Hubei
					var DocCount=DocData.features[i].properties.Doc;
					var points=[];
					if(DocCount<200)//To ensure that circles are visible at small scales, the minimum value is 200
					{
						DocCount=200;
					}
					var R=parseInt(DocCount/100)*15000;//Number of medical staff determines circle radius
					points.push(point[0]);
					points.push(point[1]);
					points.push(112.866487619079);//HuBei interior point coordinates, fixed
					points.push(31.1766459770616);
					viewer.entities.add({ // Wake Line
					                polyline: {
					                    width: 5,
										hMax:100000,
					                    positions: Cesium.Cartesian3.fromDegreesArray(points),
					                    material: new Cesium.PolylineTrailMaterialProperty({ // Trace Line Material
					                        color: Cesium.Color.fromCssColorString("rgba(118, 233, 241, 1.0)"),
					                        trailLength : 0.6,
					                        period : 3.0
					                    })
					                }
					            });

					    viewer.entities.add({//circle
					    position: Cesium.Cartesian3.fromDegrees(point[0],point[1]),
					    ellipse : {
					        semiMinorAxis : R,
					        semiMajorAxis : R,
							height: 10000.0,
					        material : ellipsecolor
					    }
					});

				}
			})
semiMinorAxis : R,
semiMajorAxis : R,
height: 10000.0,
material : ellipsecolor
				}
});
} })
The sample code can be downloaded from the Hypergraph Technology Resource Center. http://support.supermap.com.cn/ , search for "retrograde", then click "hypergraph code" to download

