Web crawler + deep learning to predict happiness 8 lottery winning tutorial
background
Happy 8 lottery inquiry: https://www.zhcw.com/kjxx/kl8/
Happy 8 game rules: https://www.zhcw.com/c/2020-09-22/618869.shtml
Theme of this project: use crawler to crawl the winning information of lottery happy 8 and use LSTM to predict.
import json
import math
import matplotlib.pyplot as plt
import matplotlib.mlab as mlab
import numpy as np
import requests
import torch
import torch.nn as nn
import torch.nn.functional
import xlwt
import xlrd
The following is the request function of the crawler. In addition to referring to web crawlers, I have also studied using developer tools on zhongcai.com for a long time.
issueCount=431
#Happy 8 issued the first issue in 20201028, 65 issues in that year, 351 issues in 2021, and 65 + 351 + 15 = 431 issues by 20220115. You can modify this variable according to the actual date when running this code.
def requests_data(index):
    headers = {
        'Connection': 'keep-alive',
        'User-Agent': 'Mozilla/5.0 (Macintosh; Intel Mac OS X 10_15_2) AppleWebKit/537.36 (KHTML, like Gecko) Chrome/79.0.3945.117 Safari/537.36',
        'Accept': '*/*',
        'Sec-Fetch-Site': 'same-site',
        'Sec-Fetch-Mode': 'no-cors',
        'Referer': 'https://www.zhcw.com/kjxx/kl8/',
        'Accept-Encoding': 'gzip, deflate, br',
        'Accept-Language': 'zh-CN,zh;q=0.9',
    }

    params = (
        ('callback', 'jQuery1122035713028555611515_1607745050216'),
        ('transactionType', '10001001'),
        ('lotteryId', '6'),#Happy 8's ID is 6
        ('issueCount', issueCount),
        ('startIssue', ''),
        ('endIssue', ''),
        ('startDate', ''),
        ('endDate', ''),
        ('type', '0'),
        ('pageNum', index),
        ('pageSize', '30'),
        ('tt', '0.24352317020584802'),
        ('_', '1607745050225'),
    )
    # Get server return data
    response = requests.get('https://jc.zhcw.com/port/client_json.php', headers=headers, params=params).content.decode('utf-8')
    return response
    #print(response)
Let's start crawling the happy 8 data of zhongcai.com and storing it in the new EXCEL table.
wb = xlwt.Workbook()
sheet= wb.add_sheet('Happy 8')
# Store header file
row=["Issue number","Award date","Lottery number","Total sales(element)"]
# Write header
for i in range(0,len(row)):
    sheet.write(0,i,row[i])

i=1
range_max = math.floor(issueCount/30+1) if issueCount%30==0 else math.floor(issueCount/30+2)
#Range if issuecount is an integer multiple of 30_ max=math. Floor (issuecount / 30 + 1), otherwise range_max=math.floor(issueCount/30+2)
for pageNum_i in range(1,range_max):#The number of pages must be exactly. If there are more pages, duplicate data will be returned, 431 / 30 = 14.3
    tony_dict=requests_data(pageNum_i)
    for j in tony_dict:
        if j != '{':
            tony_dict=tony_dict[-(len(tony_dict)-1):]
        else :
            break
    if tony_dict[len(tony_dict)-1]==')':
        tony_dict=tony_dict[:len(tony_dict)-1]#Delete last closing bracket)
    content = json.loads(tony_dict)
    content_data=content['data']

    for item in content_data:
        sheet.write(i, 0, item['issue'])
        sheet.write(i, 1, item['openTime'])
        sheet.write(i, 2, item['frontWinningNum'])
        sheet.write(i, 3, item['saleMoney'])
        i=i+1
# preservation
wb.save("Happy 8 lottery.xls")
In this way, 431 issues of data from happy 8 to manuscript holding date since the first lottery were saved in the "happy 8 lottery. xls" file. Originally, I wanted to write a time function to read the current date to automatically climb to the latest data, but it's too troublesome to think about it carefully. You can modify the acquisition method of issueCount variable by yourself. Read below xls data. Last output data_np should be a one-dimensional array.
#Next read xls data
data= xlrd.open_workbook('./Happy 8 lottery.xls')
table = data.sheets()[0]
data_lstm=[]
for i in range(issueCount,0,-1):#In Excel, the latest data is at the top, so you should read excel in reverse order
    x=table.row(i)[2].value
    for j in range(20):
        data_lstm=np.append(data_lstm,float(x[3*j])*10+float(x[3*j+1]))
print(data_lstm)
data_np=data_lstm
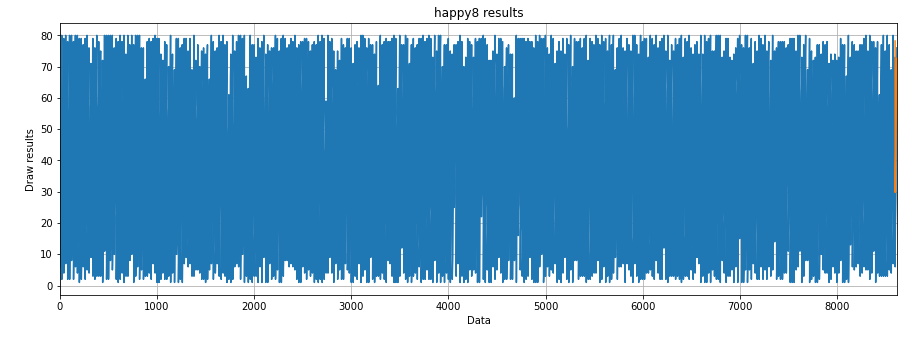
Draw the one-dimensional lottery data of happy 8.
#Draw one-dimensional lottery data of happy 8
fig_size = plt.rcParams['figure.figsize']
fig_size[0] = 15
fig_size[1] = 5
plt.rcParams['figure.figsize'] = fig_size
plt.title("happy8 results")
plt.ylabel("Draw results")
plt.xlabel("Data")
plt.grid(True)
plt.autoscale(axis='x',tight=True)
plt.plot(data_np)
plt.show()
The following is data preprocessing. The output should be 8600 and 20.
"""
Data preprocessing
"""
all_data = data_np#This step is meaningless
#Partition test set and training set
test_data_size = 20
train_data = all_data[:-test_data_size]#Except for the last 20 data, all others are retrieved
test_data = all_data[-test_data_size:]#Take the last 20 data
print(len(train_data))
print(len(test_data))
The following is the normalization of the maximum and minimum scaler to reduce the error.
#The maximum and minimum scaler is normalized to reduce the error. Note that the data standardization is only applied to the training data, not the test data
from sklearn.preprocessing import MinMaxScaler
scaler = MinMaxScaler(feature_range=(-1, 1))
train_data_normalized = scaler.fit_transform(train_data.reshape(-1, 1))
#View the first 5 pieces of data and the last 5 pieces of data after normalization
print(train_data_normalized[:5])
print(train_data_normalized[-5:])
Next, convert the dataset to tensor.
#Convert the data set to tensor, because PyTorch model is trained with tensor, and convert the training data into input sequence and corresponding label
train_data_normalized = torch.FloatTensor(train_data_normalized).view(-1)
#view is equivalent to resize in numpy, and the parameter represents the dimensions of different dimensions of the array;
#If the parameter is - 1, the dimension of this dimension is inferred by the machine. If there is no - 1, all parameters in the view must be consistent with the total number of elements in the tensor
Create is defined below_ inout_ The sequences function.
#Define create_ inout_ The sequences function receives the original input data and returns a list of tuples.
"""
be careful:
create_inout_sequences The returned tuple list consists of a sequence,
Each sequence has 21 data, including 20 data set( train_window)+ 21st data( label)
The first sequence consists of the first 20 data, and the 21st data is the label of the first sequence.
Similarly, the second sequence starts with the second data and ends with the 21st data, while the 22nd data is the label of the second sequence, and so on.
"""
def create_inout_sequences(input_data, tw):
    inout_seq = []
    L = len(input_data)
    for i in range(L-tw):
        train_seq = input_data[i:i+tw]
        train_label = input_data[i+tw:i+tw+1]#Forecast time_ First value after step
        inout_seq.append((train_seq, train_label))#inout_ The data in SEQ is constantly updated, but the total amount is only tw+1
    return inout_seq
train_window = 20#Set the sequence length of training input to 20, similar to time_step = 20
train_inout_seq = create_inout_sequences(train_data_normalized, train_window)
print(train_inout_seq[:5])#Production data set transformation results
Next create the LSTM model.
"""
establish LSTM Model
 Parameter Description:
1,input_size:The corresponding and characteristic quantity, in this case, is 1, i.e passengers
2,output_size:Number of prediction variables and number of data labels
2,hidden_layer_size:The characteristic number of the hidden layer, that is, the number of neurons in the hidden layer
"""
"""
forward method: LSTM Input and output of layer: out, (ht,Ct)=lstm(input,(h0,C0)),among
 1, Input format: lstm(input,(h0, C0))
1,input For( seq_len,batch,input_size)Formatted tensor,seq_len mean time_step
2,h0 by(num_layers * num_directions, batch, hidden_size)Formatted tensor,Initial state of hidden state
3,C0 by(seq_len, batch, input_size)Formatted tensor,Initial cell state
 2, Output format: output,(ht,Ct)
1,output by(seq_len, batch, num_directions*hidden_size)Formatted tensor,Include output features h_t(originate from LSTM each t The last floor of)
2,ht by(num_layers * num_directions, batch, hidden_size)Formatted tensor,
3,Ct by(num_layers * num_directions, batch, hidden_size)Formatted tensor,
"""
class LSTM(nn.Module):#Note that the Module initials need to be capitalized
    def __init__(self, input_size=1, hidden_layer_size=100, output_size=1):
        super().__init__()
        self.hidden_layer_size = hidden_layer_size

        # LSTM layer and linear layer are created, LSTM layer extracts features, and linear layer is used as the final prediction
        ##The LSTM algorithm accepts three inputs: the previous hidden state, the previous cell state and the current input.
        self.lstm = nn.LSTM(input_size, hidden_layer_size)
        self.linear = nn.Linear(hidden_layer_size, output_size)

        #Initialize implicit state and cell state C, hidden_ The cell variable contains the previous hidden state and cell state
        self.hidden_cell = (torch.zeros(1, 1, self.hidden_layer_size),
                            torch.zeros(1, 1, self.hidden_layer_size))
                            # Why is the second parameter also 1
                            # The second parameter should represent batch_size bar
                            # Is it because the data has been segmented before?????

    def forward(self, input_seq):
        lstm_out, self.hidden_cell = self.lstm(input_seq.view(len(input_seq), 1, -1), self.hidden_cell)
        #The output of lstm is the hidden state ht and cell state ct of the current time step and the output lstm_out
        #Modify the input in the format of lstm_ The shape of SEQ is used as the input of linear layer
        predictions = self.linear(lstm_out.view(len(input_seq), -1))
        return predictions[-1]#Returns the last element of the predictions
Next, create an object of the LSTM() class and define the loss function and optimizer.
#Create an object of the LSTM() class and define the loss function and optimizer
model = LSTM()
loss_function = nn.MSELoss()
optimizer = torch.optim.Adam(model.parameters(), lr=0.001)#Create optimizer instance
print(model)
Let's start training,
"""
model training
batch-size Refers to the sample size used in one iteration;
epoch It means to go through all training data completely;
Because by default, the weight is PyTorch Neural networks are randomly initialized, so different values may be obtained.
"""
epochs = 20
for i in range(epochs):
    for seq, labels in train_inout_seq:
        #Clears the previous gradient value of the network
        optimizer.zero_grad()#When training the model, you need to make the model in the training mode, that is, call model train().  By default, the gradient is cumulative. You need to manually initialize or reset the gradient and call optimizer zero_ grad()
        #Initialize hidden layer data
        model.hidden_cell = (torch.zeros(1, 1, model.hidden_layer_size),
                             torch.zeros(1, 1, model.hidden_layer_size))
        #Instantiation model
        y_pred = model(seq)
        #Calculate the loss, back propagation gradient and update the model parameters
        single_loss = loss_function(y_pred, labels)#In the training process, the forward propagation generates the output of the network and calculates the loss value between the output and the actual value
        single_loss.backward()#Call loss Backward() automatically generates gradients,
        optimizer.step()#Using optimizer Step () executes the optimizer and propagates the gradient back to each network

    # View the results of model training
    if i%2 == 1:
        print(f'epoch:{i:3} loss:{single_loss.item():10.8f}')
print(f'epoch:{i:3} loss:{single_loss.item():10.10f}')
The following is the prediction code.
"""
forecast
 be careful, test_input Contains 20 data,
stay for In the loop, 20 data will be used to predict the first data of the test set, and then append the predicted value to the test set test_inputs In the list.
In the second iteration, the last 20 data will be used as input again, a new prediction will be made, and then the new value of the second prediction will be added to the list again.
Since there are 20 elements in the test set, the loop will execute 12 times.
At the end of the cycle, test_inputs The list will contain 24 data, of which the last 12 data will be the predicted values of the test set.
"""
fut_pred = 20
test_inputs = train_data_normalized[-train_window:].tolist()#First print out the last 20 values of the data list
print(test_inputs)
Next, change the model to test or verification mode.
#Change the model to test or validation mode
model.eval()#Set the training property to false to make the model in the test or verification state
for i in range(fut_pred):
    seq = torch.FloatTensor(test_inputs[-train_window:])
    with torch.no_grad():
        model.hidden = (torch.zeros(1, 1, model.hidden_layer_size),
                        torch.zeros(1, 1, model.hidden_layer_size))
        test_inputs.append(model(seq).item())
#Print the last 20 predictions
print(test_inputs[fut_pred:])
#Since the training set data is standardized, the prediction data is also standardized
#The normalized predicted value needs to be converted into the actual predicted value. Via invert_ Transform implementation
actual_predictions = scaler.inverse_transform(np.array(test_inputs[train_window:]).reshape(-1, 1))
print(actual_predictions)
All actual values and 20 predicted values for the last period are plotted below. A total of 89000 data masked 20 values.
"""
Draw the predicted value according to the actual value
"""
x = np.arange(len(data_np)-fut_pred, len(data_np), 1)
plt.title('happy8 results')
plt.ylabel('Draw results')
plt.xlabel('Data')
plt.grid(True)
plt.autoscale(axis='x', tight=True)
plt.plot(data_np)
plt.plot(x, actual_predictions)
plt.show()
Therefore, we mainly look at the last 20 observations.
#Draw the actual and predicted lottery numbers of the last 20 numbers
plt.title('happy8 results')
plt.ylabel('Draw results')
plt.xlabel('Data')
plt.grid(True)
plt.autoscale(axis='x', tight=True)
plt.plot(x,data_np[-train_window:])
plt.plot(x, np.rint(actual_predictions))
plt.show()
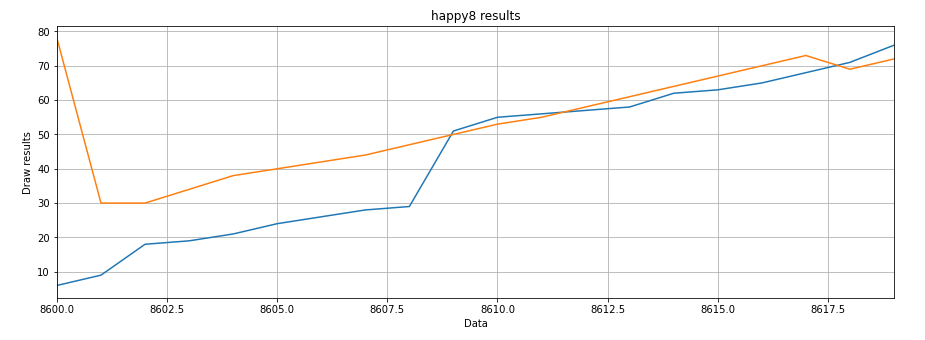
The above result is not unique. The following is a prediction that outputs the last 20 numbers.
actual_predictions_rint=np.rint(actual_predictions)
actual_predictions_rint_sort=np.sort(actual_predictions_rint.ravel())
actual_predictions_rint_sort_unique=np.unique(actual_predictions_rint_sort)
print(actual_predictions_rint_sort_unique)
The output result is an ordered array with a length of less than 20. LSTM predicts that the last 20 numbers may have duplicates, so I removed the duplicates and sorted them. The output results may be [30. 34. 38. 40. 42. 44. 47. 50. 53. 55. 58. 61. 64. 67. 69. 70. 72. 73
78.]
Insufficient
- I didn't seriously spend time studying how the LSTM model learned how to predict.
- The crawler can obtain the current time by turning the clock on the issueCount variable, so as to automatically climb the latest and complete data, which needs to be improved.
- Only the latest 20 figures can be predicted, that is, only one period can be predicted. How to change the prediction set?
- How to force LSTM to learn the rules of happy 8? For example, 20 numbers are a period / these 20 numbers are sorted from small to large / the range of these 20 numbers is 1-80.
reference
In the LSTM model part, I refer to this article: https://blog.csdn.net/ch206265/article/details/106962354/
I refer to this article in the web crawler section https://www.jianshu.com/p/54011214ca95