1 Literature Reading
Point Source Pollution (PSP) is a kind of water pollution caused by concentrated discharge of urban sewage and industrial wastewater.
Non-point Source Pollution is the water pollution caused by pollutants entering the surface and groundwater in a wide, dispersed and trace form, including rainstorm runoff, atmospheric dry and wet subsidence, etc.
Non-point source pollution is pollution that occurs when and where soluble or solid pollutants are washed and scoured by rainfall and enter water through surface runoff processes.
Non-point source pollution can destroy aquatic ecosystems and aquatic living environment, and it can indirectly threaten human health.
Non-point source pollution mainly consists of three processes: the formation of rainfall runoff, the runoff scouring the ground, and the entry of pollutants such as nitrogen and phosphorus into the water body.
Watershed water quality model is a mathematical equation describing the regularity of pollutant migration and transformation over time and space within a watershed. The study system is simplified by computer to simulate the spatial and temporal variation of pollutants in the watershed water environment, and to provide technical support for the planning of water pollution control in the watershed. Corresponding non-point source pollution models are runoff and runoff models, soil erosion models, and pollutant migration and transformation models.
1.1 model of runoff generation and convergence
1.1.1 Inference Formula

1.1.2 Hamon Model

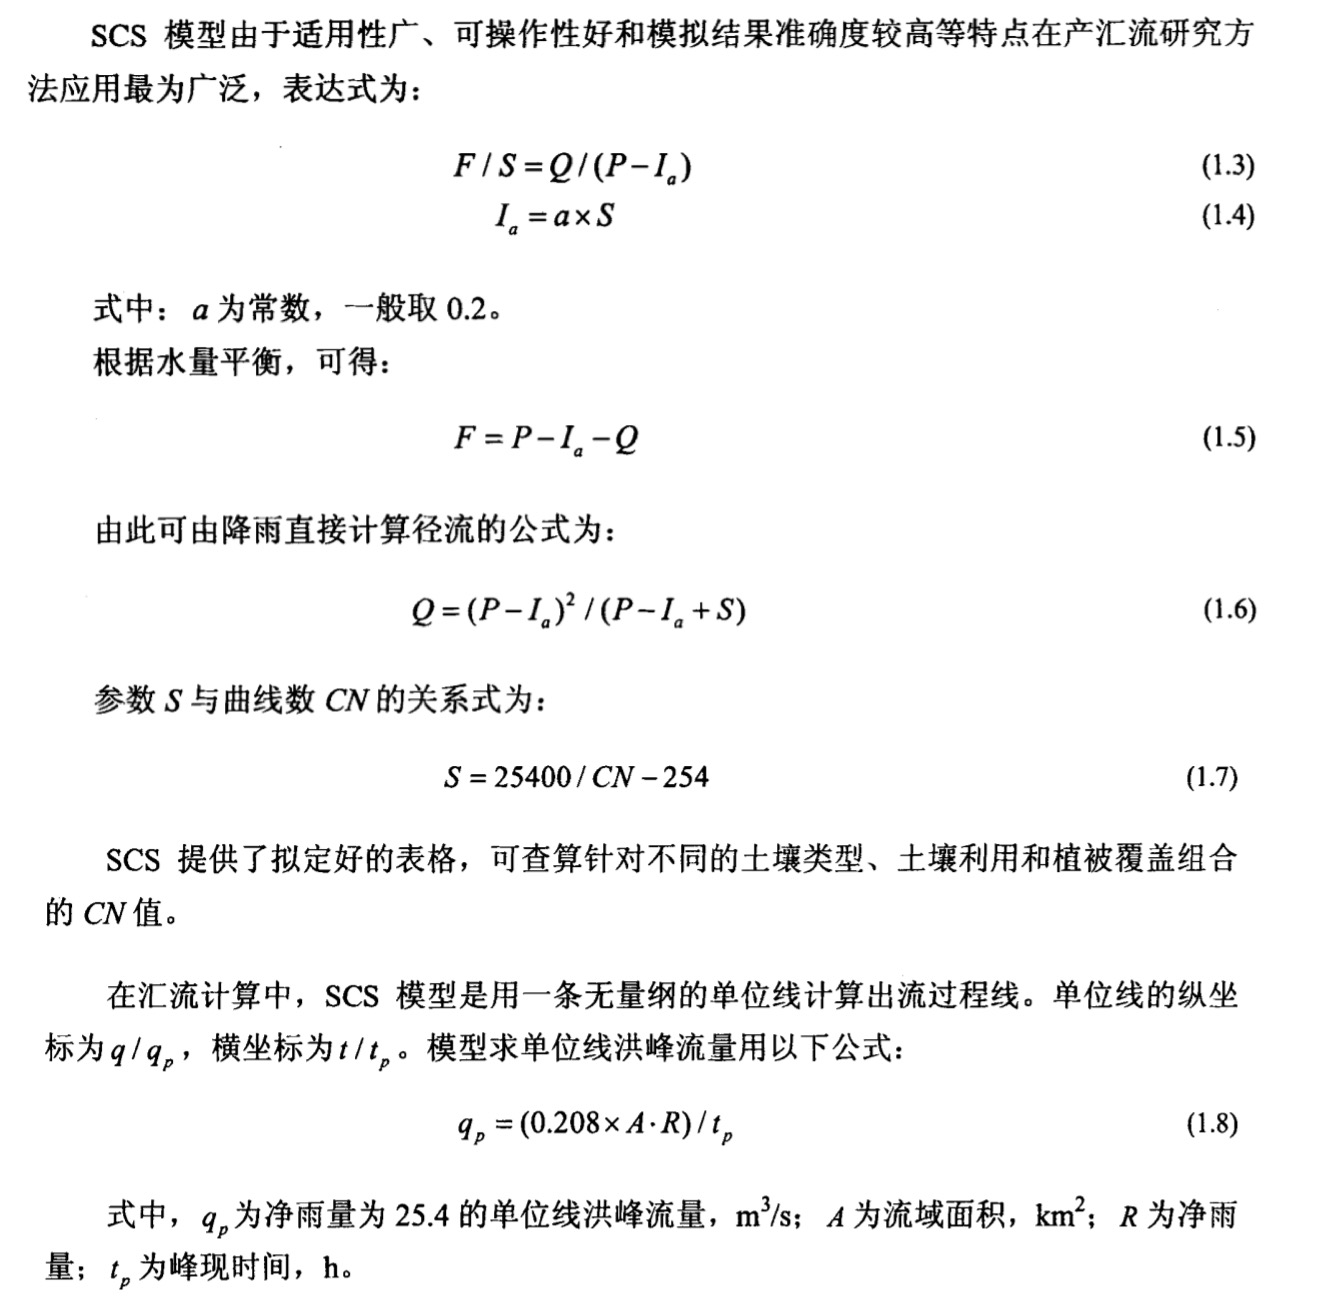
1.1.3 SCS Model

2. Deep learning practice
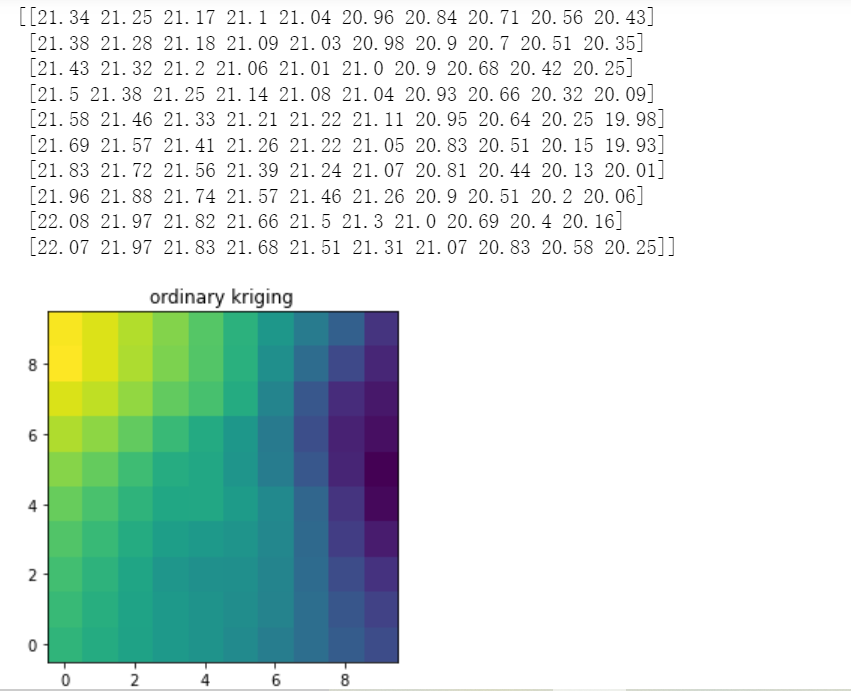
Drawing and displaying the results of Kriging surface interpolation is practiced. A general Kriging interpolation algorithm is used. The input of the program is guiyihua.xls file, the output is 100 interpolation results, and the interpolation result graph with the lower left corner as the origin.
from pykrige.ok import OrdinaryKriging
import numpy as np
from matplotlib import pyplot as plt
import xlrd #Read excel's Library

# The data for a known sample point is the value for coordinates (x, y) and coordinates
# The first column in the matrix is x, the second column is y, and the third column is the value of the coordinates
# data = np.array(
#     [
#         [0.1, 0.1, 0.9],
#         [0.2, 0.1, 0.8],
#         [0.1, 0.3, 0.9],
#         [0.5, 0.4, 0.5],
#         [0.3, 0.3, 0.7],
#     ])

resArray=[] # Declare an empty list first
data = xlrd.open_workbook("guiyihua.xls") #read file
table = data.sheet_by_index(0) # Get worksheet by index, 0 is the worksheet
for i in range(table.nrows): # table.nrows represents the total number of rows
    line=table.row_values(i) # Read each row of data, save in line, line is list
    resArray.append(line) # Add line to resArray, which is a two-dimensional list
resArray=np.array(resArray) # Turn resArray from a two-dimensional list to an array
# a = np.squeeze(resArray, 0)
# print(a)

# grid
x_range = 1.0
y_range = 1.0
range_step = 0.1 # step
gridx = np.arange(0.0, x_range, range_step) #Meaning of the three parameters: range 0.0 - 0.6, grid every 0.1
gridy = np.arange(0.0, y_range, range_step)

ok3d = OrdinaryKriging(resArray[:, 0], resArray[:, 1], resArray[:, 2], variogram_model="linear") # Model
# variogram_model is a variogram model
# pykrige offers linear, power, gaussian, spherical, exponential, hole-effect
# Several variogram_ Models are optional, and the default is the linear model
# Use different variogram_model, the predictions are different, you should choose the appropriate variogram_for your task Model

k3d1, ss3d = ok3d.execute("grid", gridx, gridy) # k3d1 is the result, giving the corresponding value at each grid point

print(np.round(k3d1,2))
#Output Results

# Mapping
fig, (ax1) = plt.subplots(1)
ax1.imshow(k3d1, origin="lower")
ax1.set_title("ordinary kriging")
plt.tight_layout()
plt.show()
Input data: An excel table with 50 rows and 3 columns containing monitoring data for 50 sites, with columns for longitude, latitude and measurements of the monitoring sites.
Output results:

3 Task Items
Using happybase library and thrift binary Communication Middleware
pip install happybase
pip install thrift
Set up a connection
import happybase

connection = happybase.Connection('10.xx.xx.91')
When a connection is created, a socket connection is automatically established with Hbase by default.
If you do not want to automatically establish a socket connection with Hbase, you can set the autoconnect parameter to False
connection = happybase.Connection('10.xx.xx.91', autoconnect=False)
Then manually establish a socket connection with Hbase
connection.open()
4 bands complete
Help modify the task book, share Kriging interpolation learning materials, and learn more hands-on.
Clear up the specific content.