Recently, we are studying the use of pyecharts, which is a visual tool of python. Then we want to play together with Wechat and see the effect directly.
[Img-0BvoMCek-1565876828599 (https://upload-images.jianshu.io/upload_images/17885815-83e5faa94bc6d8e2?ImageMogr2/auto-orient/strip)]
Environmental configuration
pip install pyecharts
pip install snapshot_selenium
pip install echarts-countries-pypkg
pip install echarts-china-provinces-pypkg
pip install echarts-china-cities-pypkg
pip install echarts-china-counties-pypkg
pip install wxpy
Getting Friends
The main purpose is to get the basic data of friends, which is used to make data visualization code as follows:
What I don't know in the process of learning can be added to me?
python Learning Exchange Button qun,784758214
//There are good learning video tutorials, development tools and e-books in the group.
//Share with you the current talent needs of python enterprises and how to learn python from zero foundation, and what to learn
from wxpy import Bot, Chat

class Demo(Chat):

    @staticmethod
    def get_friend():
        bot = Bot()
        friends = bot.friends(update=True)

        friend_data = []
        for friend in friends:
            if friend.sex == 1:
                sex = "male"
            elif friend.sex == 2:
                sex = "female"
            else:
                sex = ""
            friend_dict = {
                "city": friend.city,
                "province": friend.province,
                "sex": sex,
                "signature": friend.signature,

            }
            friend_data.append(friend_dict)

        return friend_data
Returns a list of Wechat friends, including data on friends cities, provinces, gender and personality signatures.
Geographic coordinate map
Geographic coordinate system component is used for map drawing, supporting scatter plot and line set drawing in geographic coordinate system.
Geographic coordinate map in pyecharts is mainly based on Geo module
def geo_base():
    city_data = get_data()
    geo = Geo(init_opts=opts.InitOpts(theme="vintage"))
    for city in city_data:
        try:
            geo.add_schema(maptype="china", itemstyle_opts=opts.ItemStyleOpts(color="gray"))
            geo.add("Wechat Friends Distribution Map", [city], type_="effectScatter", symbol_size=10)
            geo.set_series_opts(label_opts=opts.LabelOpts(is_show=False))
            geo.set_global_opts(visualmap_opts=opts.VisualMapOpts(), title_opts=opts.TitleOpts(title="Wechat Friends Distribution Map"), )
        except Exception as e:
            print(e)
            pass

    # geo.render("geo.html")
    make_snapshot(driver, geo.render(), "geo.png")
After running, a geo.png image will be generated in the current directory
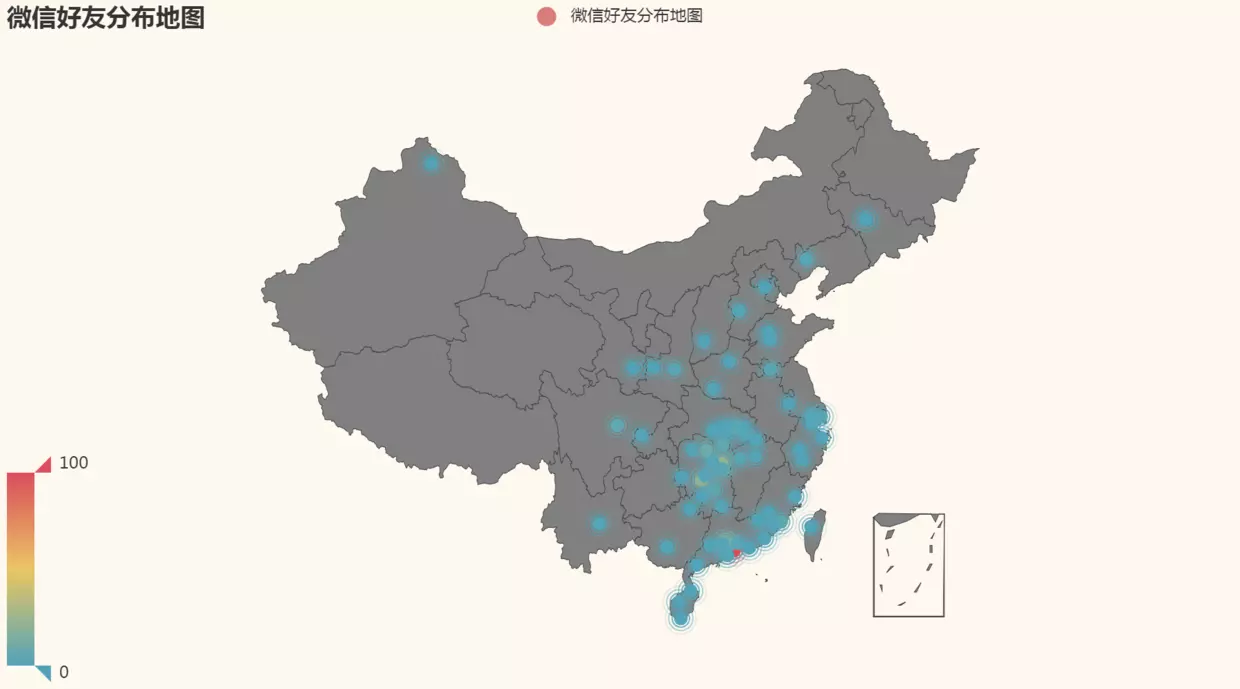
This picture is a map of Weixin friends'distribution in China.
Thermogram
Thermodynamic diagram is also based on the unique difference of Geo module. In add ition function, type is heatmap.
The code is as follows:
def heat_map():
    city_data = get_data()
    geo = Geo(init_opts=opts.InitOpts(theme="vintage"))
    for city in city_data:
        try:
            geo.add_schema(maptype="Guangdong", itemstyle_opts=opts.ItemStyleOpts(color="gray"))
            geo.add("Guangdong Friends Thermal Map", [city], type_="heatmap", symbol_size=10)
            geo.set_series_opts(label_opts=opts.LabelOpts(is_show=False))
            geo.set_global_opts(visualmap_opts=opts.VisualMapOpts(), title_opts=opts.TitleOpts(title="Thermogram"), toolbox_opts=opts.ToolboxOpts())
        except :
            pass

    geo.render("heat.html")
For example, the data of a province can be selected, and the effect after operation is as follows:
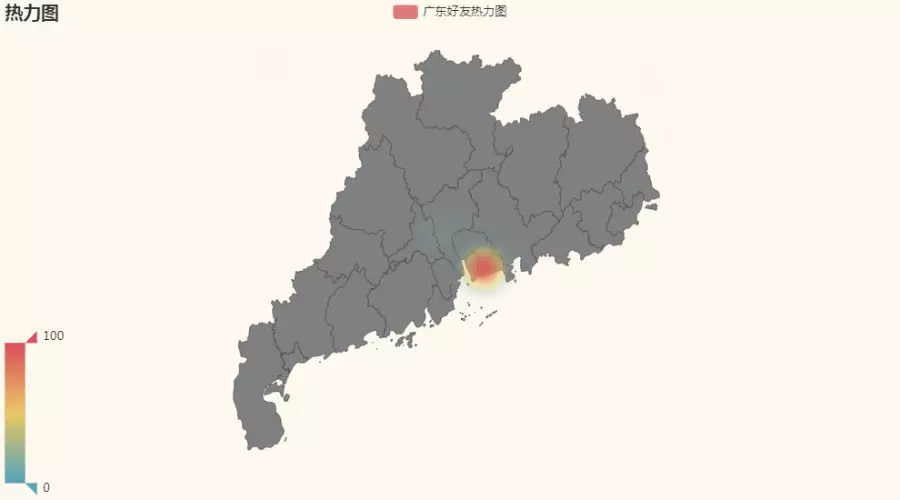
The above is the thermodynamic map of the distribution of Guangdong friends in Weixin.
National Distribution Map
Map is an extension based on Map module. The main function is add.
 def add(
    # Series name for tooltip display, legend Legend legend Legend filtering.
    series_name: str,

    # Data item (coordinate point name, coordinate point value)
    data_pair: Sequence,

    # Map type, refer specifically to pyecharts.datasets.map_filenames.json file
    maptype: str = "china",

    # Is Legend Selected
    is_selected: bool = True,

    # Whether to turn on mouse zoom and pan roaming.
    is_roam: bool = True,

    # The central point of the current perspective, expressed in latitude and longitude
    center: Optional[Sequence] = None,

    # Scale-up ratio of current perspective.
    zoom: Optional[Numeric] = 1,

    # Name mapping for custom locales
    name_map: Optional[dict] = None,

    # Marked Graphic Shape
    symbol: Optional[str] = None,

    # Whether to display markup graphics
    is_map_symbol_show: bool = True,

    # Label Configuration Item, refer to `series_options.LabelOpts'.`
    label_opts: Union[opts.LabelOpts, dict] = opts.LabelOpts(),

    # Tip box component configuration item, refer to `series_options.TooltipOpts'.`
    tooltip_opts: Union[opts.TooltipOpts, dict, None] = None,

    # Metastyle configuration entry, refer to `series_options.ItemStyleOpts'.`
    itemstyle_opts: Union[opts.ItemStyleOpts, dict, None] = None,
)
The code is as follows:
def map_base():
    province_data = province_list()
    maps = Map()
    maps.add("", province_data, "china")
    maps.set_global_opts(title_opts=opts.TitleOpts(title="Wechat Friends Distribution Map"), visualmap_opts=opts.VisualMapOpts())

    make_snapshot(driver, geo.render(), "map.png")
After running, is it interesting to generate the pictures shown at the beginning of the article?
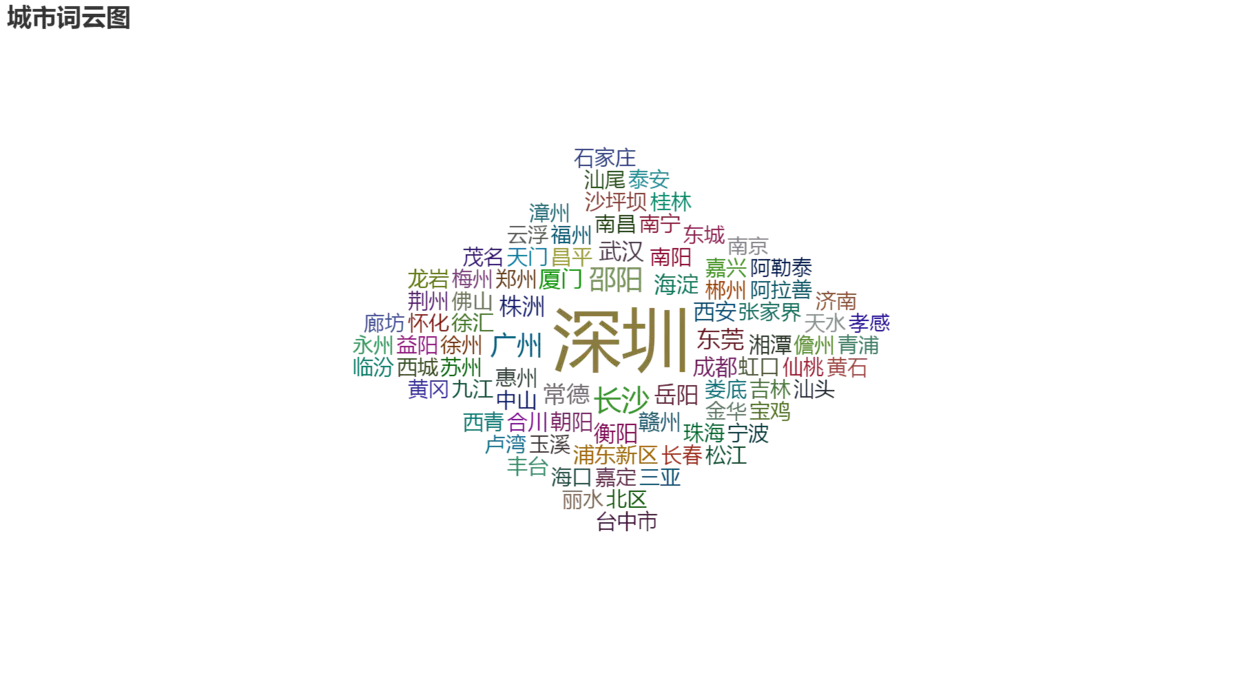
Word nephogram
Cloud Map of Friends City Distribution Words
c = (
            WordCloud()
            .add("", city_list, word_size_range=[15, 50], shape="diamond", word_gap=10)
            .set_global_opts(title_opts=opts.TitleOpts(title="diamond"))
        )
        make_snapshot(driver, c.render(), "world.png")
The results are as follows:
Bar graph
First look at the effect:

The code is as follows:
def bar_datazoom_slider() -> Bar:
    city_data = get_data()
    c = (
        Bar(init_opts=opts.InitOpts(page_title="Bar graph"))
        .add_xaxis([city[0] for city in city_data])
        .add_yaxis("Number of cities", [city[1] for city in city_data])
        .set_global_opts(
            title_opts=opts.TitleOpts(title="Friends City Distribution Bar Map"),
            datazoom_opts=[opts.DataZoomOpts(orient="vertical")]
        )
    )
    return c
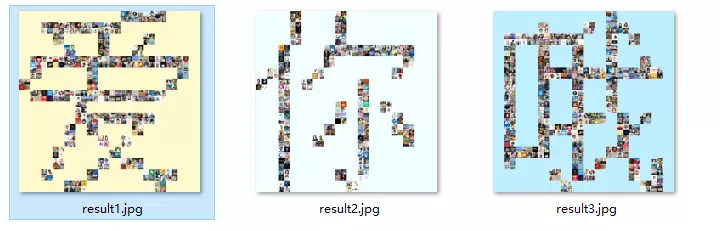
Finally, another interesting way is to offer your Weixin avatars:
Look at the picture first.
If you are still confused in the world of programming, you can join our Python learning button qun: 784758214 to see how our predecessors learned! Exchange experience! I am a senior Python development engineer, from basic Python script to web development, crawler, django, data mining and so on, zero-based to the actual project data have been collated. To every Python buddy! Share some learning methods and small details that need attention. Click to join us. python learner gathering place
In addition, you can also customize the text and input the text you want to make.