After graduation, I want to develop in the local city. Renting is the top priority I face. Where are there many houses? Where is the cheapest house price? I want to face south, I want high-rise....
No problem, the reptile is done!
First of all, when we open the home page of chain house rental, we can see that there are 61363 houses under rent. So many houses must have my favorite one.
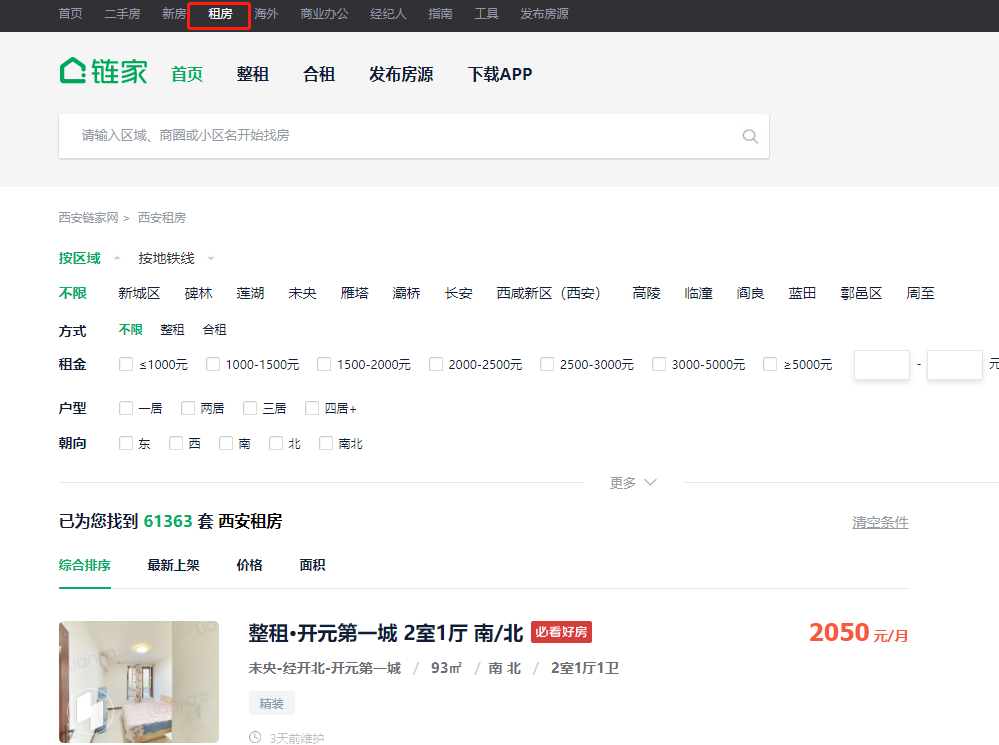
The information we want to obtain includes the name of the house, the location of the house, the orientation of the house, the area of the house, the layout of the house, and, most importantly, the price of the house!
1. First, let's get the web link:
https://xa.lianjia.com/zufang/pg1/
https://xa.lianjia.com/zufang/pg5/
https://xa.lianjia.com/zufang/pg8/
It can be found that the page turning is determined by the page parameter.
2. Add the following three parameters to simulate browser access.

url = f'https://xa.lianjia.com/zufang/pg{page}/'
        #Simulation browser
        headers = {
            'Referer':f'https://xa.lianjia.com/zufang/pg{page}/',
            'User-Agent':'Mozilla/5.0 (Windows NT 10.0; WOW64) AppleWebKit/537.36 (KHTML, like Gecko) Chrome/92.0.4484.7 Safari/537.36',
            'Cookie':'select_city=610100; lianjia_uuid=0026697d-0b4b-404a-9700-6ffdee75e3be; _smt_uid=60928372.2a8cb08f; UM_distinctid=1793c51792a47d-0751bdbf625319-71153641-1fa400-1793c51792ba23; _jzqckmp=1; sensorsdata2015jssdkcross=%7B%22distinct_id%22%3A%221793c517f2b1-0931efe9a56ec3-71153641-2073600-1793c517f2c463%22%2C%22%24device_id%22%3A%221793c517f2b1-0931efe9a56ec3-71153641-2073600-1793c517f2c463%22%2C%22props%22%3A%7B%22%24latest_traffic_source_type%22%3A%22%E4%BB%98%E8%B4%B9%E5%B9%BF%E5%91%8A%E6%B5%81%E9%87%8F%22%2C%22%24latest_referrer%22%3A%22https%3A%2F%2Fwww.baidu.com%2Fother.php%22%2C%22%24latest_referrer_host%22%3A%22www.baidu.com%22%2C%22%24latest_search_keyword%22%3A%22%E9%93%BE%E5%AE%B6%22%2C%22%24latest_utm_source%22%3A%22baidu%22%2C%22%24latest_utm_medium%22%3A%22pinzhuan%22%2C%22%24latest_utm_campaign%22%3A%22wyxian%22%2C%22%24latest_utm_content%22%3A%22biaotimiaoshu%22%2C%22%24latest_utm_term%22%3A%22biaoti%22%7D%7D; _ga=GA1.2.1228540593.1620214646; _gid=GA1.2.1956937792.1620214646; Hm_lvt_9152f8221cb6243a53c83b956842be8a=1620214650; digv_extends=%7B%22utmTrackId%22%3A%2221583074%22%7D; lianjia_ssid=5b2db515-b320-4c75-b676-e28e8b35d4ec; CNZZDATA1255849580=598881228-1620209949-https%253A%252F%252Fwww.baidu.com%252F%7C1620296334; CNZZDATA1254525948=1027467720-1620211125-https%253A%252F%252Fwww.baidu.com%252F%7C1620296930; CNZZDATA1255633284=1302951133-1620212328-https%253A%252F%252Fwww.baidu.com%252F%7C1620297661; CNZZDATA1255604082=1771052689-1620212893-https%253A%252F%252Fwww.baidu.com%252F%7C1620294612; _jzqa=1.3096002108450772000.1620214643.1620214643.1620299994.2; _jzqc=1; _jzqy=1.1620214643.1620299994.1.jzqsr=baidu|jzqct=%E9%93%BE%E5%AE%B6.-; _qzja=1.2112865692.1620214644413.1620214644413.1620299994647.1620214650759.1620299994647.0.0.0.3.2; _qzjc=1; _qzjto=1.1.0; _jzqb=1.1.10.1620299994.1; _qzjb=1.1620299994647.1.0.0.0; srcid=eyJ0Ijoie1wiZGF0YVwiOlwiNGE0Y2E5MmE5MTFiMjhjODMyNTIxMDdkM2VjMDU2NGQzY2I0ZGQzMDlhZDY2Y2MwY2FjZWJjOWVmNmY1NWRlYzIwNDYwZDY3ZmZiZTZmODM5Yzc3MWFmMzNkMmI0NDI5ZWFkMTFhYzY4YWU0Y2Q3ZTlhYWZhMzk4MTc0MjcwNTZiZTg3MTc1MWI5YWQzMDUxNzk4Y2MwZDJmMTA5YzgzOWMxZjUyZTVhMmI0NDVmYzNkN2NjNjI2NjZiYTRiYzI2YTZmNGNlMzViMTZkMTc3NTA4ZGE0YzkxMDAzZDkwYmIwNTM0NGU1OTY3OThlZWNiN2YyNjIxZjQ5YzRiOGY5NWY3Zjc5NWM2YzIzNmNkOGI0NjQ2ZWNmNjczNzk0MzBhZWRjODdjYjg4MWNkOWFjYjFhMWVkYTllOTc2NzYxMTgyZmU1MjljYjdlNWNiZmZjZDY5ZDA5YTEwZGM5OTcxNlwiLFwia2V5X2lkXCI6XCIxXCIsXCJzaWduXCI6XCJkMWZhZDhjYlwifSIsInIiOiJodHRwczovL3hhLmxpYW5qaWEuY29tL3p1ZmFuZy9wZzEvIiwib3MiOiJ3ZWIiLCJ2IjoiMC4xIn0='
        }
        #Send network request
        try:
            resp = requests.get(url, headers = headers)
        except:
            print('something wrong!')
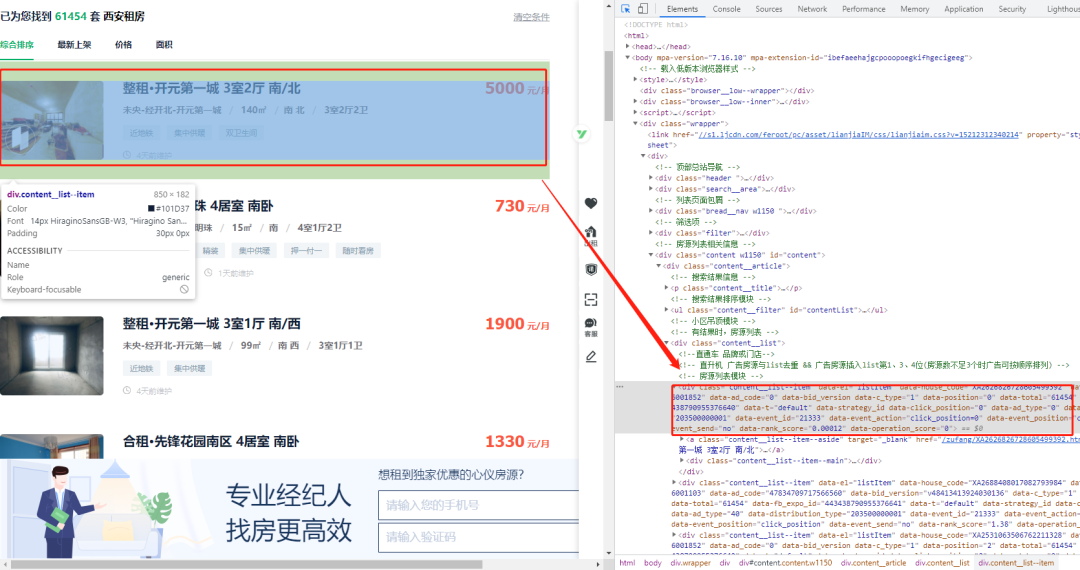
3. By analyzing the web page, we can see that all the information of each house is in this div. there are 30 sets of house information on each page, that is, there are such 30 div.
So our idea is very simple. Use css to get all the information of the 30 div s, and then use the loop to get the specific information in each house.
4. As follows, we can observe the page structure and find that all listing div information is in a class named content__ Div inside list.
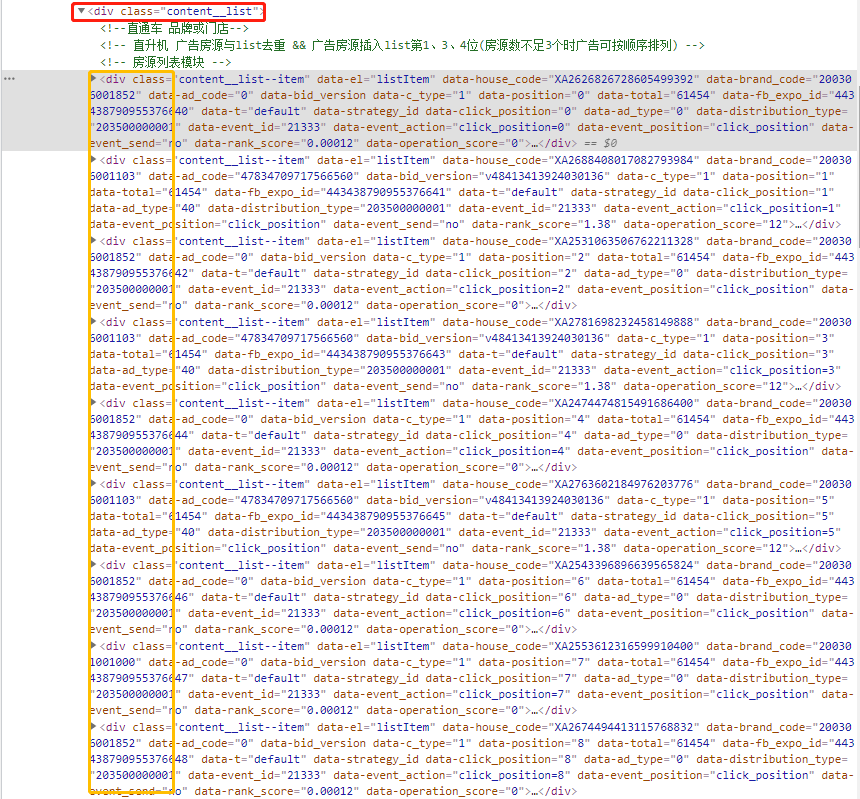
So let's get all the div s first
divs = seletor.css('.content__list--item') #All div Tags
5. Then we traverse all div s to get their internal specific information.
for d in divs:
   title = d.css('.content__list--item--title a::text').get().strip()  #House title
   address = d.css('.content__list--item--des a::text').getall()
   address = '-'.join(address).strip()                                #House community name
   area = d.css('.content__list--item--des::text').getall()[4].strip()  #House area
   toward = d.css('.content__list--item--des::text').getall()[5].strip()  #House orientation
   structure = d.css('.content__list--item--des::text').getall()[6].strip()  #House structure
   addinfo = d.css('.content__list--item--bottom i::text').getall()
   addinfo = '|'.join(addinfo)                                             #House other information
   maint = d.css('.content__list--item--time::text').get().strip()  #House maintenance details
   price = d.css('.content__list--item-price em::text').get().strip() + 'element/month' #House monthly rent
6. Then we save the obtained information into Excel to facilitate subsequent pandas operations.
ws = op.Workbook()
wb = ws.create_sheet(index=0)

wb.cell(row=1, column=1, value='title')
wb.cell(row=1, column=2, value='Cell name')
wb.cell(row=1, column=3, value='the measure of area')
wb.cell(row=1, column=4, value='orientation')
wb.cell(row=1, column=5, value='structure')
wb.cell(row=1, column=6, value='Additional information')
wb.cell(row=1, column=7, value='Maintenance')
wb.cell(row=1, column=8, value='Monthly rent')
ws.save('Xi'an rental information.xlsx')
7. The Excel information obtained is as follows:

8. Then we set a small goal to obtain 100 pages of data first. That is, 3000 listings.

Next, let's simply visualize the availability of houses in various regions of Xi'an to see which region has more houses, and when there are more houses, there will be more choices. The price is natural You know!
1. We first use pandas to read excel, and then get the location of all houses:
pd_data = pd.read_excel(r'./Xi'an rental information.xlsx')    #Read excel
address = pd_data['Cell name']                      #Get all addresses

Because we only need the area where the first two houses are located, and we need to know the total number of all houses in each area. No other information is required, so it needs to be further optimized.
#Get the first two digits of the address as the area name
address_01 = []
for i in address:
address_01.append(i[0:2])
#Statistics
data = []
address_01_set = set(address_01)
for item in address_01_set:
data.append((item, address_01.count(item)))
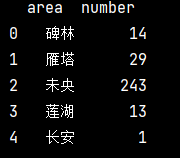
#Rename column
df = DataFrame(data)
df.columns = ('area', 'number')
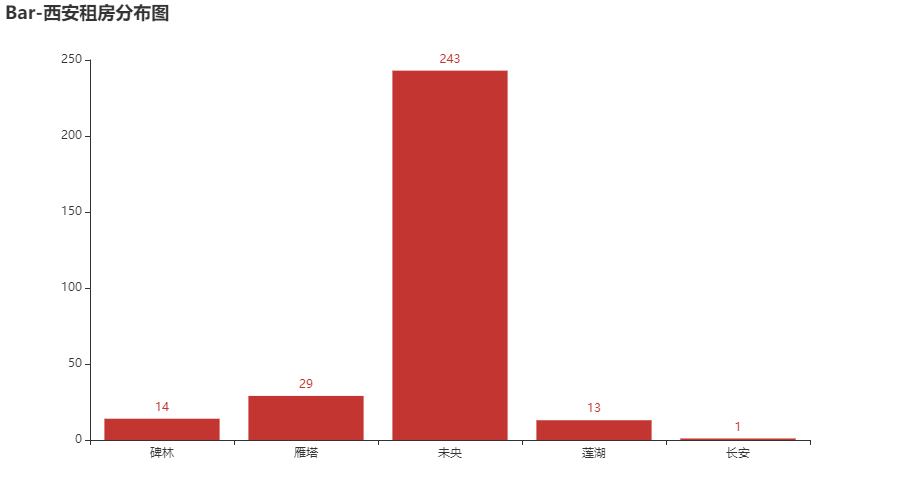
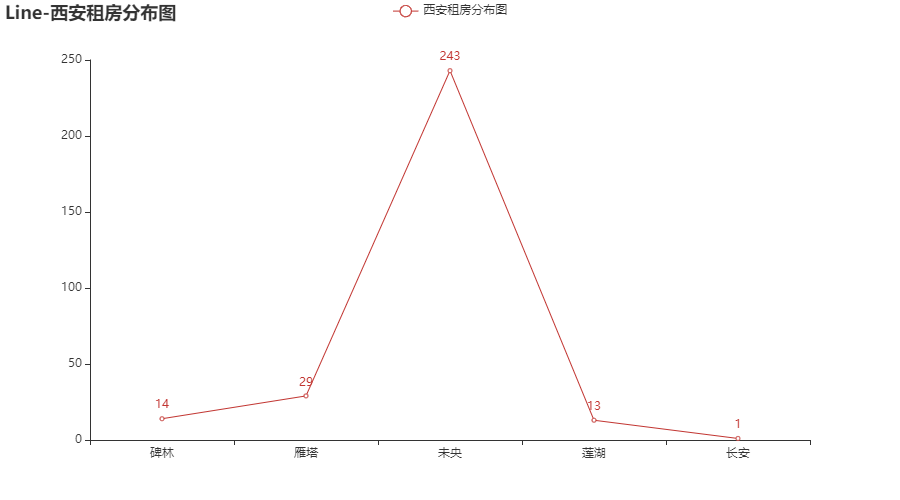
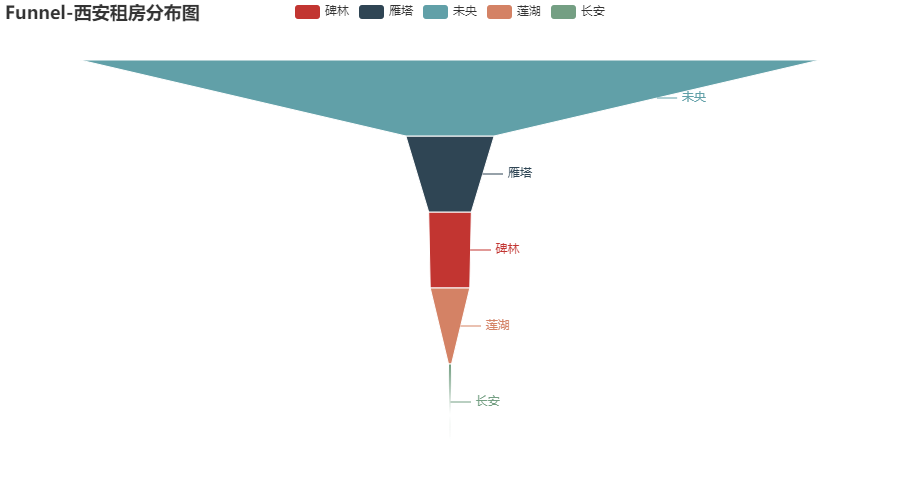
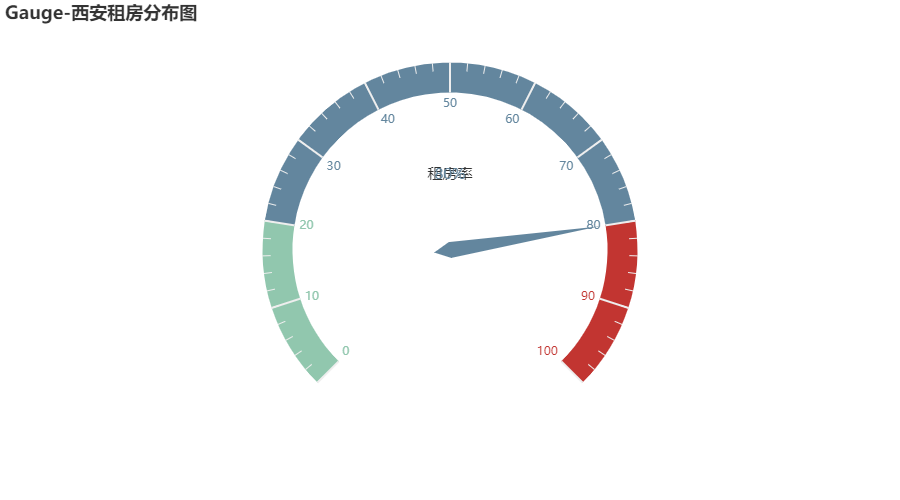
Next, we use bar chart, pie chart, line chart, funnel chart and dashboard to show them respectively.
#1. Histogram
def barPage() -> Bar:
    bar = (
        Bar()
        .add_xaxis(x_data)
        .add_yaxis("Rental distribution in Xi'an",y_data)
        .set_global_opts(
            title_opts=opts.TitleOpts(title="Bar-Xi'an rental distribution map"),
            legend_opts=opts.LegendOpts(is_show=False),)
    )
    return bar
Encapsulate all the visual parts into functions for display.
page = (
    Page(layout=Page.DraggablePageLayout)
    .add(
        barPage(),
        piePage(),
        linePage(),
        funnelPage(),
        gaugePage())
)

page.render("page_demo.html")
Let's see the effect~~~

How, it's much better than finding one by one on the web page! It's more intuitive than looking at Excel