Recently, I saw many small partners looking for Worldpop population data. When Xiaobian went to see it before, the national image was about 4G, which was too big. However, Xiaobian has collected data for all the people in China, focusing on WeChat official account: GEEer Growth Diary. Available.
Today we mainly talk about how to use GEE to download data.
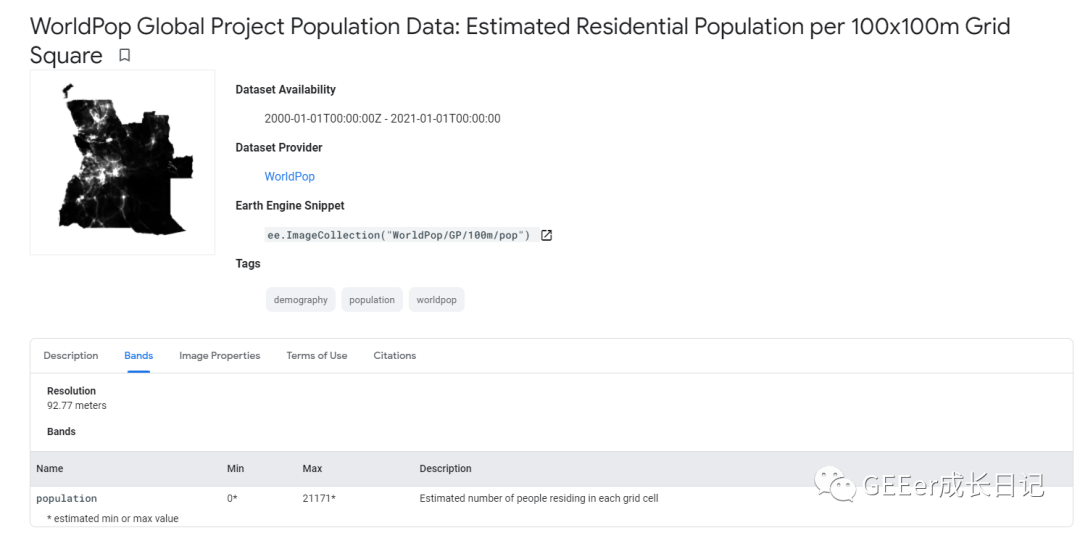
Let's first look at the introduction of Worldpop data:
Global high-resolution, contemporary data on human population distributions are a prerequisite for the accurate measurement of the impacts of population growth, for monitoring changes, and for planning interventions. The WorldPop project aims to meet these needs through the provision of detailed and open access population distribution datasets built using transparent and peer-reviewed approaches.
Full details on the methods and datasets used in constructing the data, along with open access publications, are provided on the WorldPop website. In brief, recent census-based population counts matched to their associated administrative units are disaggregated to ~100x100m grid cells through machine learning approaches that exploit the relationships between population densities and a range of geospatial covariate layers. The mapping approach is Random Forest-based dasymetric redistribution.
This dataset depict estimated number of people residing in each grid cell in 2010, 2015, and other years.
For 2020, the breakdown of population by age and sex is available in the WorldPop/GP/100m/pop_age_sex and WorldPop/GP/100m/pop_age_sex_cons_unadj collections.
We can see from the data set screening results that there are currently three data sets, and the latter two data sets contain the estimated age and gender structure. However, there are only 2020 data, which is convenient to download the demonstration of data. We still take the most basic population data as an example.
//Still the same, targeting Guangdong Province
var geometry = ee.FeatureCollection('users/ZhengkunWang/guangdongsheng')
Map.centerObject(geometry,6)
//This function is to crop the image of each year according to the region
var clipToCol = function(image){
return image.clip(geometry);
};
// import worldpop data
// And filter according to the abbreviations of our country. You can try without national restrictions. What is the situation of the image set
var worldpop = ee.ImageCollection("WorldPop/GP/100m/pop").filterBounds(geometry).map(clipToCol)
.filter(ee.Filter.eq('country', 'CHN')).select('population')
print(worldpop)
// set the start and end dates
var start = ee.Date.fromYMD(2020,1,1);
var end = ee.Date.fromYMD(2020,12,31);
//Take the average value in 2020 as an example
// filter for the period of interest
var worldpop2020 = ee.Image(worldpop.filterDate(start,end).mean());
// clip for the area of interest
worldpop2020 = worldpop2020.clip(geometry);
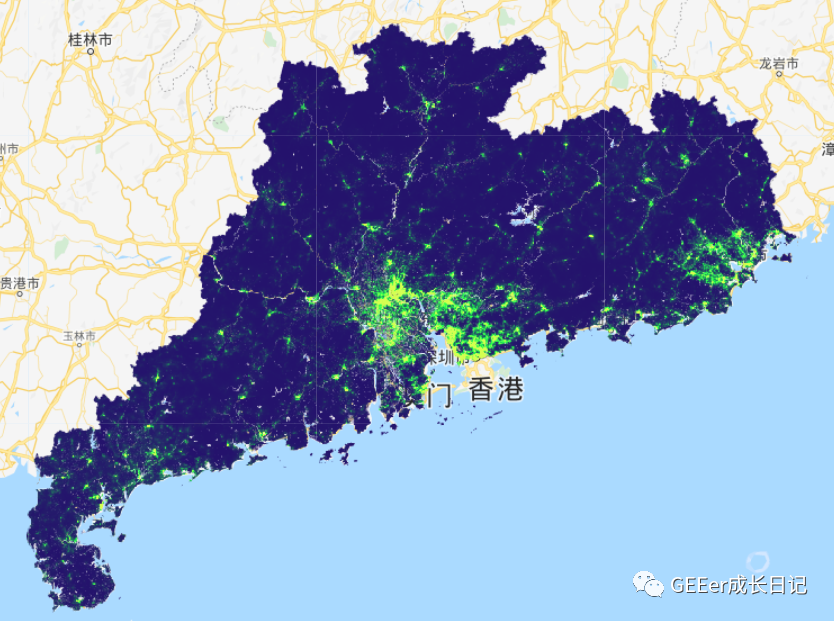
Map.addLayer(worldpop2020,{min:0,max:100,palette: ['24126c', '1fff4f', 'd4ff50']},"population 2020");
The results are shown in the figure below:
Let's look at how the population has changed in the past two decades:
var chart =
    ui.Chart.image.seriesByRegion
        ({
          imageCollection:worldpop,
          regions: geometry,
          reducer: ee.Reducer.sum(),
          scale: 100,
          xProperty: 'system:time_start'
        })
        .setSeriesNames(['population'])
        .setOptions({
          title: 'population dynamics',
          hAxis: {title: 'Date', titleTextStyle: {italic: false, bold: true}},
          vAxis: {
            title: 'total population',
            titleTextStyle: {italic: false, bold: true}
          },
          lineWidth: 5,
          colors: ['e37d05'],
          curveType: 'function'
        });
print(chart);
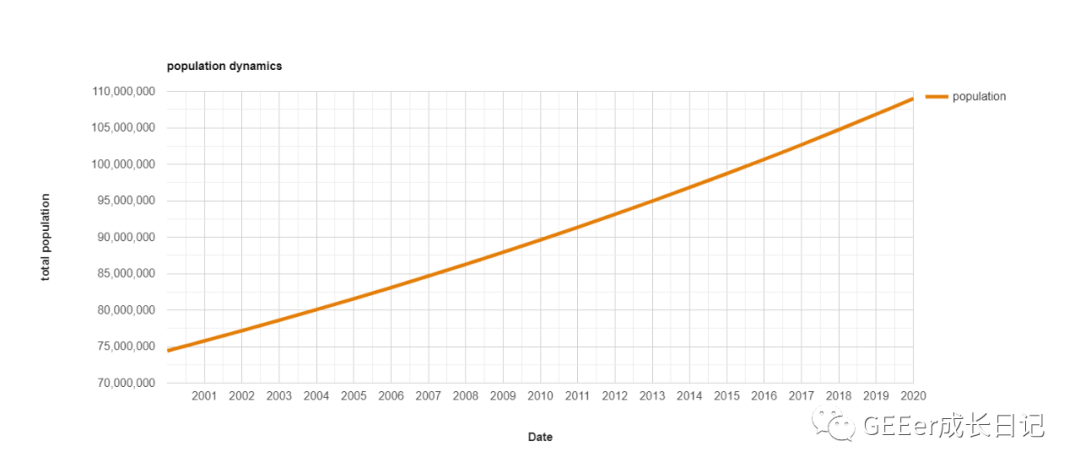
I don't know if I don't see it. I'm scared when I see it. Population goes straight to 1.1Y!!!
Next, there is the link of data download
After you use this formula, you can directly apply it to other data sets.
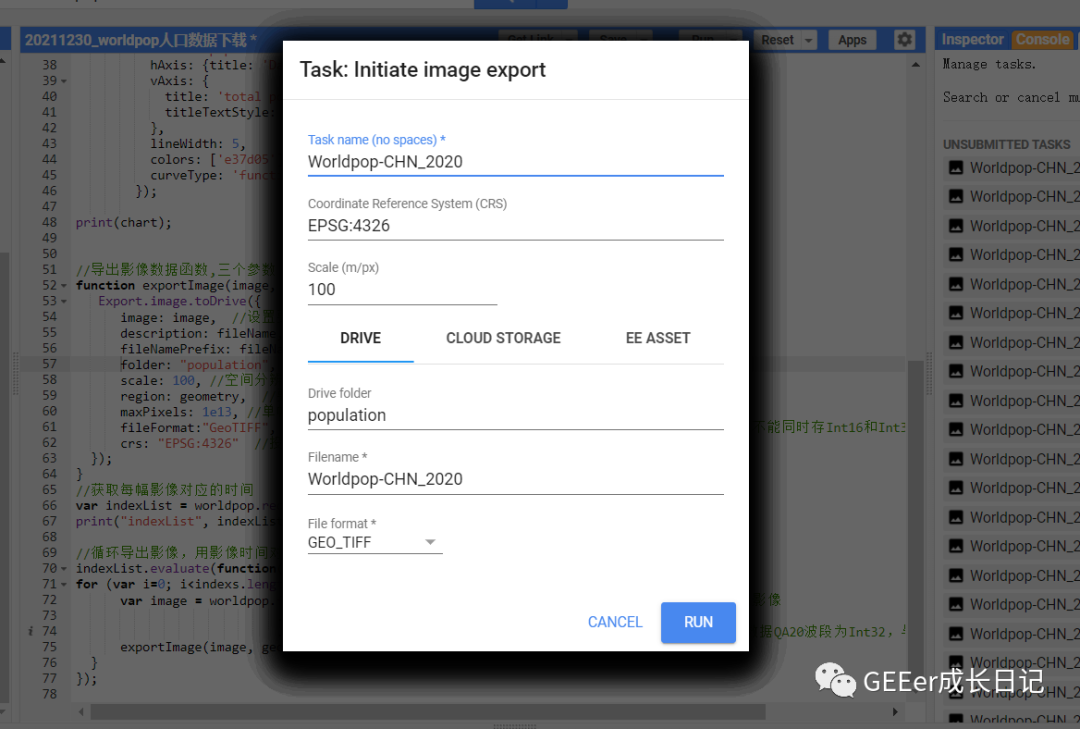
//Export image data function, three parameters
function exportImage(image, region, fileName) {
   Export.image.toDrive({
      image: image,  //Set the image to output
      description: fileName,  // Set the name of the download task tasks
      fileNamePrefix: fileName,  //Set the name of the downloaded image
      folder: "population",  //Set the name of the folder where the downloaded images are stored in the Drive (optional)
      scale: 100, //Spatial resolution in meters
      region: geometry,  //Range of images to download
      maxPixels: 1e13, //Maximum number of pixels for single image output
      fileFormat:"GeoTIFF", //Set the image export format. Note that the GeoTIFF format requires the same storage type of all bands (for example, Int16 and Int32 cannot be stored at the same time)
      crs: "EPSG:4326"  //The projection information is generally in the default mode and can usually be set to EPSG:4326
  });
}
//Get the time corresponding to each image
var indexList = worldpop.reduceColumns(ee.Reducer.toList(), ["system:index"]).get("list");
print("indexList", indexList);

//Export the image circularly and name it with the image time
indexList.evaluate(function(indexs) {
for (var i=0; i<indexs.length; i++) {
      var image = worldpop.filter(ee.Filter.eq("system:index", indexs[i])) //Filter images at the corresponding time
                           .first() //Select the first image
                           .int16() //Convert the storage format of all bands into Int16 to keep it consistent (the QA20 band of sentry 2 data is Int32, which will make an error if it is inconsistent with other bands)
      exportImage(image, geometry, "Worldpop-"+indexs[i]);
  }
});
At this time, the Task has been illuminated. Go and have a look!
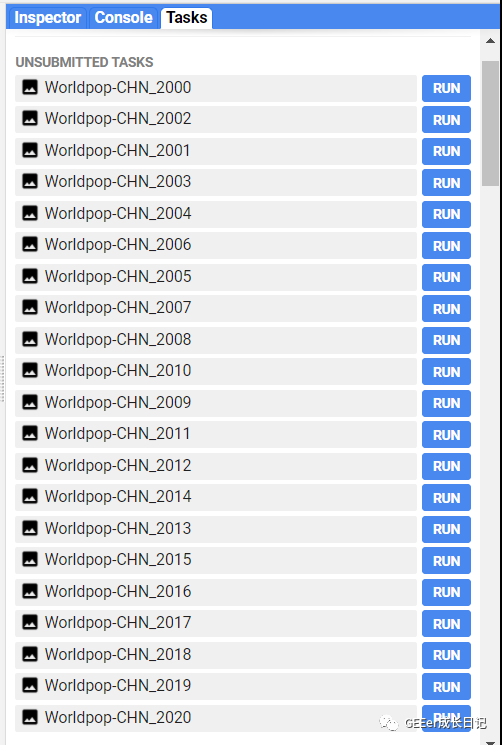
In view of the stupidity of each point, it's OK when there is little data, and it's really troublesome when there is a large amount of data. So Xiaobian also prepared a batch of RUN code for you, but there will be a jam when using it. It varies from computer to computer. Just wait patiently. Also, be careful that you don't have enough disk space. First download two to see the size.
For batch CODE, you need to press F12 on the CODE page and enter it on the console. After input, the effect is as follows:
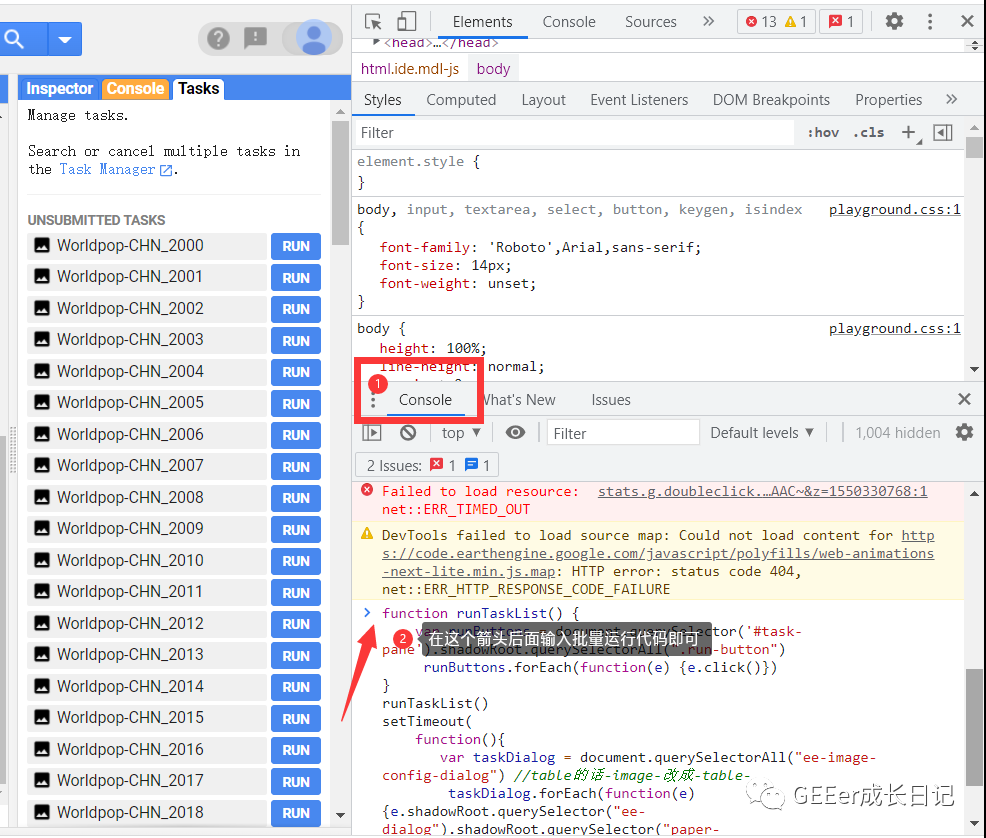
After entering, it will be like this. After clicking RUN, the card will be displayed. Please be patient and so on:
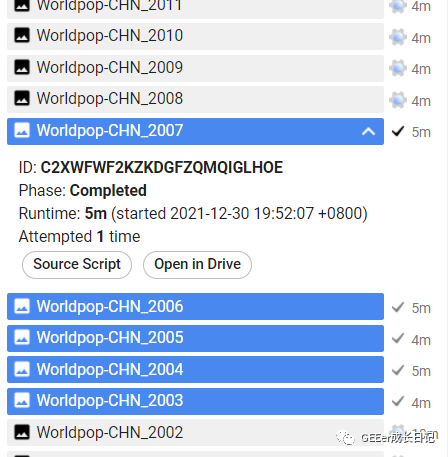
Xiaobian tried to run. A picture looks like four or five minutes, and the size is 5M. It's really convenient. Go and download it~
Code has been updated, and get the Worldpop population data visualization and data download code. Please reply in official account: 123101.
For code that runs batch downloading, please reply to official account number 123102.
If you can really help you, remember to make up a praise for Xiao~
Reference blog: https://mygeoblog.com/2021/09/16/population-dynamics/
For more highlights, please pay attention to: