1, ELK introduction
1. What is ELK?
"ELK" is an acronym for three open source projects: Elasticsearch, Logstash and Kibana.
- Elasticsearch is a search and analysis engine
- Logstash is a server-side data processing pipeline, which can collect data from multiple sources at the same time, convert data, and then send data to "repositories" such as Elasticsearch.
- Kibana allows users to visualize data using graphs and charts in Elasticsearch.
Official website: https://www.elastic.co/what-is/elk-stack
2. Role of Elk
In the current market, ELK is mostly used as a complete set of log collection system; It is more convenient for developers to check logs and locate bug s.
3. Official illustration
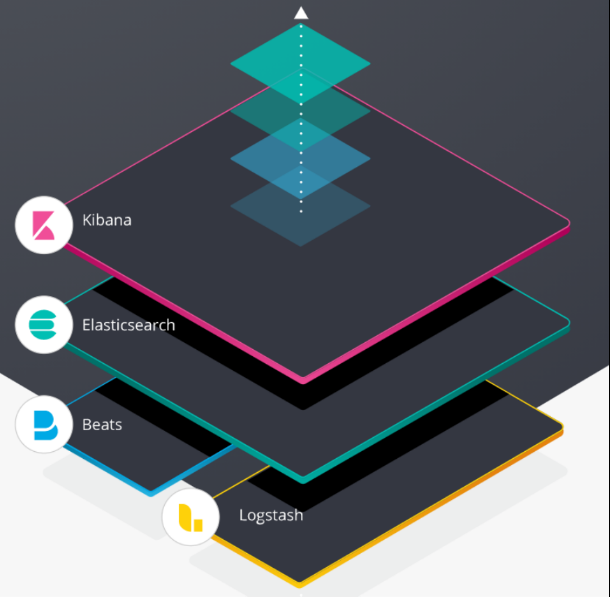
This is a picture of the official website, which vividly illustrates the use process of the whole ELK.
The bottom layer collects conversion logs based on Logstash and Beats; Then it is transmitted to ES for storage; Finally, developers view log data through Kibana graphical operation interface.
As for what is Beats, it will be explained later.
4. What are Beats?
Beats a series of lightweight single function data collectors were officially added to ELK after 2005. Since then, ELK's name has been officially called Elastic Stack, but we prefer to call it ELK verbally. After all, it's catchy!
2, Installation configuration of ELK
1. Installation premise description
1.1 ELK version requirements are consistent
There is a paragraph in the official document:
When installing the Elastic Stack, you must use the same version across the entire stack. For example, if you are using Elasticsearch 7.12.1, you install Beats 7.12.1, APM Server 7.12.1, Elasticsearch Hadoop 7.12.1, Kibana 7.12.1, and Logstash 7.12.1.
The software you want to install should be the same as the software you want to install.
Therefore, the recommended installation version is 7.12.1, which is the latest official version.
1.2 installing JDK
-
Download JDK package
Go to Oracle's official website to download.
-
install
# decompression
$ tar -zxvf java-1.8.0-openjdk.tar.gz -C /usr/local/elk
# Modify unzipped folder
$ mv elasticsearch.7.12.1 elasticsearch
-
to configure
Modify the / etc/profile file (vim /etc/profile) and add the content configuration
# jdk configuration
# The path of the decompressed jdk
JAVA_HOME=/usr/lib/jvm/java-1.8.0-openjdk-1.8.0.181-3.b13.el6_10.x86_64
PATH=$JAVA_HOME/bin:$PATH
CLASSPATH=.:$JAVA_HOME/lib/dt.jar:$JAVA_HOME/lib/tools.jar
JAVACMD=/usr/bin/java
export JAVA_HOME JAVACMD CLASSPATH PATH
-
take effect
Execute the command $source /etc/profile to make the configuration file effective.
-
test
# Execute command
$ java -version
openjdk version "1.8.0_181"
OpenJDK Runtime Environment (build 1.8.0_181-b13)
OpenJDK 64-Bit Server VM (build 25.181-b13, mixed mode)
1.3 turn off the firewall
We installed it in a virtual linux in the virtual machine software, so in order to achieve external network access, we chose to turn off the linux firewall. (you can also select the port to be accessed by the open amplifier)
1.4 establish a unified management directory
In the resume elk directory under / usr/local directory, the subsequent installed software is placed in this directory for unified management.
$ cd /usr/local
# elk unified directory
$ mkdir elk
1.5 creating new users
It is not nec es sary to set up a new user elk to start the software; Therefore, when you start the software later, you should switch to a new user.
Create a new user elk
# Create a new user
$ useradd elk
Give the elk user the permissions of the elk folder
# Perform the above operations under the root user (you need to switch to the root user to operate as long as linux prompts you to operate without permission)
$ chowm -R elk:elk ./elk

# Switch root user command
$ su root
2.ElasticSearch installation
2.1 installation
Install to the elk directory we created
# decompression
$ tar -zxvf elasticsearch.7.12.1.tar.gz -C /usr/local/elk
# Modify the unzipped folder name
$ mv elasticsearch.7.12.1 elasticsearch
2.2 configuration
There are three configuration files for es:
- elasticsearch.yml: Elasticsearch configuration
- jvm.options: JVM configuration for Elasticsearch
- log4j2.properties: Elasticsearch log configuration
jvm.options
Modify JVM Size of memory used in options
# Minimum occupied memory
-Xms1g
# Maximum occupied memory
-Xmx1g
elasticsearch.yml
# IP configuration: 0.0.0.0 can only be accessed through external network
network.host: 0.0.0.0
# Cluster configuration
cluster.initial_master_nodes: ["node-1"]
# Configure the name of the current es node
node.name: node-1
# Configure port number
http.port: 9200
2.3 startup
# Enter the es bin directory
$ cd /usr/local/elk/elasticsearch/bin
# Background start
$ nuhup ./elasticsearch &
# perhaps
$ ./elasticsearch -d
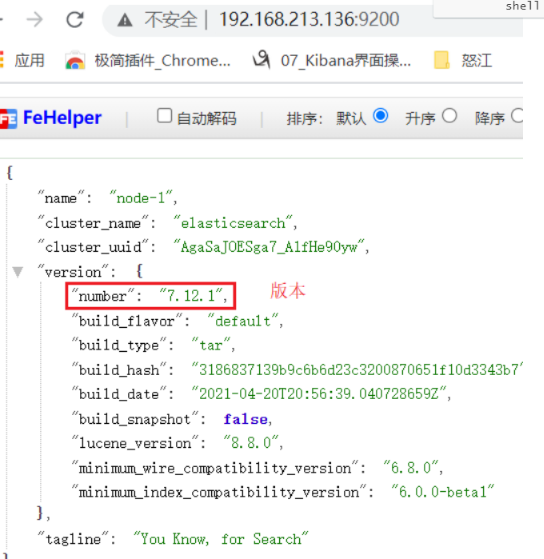
2.4 access
Visitor access: http://192.168.213.136:9200/ (the IP address is the IP address of the virtual machine, and the port is the port configured in elasticsearch.yml)
2.5 BUG
max file descriptors [65535] for elasticsearch process is too low
The above bug s are caused by insufficient program resources.
solve
-
Open / etc / security / limits Conf, add the following contents
# Note that the value of [65536] is set according to the error message
* soft nofile 65536
* hard nofile 65536
-
Edit / etc / PAM D / common session, add the following
session required pam_limits.so
-
Edit / etc/profile and add the following
ulimit -SHn 65536
-
View after restarting the computer
$ ulimit -n
3.Kibana
3.1 decompression
# decompression
$ tar -zxvf kibana-7.12.1-linux-x86_64.tar.gz -C /usr/local/elk
# Modify unzipped folder
$ mv kibana-7.12.1 kibana
3.2 configuration
Modify VIM / usr / local / elk / kibana / config / kibana YML file
kibana.yml
# kibana port
server.port: 5601
# Allow Internet access
server.host: "0.0.0.0"
# Monitor ES
elasticsearch.hosts: ["http://localhost:9200"]
3.3 startup
$ cd /usr/local/elk/kibana/bin
# Guard start
$ nohup ./kibana &
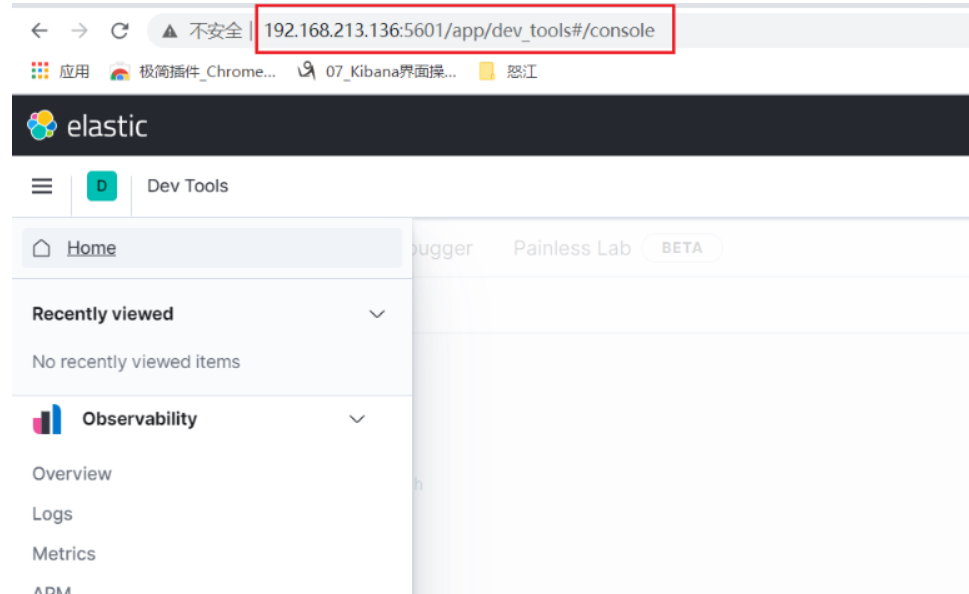
3.4 access
http://192.168.213.136:5601/
4.LogStash
4.1 installation
# decompression
$ tar -zxvf logstash-7.12.1-linux-x86_64.tar.gz -C /usr/local/elk
# Modify unzipped folder
$ mv logstash-7.12.1 logstash
4.2 configuration
Customize the transmission pipeline with ES
# Create conf.d folder
$ cd /usr/local/elk/logstash
$ mkdir conf.d
$ cd cd conf.d/
# Create logstash YML file
$ touch logstash.yml
$ vim logstash.yml
logstash.yml
In logstash Add a configuration to the YML file
# input
input{
	# Get data from filebeats
    beats {
        # The port must be 5044
        port => 5044
        # Log type
        type => 'systemlog'
        # code
        codec => plain {
          charset => "UTF-8"
        }
    }
}


# output
output {
    # Output to ES
    elasticsearch {
        # IP port address of ES
        hosts => ["192.168.213.136:9200"]
        # Log index output to ES (search this index in kibana to view log data)
        index => "elk-%{+systemlog}-%{+YYYY.MM.dd}"
    }
}
Modify logstash yml
$ cd /usr/local/elk/logstash/config
$ vim logstash.yml
Add and modify the following configurations:
# Configure custom transport pipeline directory
path.config: /usr/local/elk/logstash/conf.d
# Logstash IP address
http.host: "127.0.0.1"
# logstash port
http.port: 9623
4.3 startup
$ cd /usr/local/elk/logstash/bin
# -f starts with the specified profile daemon
$ nohup ./logstash -f /usr/local/elk/logstash/conf.d/logstash.yml &
5.Filebeat
5.1 installation
# decompression
$ tar -zxvf filebeat-7.12.1-linux-x86_64.tar.gz -C /usr/local/elk
# Modify and unzip price folder
$ mv filebeat-7.12.1 filebeat
5.2 configuration
Create text files for subsequent tests
# Create directory
$ cd /usr/local/elk
$ mkdir temp
$ cd temp
# create a file
$ touch test01.txt
$ touch test02.txt
filebeat.yml configuration
$ cd /usr/local/elk/filebeat
$ vim filebeat.yml
Add and modify the following configurations:
# ============================== Filebeat inputs ===============================

# Configure the log source of filebeat (it can also be understood as the file monitored by filebrat. When the monitored file is changed, filebeat will collect the log and send it to logstash)
filebeat.inputs:

# The file type (log indicates log file) supports multiple configurations
- type: log
  # Change to true to enable this prospectors configuration
  enabled: true
  # Listen for file paths and support wildcards
  paths:
    - /usr/local/elk/temp/test*.txt


# ------------------------------ Logstash Output -------------------------------
# Define filebeat transport destination
# Transfer the listening log of the file to logstash
output.logstash:
  # The port must be 5044, which is the same as the transmission channel port defined by logstash
  hosts: ["localhost:5044"]
5.3 startup
$ cd /usr/local/elk/filebeat
# Specifies the configuration file to launch
$ ./filebeat -c filebeat.yml
5.4 BUG
Sending Logstash logs to /var/log/logstash which is now configured via log4j2.properties
[2019-12-26T07:31:29,884][WARN ][logstash.config.source.multilocal] Ignoring the 'pipelines.yml' file because modules or command line options are specified
[2019-12-26T07:31:30,007][FATAL][logstash.runner ] Logstash could not be started because there is already another instance using the configured data directory. If you wish to run multiple instances, you must change the "path.data" setting.
[2019-12-26T07:31:30,026][ERROR][org.logstash.Logstash ] java.lang.IllegalStateException: Logstash stopped processing because of an error: (SystemExit) exit
Reason: the previously run filebeat instance is buffered and saved in path It's in there lock file, delete it.
solve
$ cd /usr/local/elk/filebeat/data
# see. lock file, click [.] The files at the beginning are hidden files, which need - a to be displayed
$ ls -a
# After deleting the file, restart it
$ rm -rf .lock
3, Use test of ELK
After starting ES, Kibana, LogStash and FileBeat in order, delete and add test01 Txt file; FileBeat will collect logs and transfer them to LogStash, and then transfer them to ES after processing.
When developers customize the data transmission pipeline in LogStash through Kibana, the configured ES index can view the log data.
During the construction process, many pits were encountered, and it took two days to build them; If you encounter problems, check the official documents and you can basically find the answer. (keep your original heart and precipitate yourself)