preface
Environment: CentOS 7 0 zabbix-server5. four point three
In this chapter, we will first look at how to create monitoring items and graphics, and then create custom monitoring items according to the requirements of the host.
Create monitor item
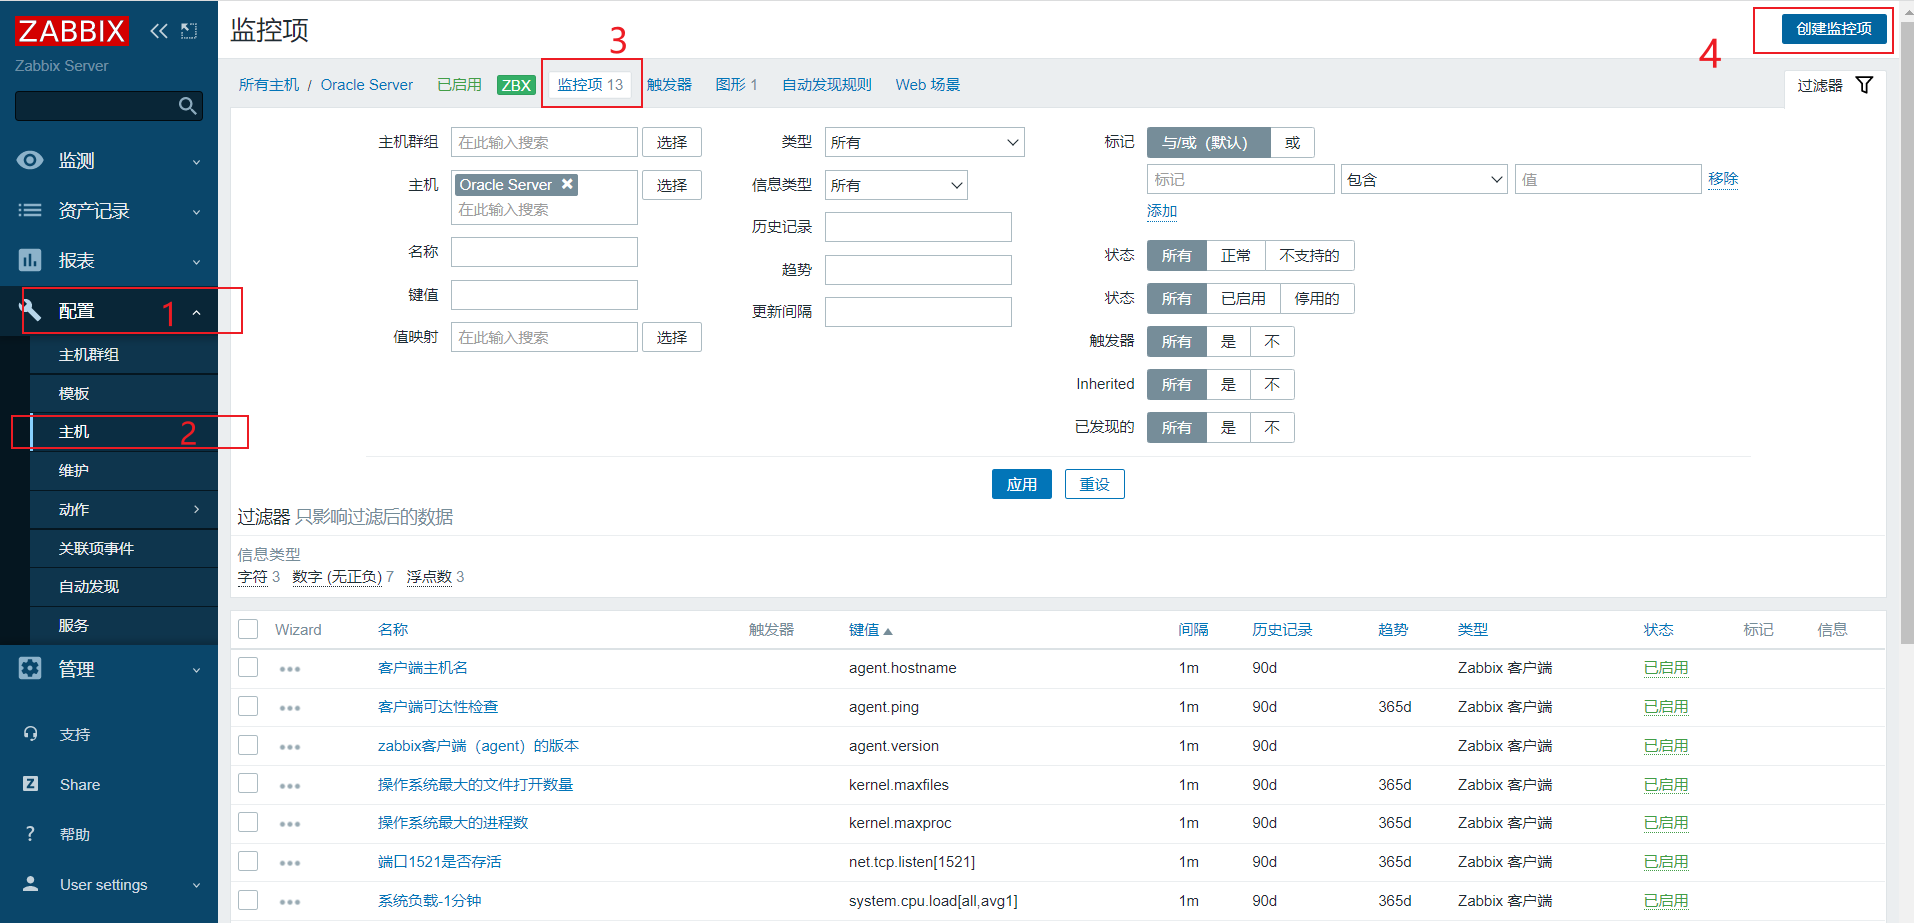
After selecting a host, select Create monitoring item, as shown below:
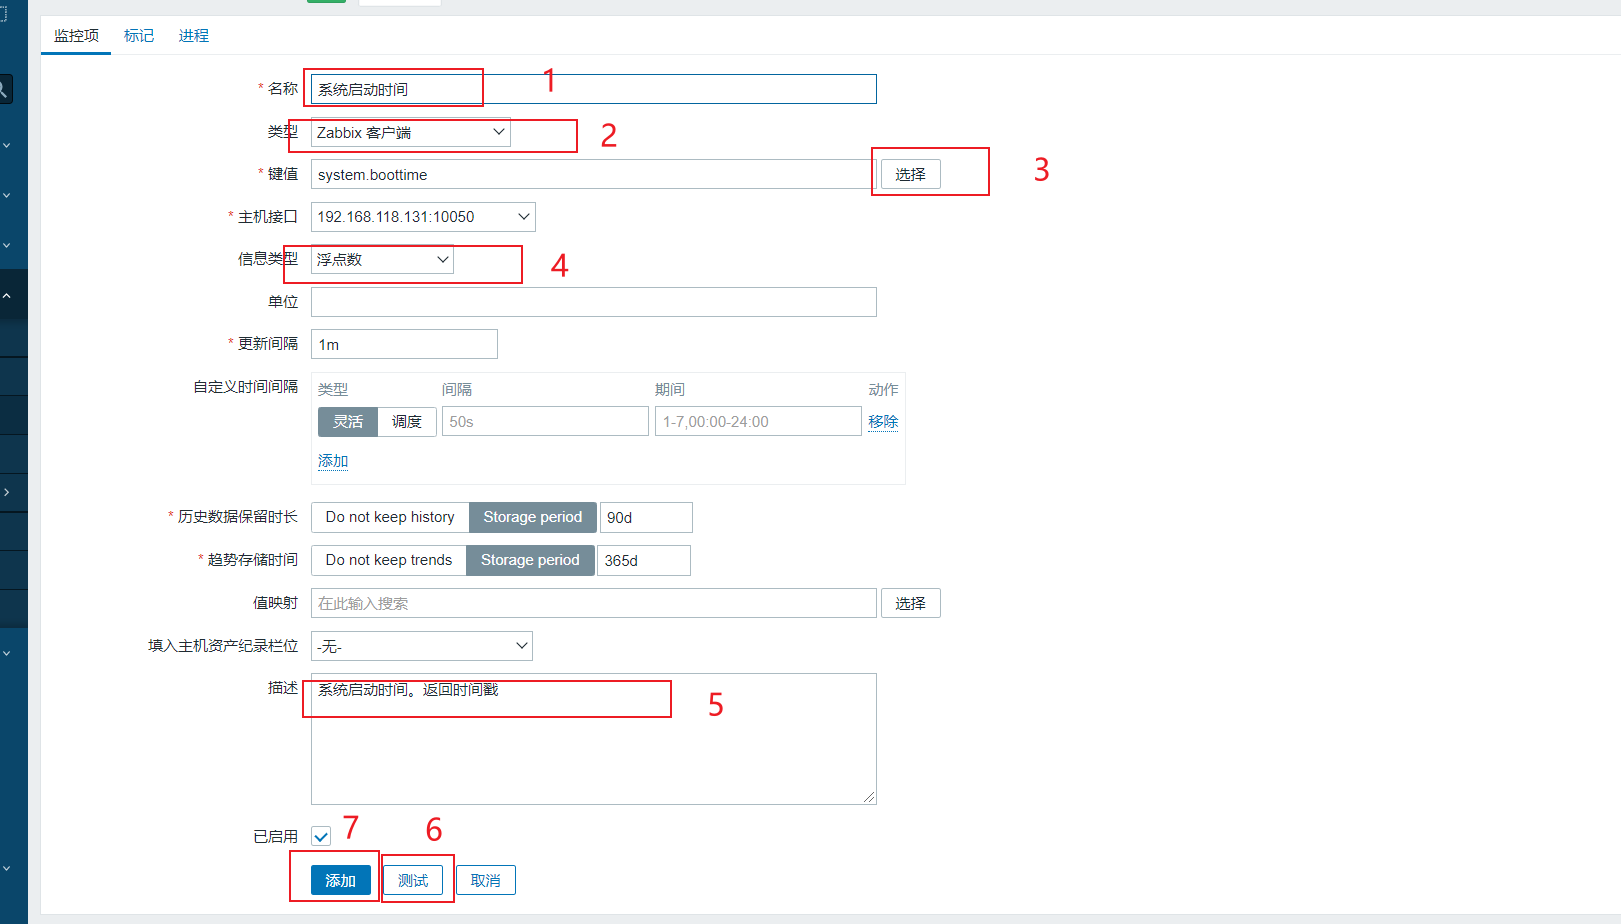
Then select a key value according to the following operations. The developers of zabbix provide us with a pile of commonly used key values. We just need to see which one we need and select it. Note that different key values have different return types. Select it in the information type item, as shown in the following operations:
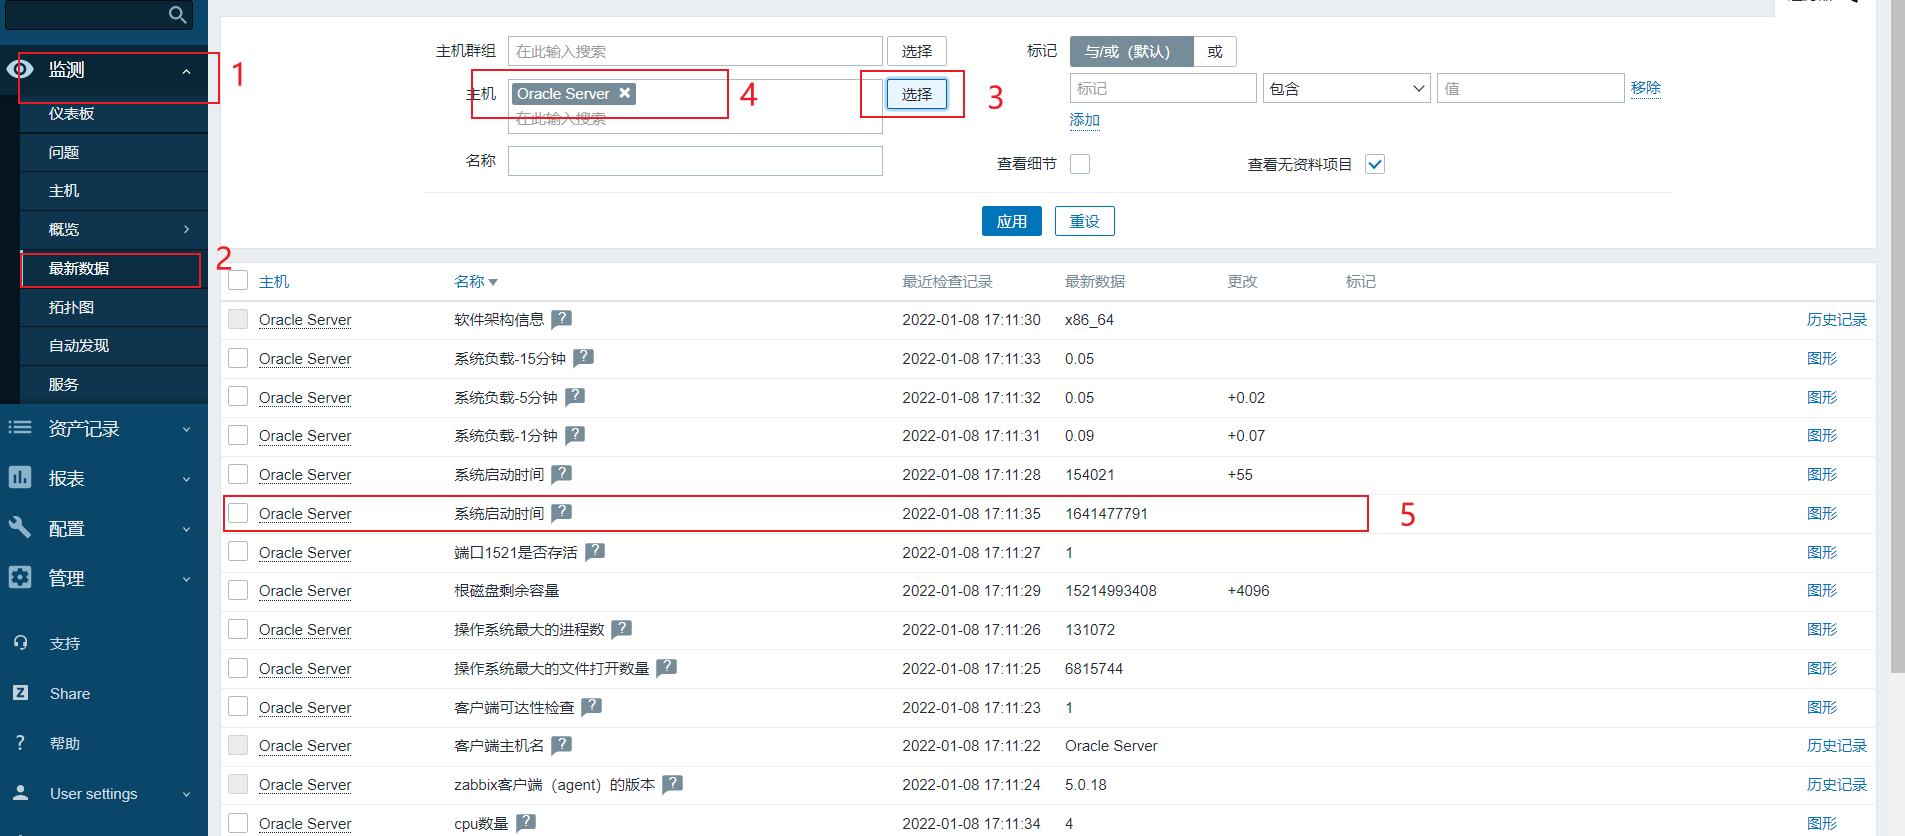
After successful creation, you can view the data normally, as follows:
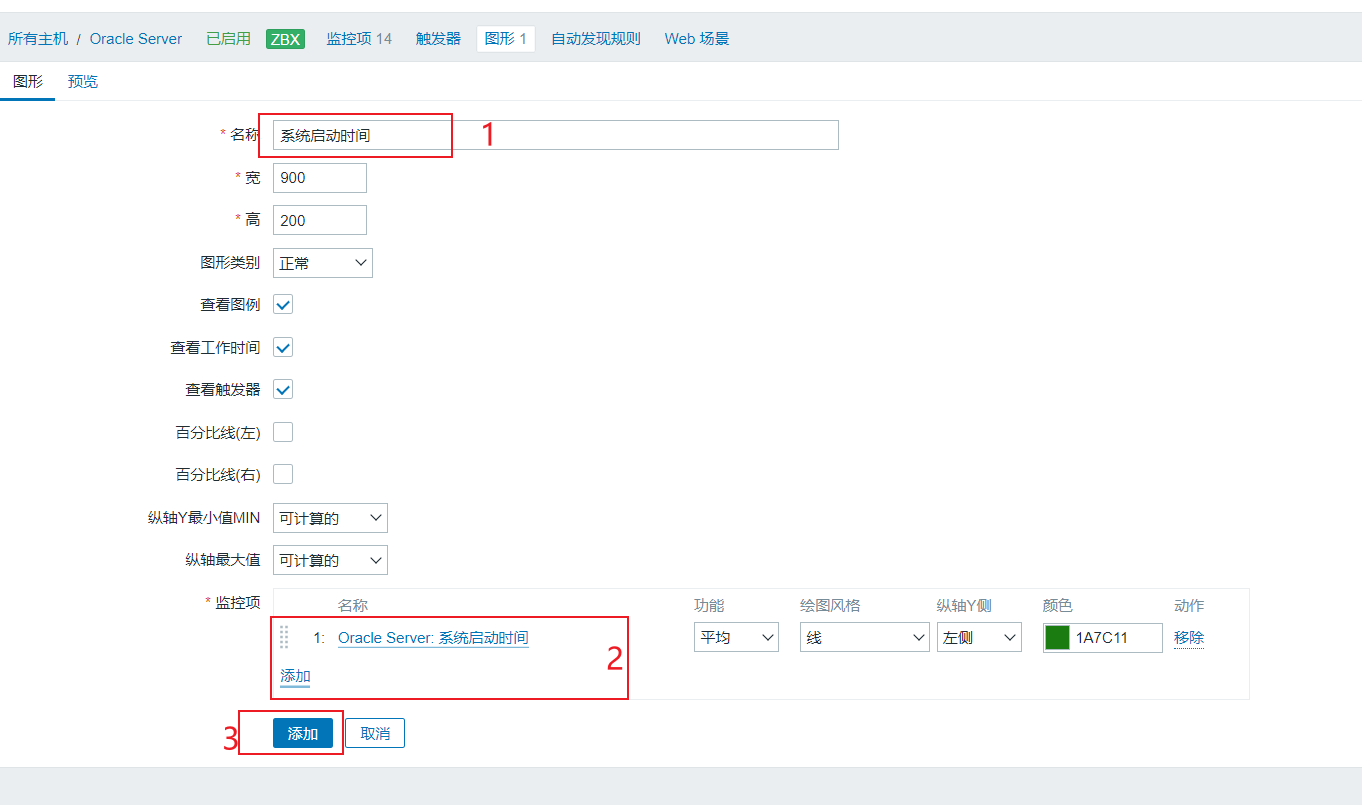
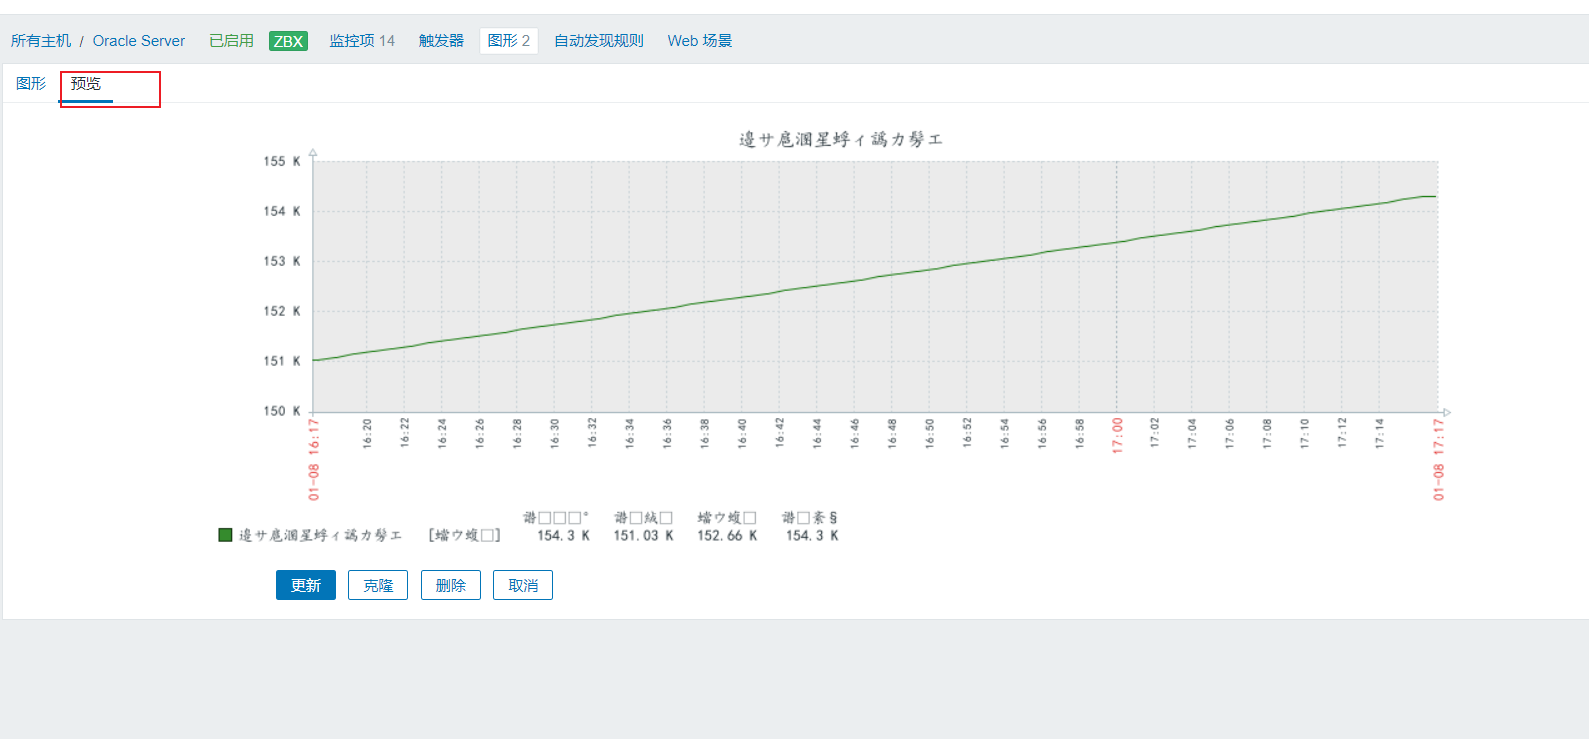
Create a graph for a monitor item
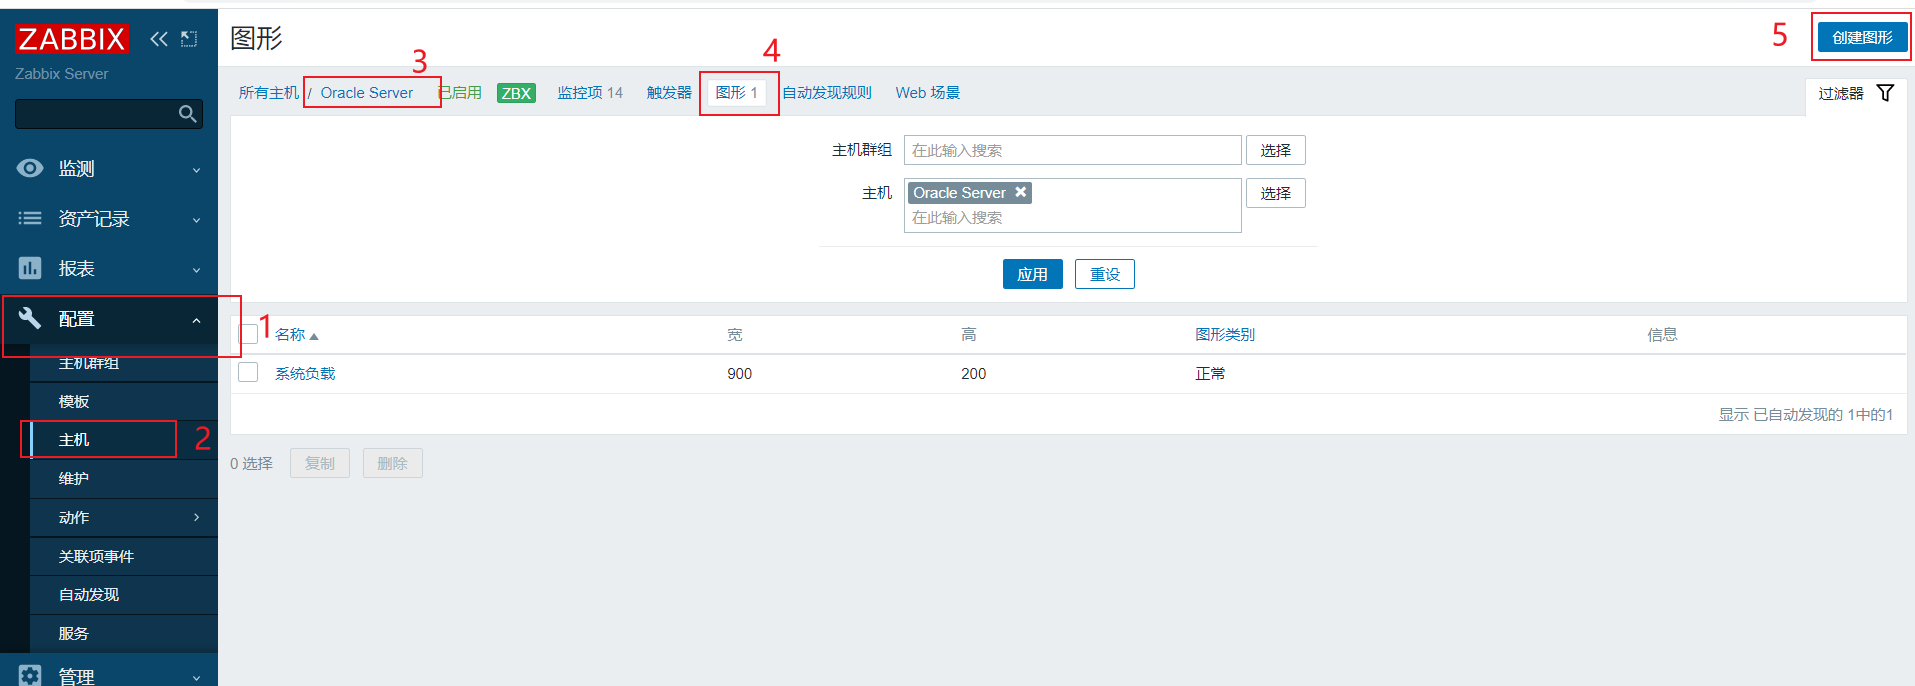
In order to more conveniently view the data monitored by the monitoring item, we need a graphical display, as shown below, to create a graph for the monitoring item:
User defined monitoring item (ZABBIX agent user defined key)
We need to select a key value to create a monitoring item, but the requirements are ever-changing. zabbix's own key value can no longer meet our needs, so we need to develop our own key value to customize the monitoring item. Here, simulate creating a user-defined key value to create a monitoring item.
1. In the ZABBIX agent client, customize a key value loginuser to count the number of login users in the Linux system_ num
Find the following information:
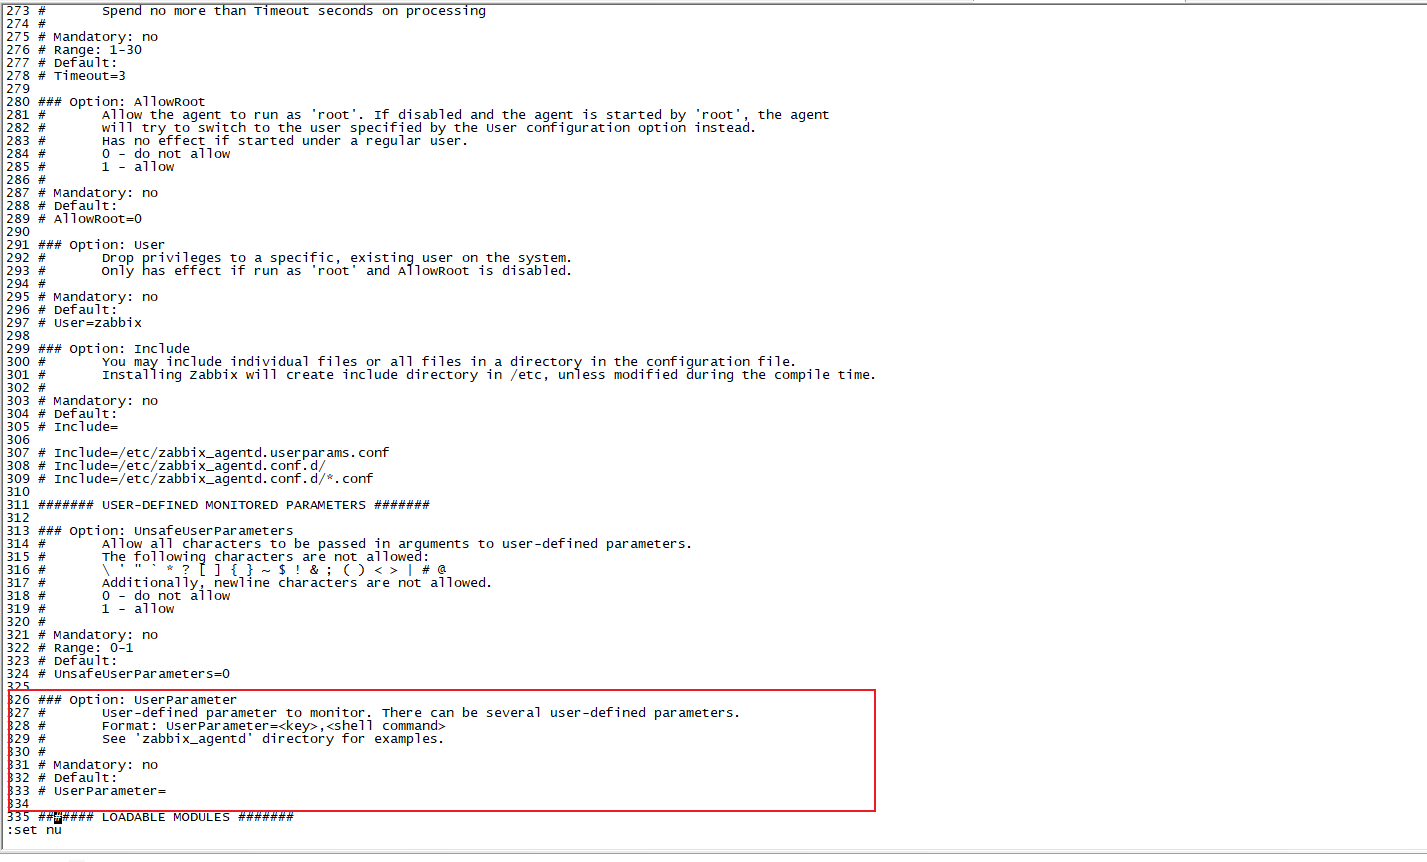
[root@Oracle11g zabbix]# vim /etc/zabbix_agentd.conf		#Modify the configuration file of ZABBIX agent client
UserParameter=loginuser_num,who | wc -l
#UserParameter means user-defined parameter, loginuser_num represents a key whose value is the return value of the following who | wc -l command
[root@Oracle11g zabbix]# systemctl restart zabbix-agent.service		#Restart ZABBIX agent client service
zabbix_ The get command tests whether the ZABBIX server server can obtain the key of the client
The ZABBIX agent client has successfully customized the key value, named loginuser_num, can the ZABBIX server server get the value of this parameter of the client? We can test whether the server can read this key value on ZABBIX server, as shown below:
#Using zabbix_get parameter detection
[root@nginx bin]# cd /usr/local/zabbix/bin							#On the ZABBIX server, switch to ZABBIX_ Under the directory of get command
[root@nginx bin]# ./zabbix_get -s 192.168.118.131 -p 10050 -k loginuser_num		#-s specifies the IP address of the agent, - p specifies the port 10050 of the agent, - k represents the key value defined by itself, as shown below. The value has been successfully obtained
5
[root@nginx bin]#
Create custom monitoring items on the web side
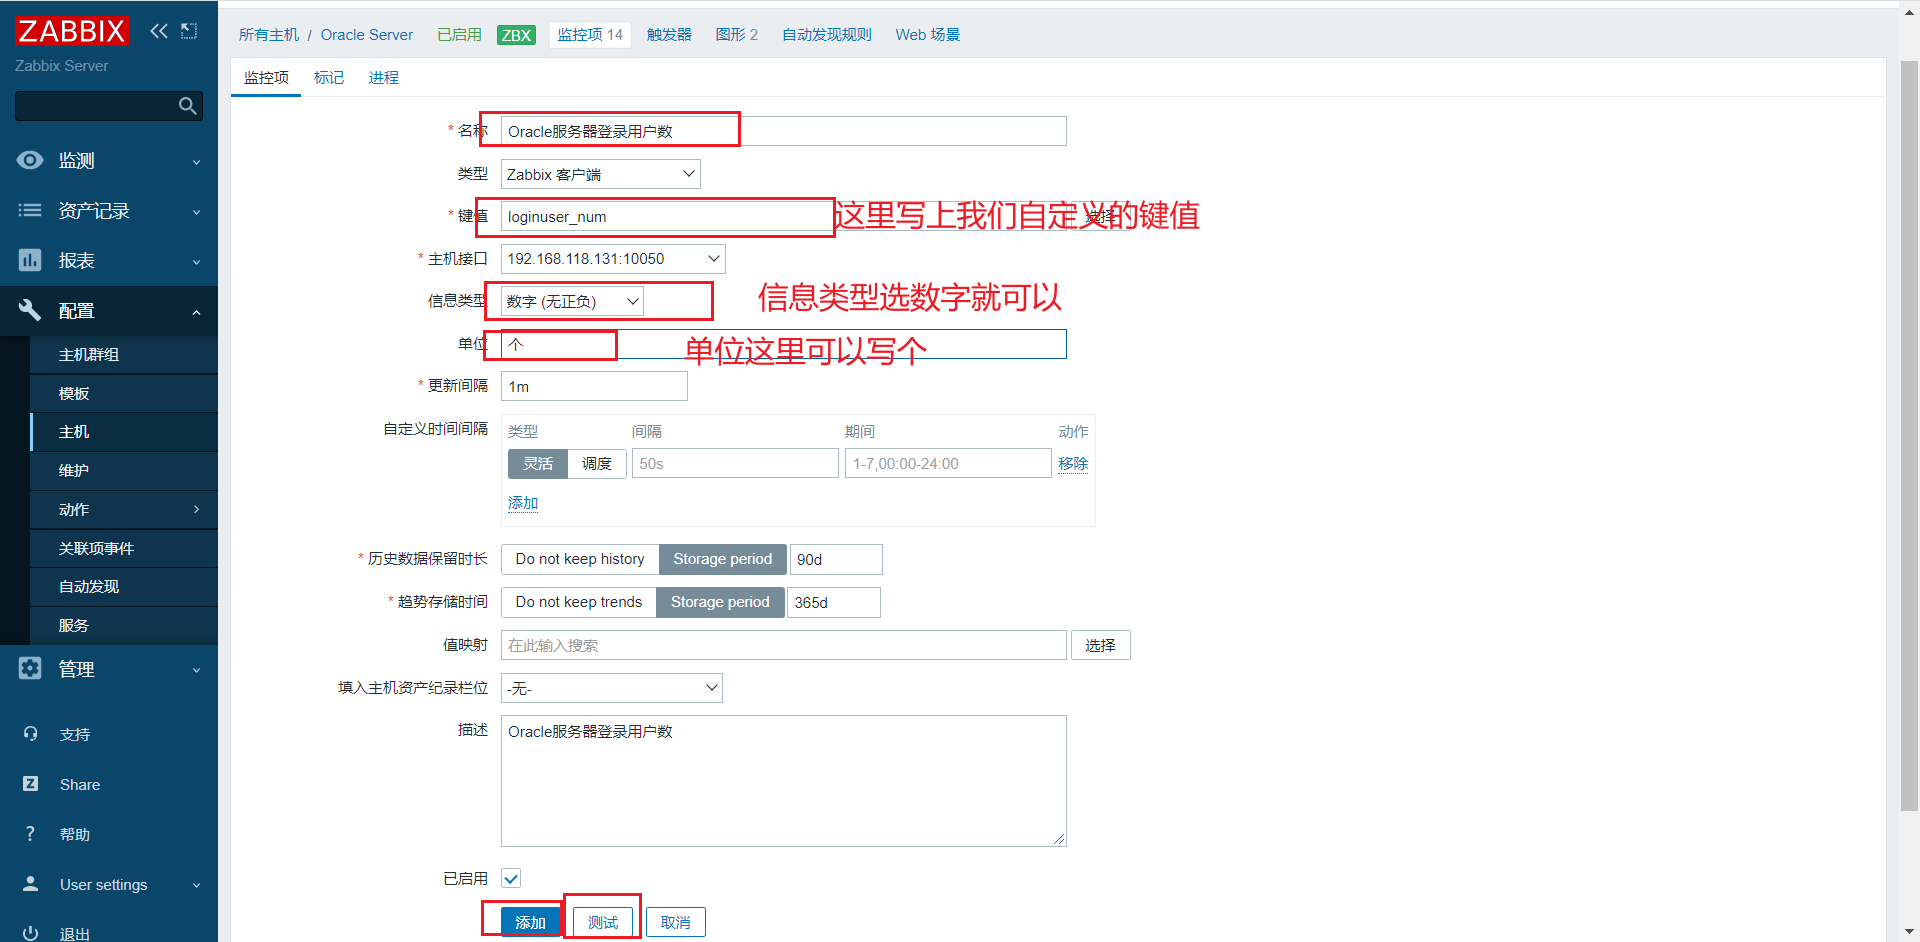
We then create a login user for the ZABBIX agent client_ The key value of num, ZABBIX server can also successfully get the value returned by this key value. Let's create a monitoring item on the web page:
To create a drawing:
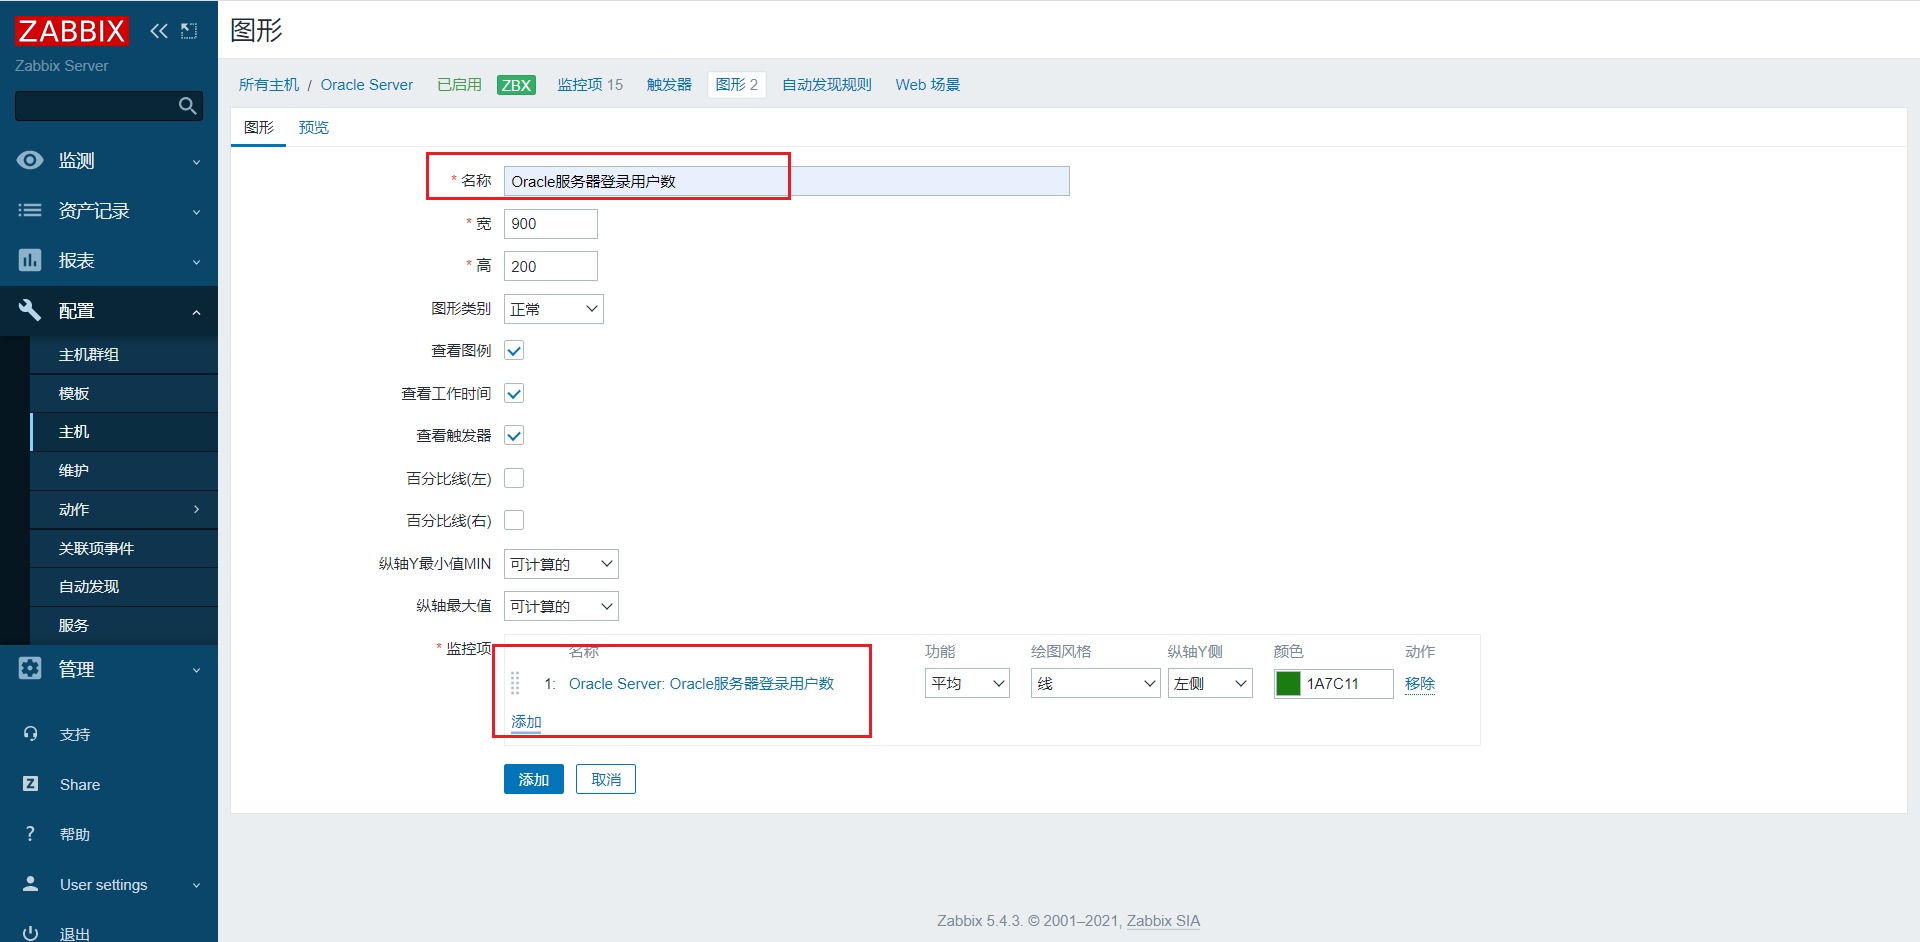
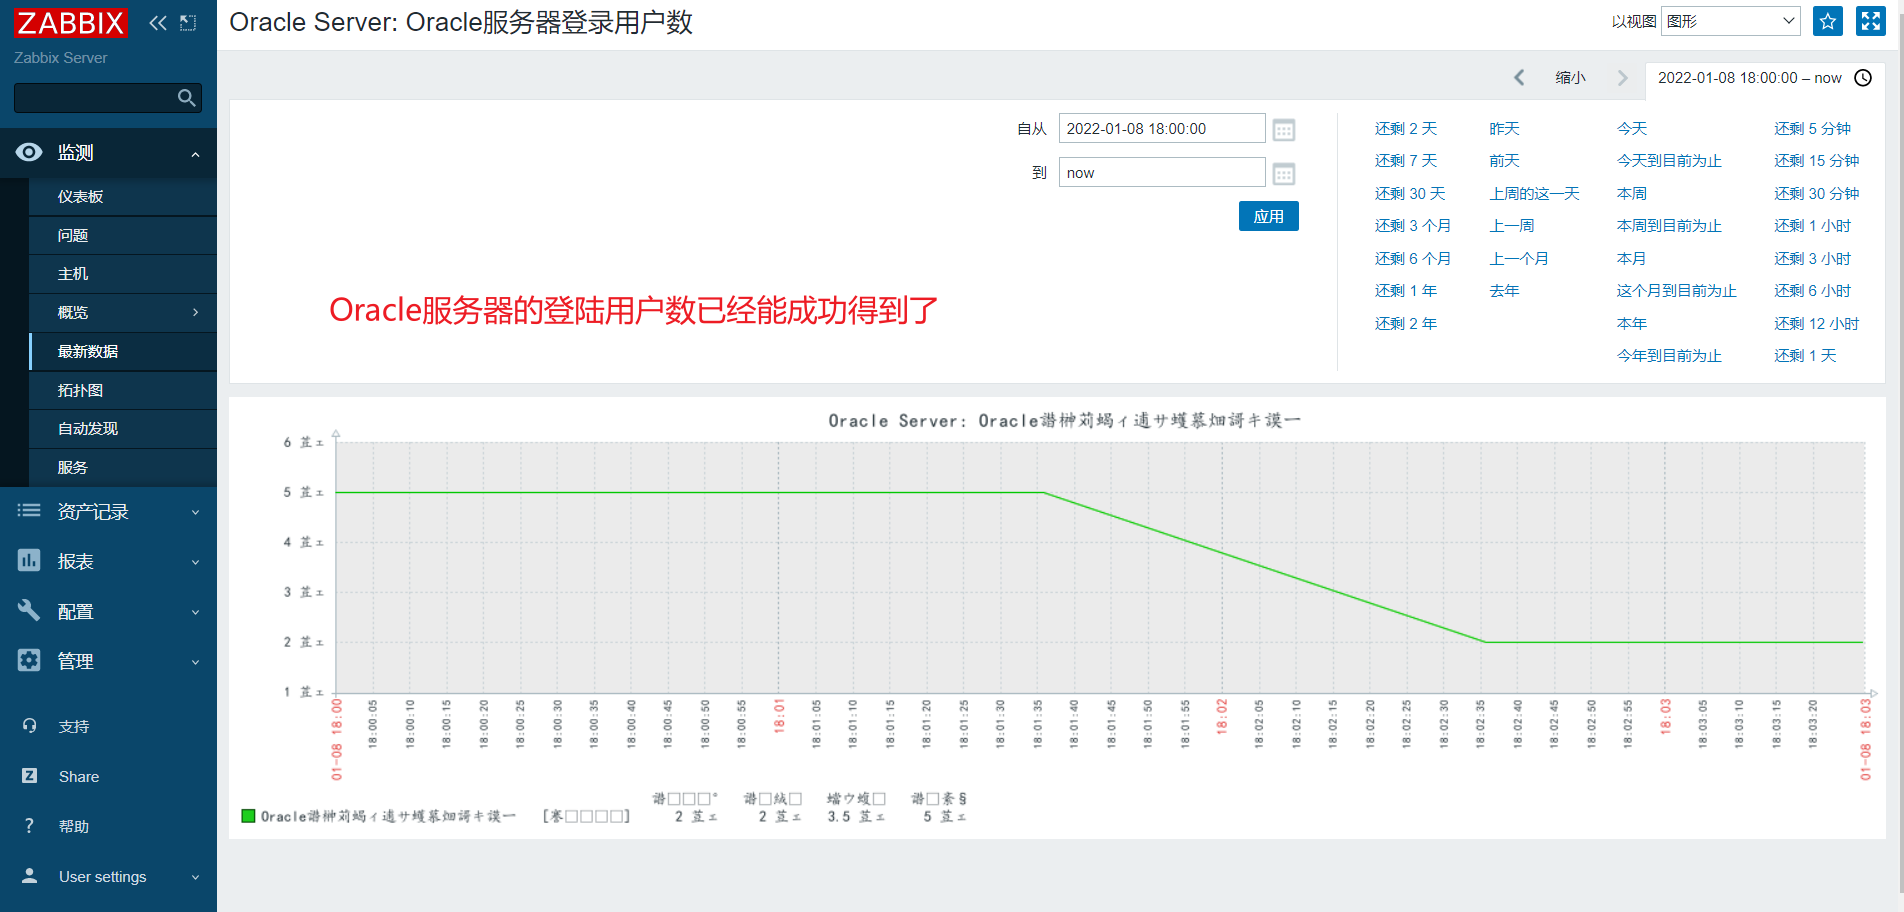
The above is the process of customizing monitoring items.
summary
1,stay zabbix-agent The configuration file of the client, find the following line of key information and modify it
### Option: UnsafeUserParameters
# UnsafeUserParameters=0
### Option: UserParameter
#       User-defined parameter to monitor. There can be several user-defined parameters.
#       Format: UserParameter=<key>,<shell command>
UserParameter=loginuser_num,who | wc -l
#loginuser_num is a custom key, and the value of the key is the return value of the shell command who | wc -l after the comma
[root@Oracle11g zabbix]# systemctl restart zabbix-agent.service 	#The configuration file has been modified. Restart ZABBIX agent service

2,stay zabbix-server Server use zabbix_get Command test whether the client defined key value
[root@nginx ~]# cd /usr/local/zabbix/bin
[root@nginx bin]# ./zabbix_get -s 192.168.118.131 -p 10050 -k loginuser_num		#Specify the IP port name of the client
5
[root@nginx bin]#

3,web Page create monitor item test
 Create monitor item-->Fill in the name-->Fill in the key value column loginuser_num(No longer a choice zabbix Internally provided key value)-->Others can be filled in according to normal information. Create a drawing.

4,View the latest data. If the data is displayed normally, it indicates that the user-defined monitoring item is created successfully.