Zabbix enterprise distributed monitoring
Skill objectives:
- Get to know Zabbix
- Zabbix Server will be installed
- Zabbix Agent will be installed
- Zabbix Proxy will be installed
- Zabbix will be configured
First met Zabbix
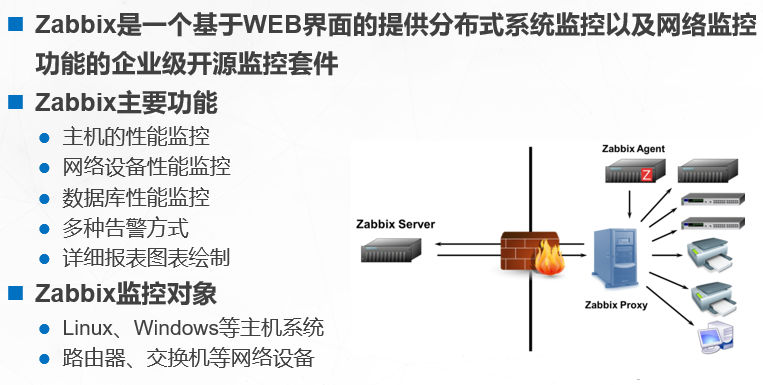
Zabbix is an enterprise class open source solution based on Web interface to provide distributed system monitoring and network monitoring functions. Zabbix is a highly integrated network monitoring suite, which can provide the following features through a software package.
- data collection
(1) Availability and performance test;
(2) Support SNMP(trapping and polling), IPMI and JMX monitoring;
(3) Custom detection;
(4) Collect receipts at custom intervals;
(5) Three roles: Server, Proxy and Agent.
- Flexible threshold definition
It allows flexible customization of problem thresholds, which are called triggers in Zabbix and stored in the back-end database.
- Advanced alarm configuration
(1) You can customize alarm escalation, receiver and alarm mode;
(2) Alarm information can be configured and macro variables can be used;
(3) Implement automatic actions through remote commands.
- Real time drawing
Through the built-in drawing method, the real-time drawing of monitoring data is realized.
- Extended graphical display
(1) Allow user-defined creation of multi monitor item view;
(2) Generate network maps;
(3) Customize the screen and slide shows, and allow them to be displayed on the dashboard page;
(4) Generate monitoring reports.
- Historical data storage
(1) Data is stored in the database;
(2) Historical data can be configured;
(3) Built in data cleaning mechanism.
- Simple configuration
(1) One time configuration, lifelong monitoring, unless adjusted or deleted;
(2) Allows you to add monitoring devices using templates.
- Template use
(1) Group monitoring can be added to the template;
(2) Templates allow inheritance.
- Automatic network discovery
(1) Automatic discovery of network equipment;
(2) Agent automatic registration;
(3) Automatically discover file systems, network card devices, SNMP OID s, etc.
- Fast Web interface
(1) The web front end is written in PHP;
(2) Accessibility.
- Zabbix API
Zabbix API provides program level access interface, which can be quickly accessed by third-party programs.
- Permission system
(1) Secure authority authentication;
(2) Users can limit the list allowed to be maintained.
- Full feature, easy to expand Agent
(1) Deploy on the monitoring target;
(2) Support Linux and Windows.
- Binary daemon
(1) C language development, high performance, low memory consumption;
(2) Easy to transplant.
- Ability to deal with complex environmental conditions
It is very easy to create remote monitoring through Zabbix Proxy.
This chapter will mainly introduce how to install Zabbix Server, Zabbix Agent, Zabbix Proxy and how to use Zabbix to realize flexible and convenient monitoring functions.
Zabbix role and architecture
1. Zabbix Server
zabbix_server is the Zabbix server daemon. The data of Zabbix agent and Zabbix Proxy are finally submitted to the server.
Of course, not all data are actively submitted to Zabbix Server, and some servers actively obtain data.
2. Zabbix Agent
zabbix_agentd is a client daemon, which is mainly used to collect client data, such as CPU load, memory, hard disk usage, etc.
3. Zabbix Proxy
zabbix_proxy is a Zabbix proxy daemon with functions similar to Server. The difference is, zabbix_proxy
It is just a transit station, which needs to submit / submit the collected data to the Server.
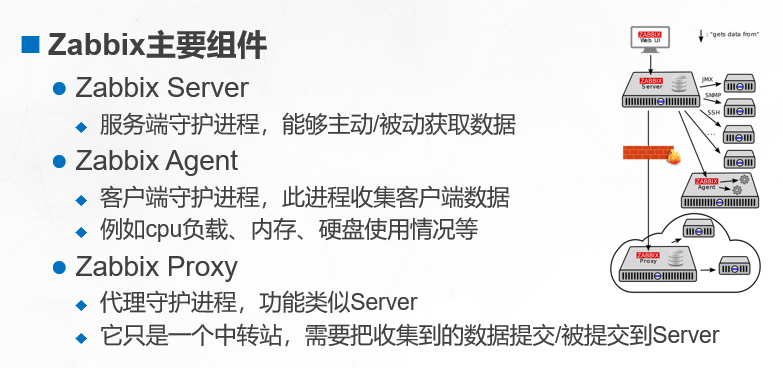
Overall architecture of Zabbix
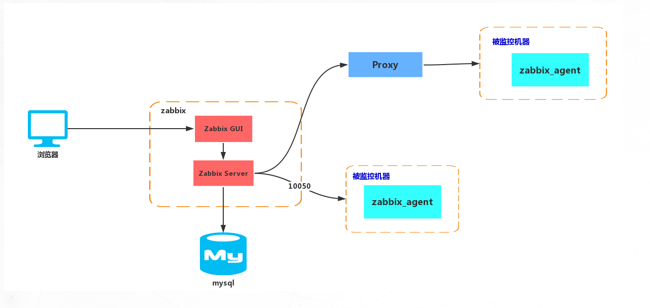
Zabbix deployment implementation
Introduction to experimental environment
| host | System and version | to configure | IP | assembly |
|---|---|---|---|---|
| server | CentOS7.9 | 1C/2G | 192.168.10.101 | Zabbix Server,MySQL |
| porxy | CentOS7.9 | 1C/2G | 192.168.10.102 | Zabbix Porxy,MySQL |
| agent1 | CentOS7.9 | 1C/1G | 192.168.10.103 | Zabbix agent |
| agent2 | CentOS7.9 | 1C/1G | 192.168.10.104 | Zabbix agent |
Suggestion: there should be at least three hosts, of which the Server can be on the same machine as the database, and the other two should be installed with Agent and Proxy respectively.
Experimental steps
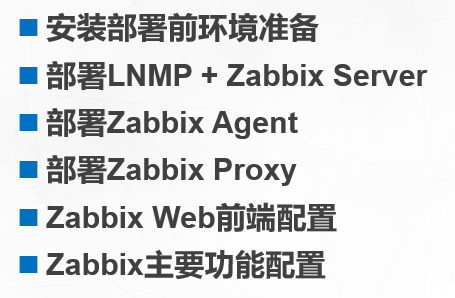
Prepare the experimental environment
First, initialize the environment, then install the YUM source, and then install the MySQL database.
1. Environment initialization
All node operations
- It is recommended to install CentOS 7.3 and above in Linux operating system;
- Intranet interworking between machines. Please turn off firewalls such as firewall during deployment;
- Close SELinux;
- Install time synchronization server
Modify host name
192.168.10.101 host
hostnamectl set-hostname server
su

192.168.10.102 host
hostnamectl set-hostname proxy
su

192.168.10.103 host
hostnamectl set-hostname agent1
su

192.168.10.104 host
hostnamectl set-hostname agent2
su
Turn off the firewall
systemctl stop firewalld
systemctl disable firewalld
Close SELinux
setenforce 0
sed -i "s/SELINUX=enforcing/SELINUX=disabled/g" /etc/selinux/config
Configure time synchronization server
yum install chrony -y
systemctl enable chronyd
systemctl start chronyd
chronyc sources
2. YUM source installation
All node operations
rpm -Uvh http://dl.fedoraproject.org/pub/epel/epel-release-latest-7.noarch.rpm
rpm -Uvh http://repo.zabbix.com/zabbix/3.2/rhel/7/x86_64/zabbix-release-3.2-1.el7.noarch.rpm
3. Install database
Here, the server database and proxy database are not deployed on the same host. If you want to deploy on the same host, you can directly create a database on the same host
server node operation
yum install -y mariadb-server
systemctl start mariadb
systemctl enable mariadb

mysql        #Initial password is empty
MariaDB [(none)]> CREATE DATABASE zabbix character set utf8 collate utf8_bin;
#Create the zabbix library and specify the character set as utf8

MariaDB [(none)]> USE mysql;
#Switch to myql Library

MariaDB [mysql]> UPDATE mysql.user SET password = PASSWORD('zabbix') WHERE user = 'root';
 #Set the root account password to 'zabbix'

MariaDB [mysql]> GRANT ALL PRIVILEGES ON zabbix.* TO zabbix@'localhost' IDENTIFIED BY 'zabbix';
#Authorize the zabbix account to use the password 'zabbix' to access the zabbix database locally. If there is no zabbix database, it will be created by itself

MariaDB [mysql]> GRANT ALL PRIVILEGES ON zabbix.* TO zabbix@'%' IDENTIFIED BY 'zabbix';
#Authorize the zabbix account to use the password 'zabbix' to remotely access the zabbix database. If there is no zabbix database, it will be created by itself

MariaDB [mysql]> FLUSH PRIVILEGES;  #Update database

mysql> quit;
Deploy LNMP + Zabbix Server
server node operation
Before deploying Zabbix Server, first configure LNMP environment, which is Linux
+Nginx+MySQL+PHP is the abbreviation of php script language running environment commonly used in Linux system.
Install Nginx and PHP FPM
yum install -y nginx php-fpm
Install MySQL based Zabbix Server and Zabbix Web
yum install -y zabbix-server-mysql-3.2.11
yum install -y zabbix-web-mysql
Initialize Zabbix database
zcat /usr/share/doc/zabbix-server-mysql-3.2.*/create.sql.gz | mysql -uzabbix -p zabbix
Log in to the database to view the table structure
mysql -uroot -p
Enter password:     #The password is zabbix

MariaDB [(none)]> show databases;
MariaDB [(none)]> use zabbix;
MariaDB [zabbix]> show tables;
MariaDB [zabbix]> quit;
Edit Zabbix Server configuration file and modify database connection information
vim /etc/zabbix/zabbix_server.conf
 Omit some contents.......`

DBHost=localhost        #zabbix database address is local
DBName=zabbix           #The name of the zabbix database is zabbix
DBUser=zabbix           #The user of zabbix database is zabbix
DBPassword=<password>   #The password entered here is the actual password to log in to the database, zabbix
Start ZABBIX server
systemctl start zabbix-server
systemctl enable zabbix-server
Edit Nginx profile
In the Nginx configuration file, add the following parts and add php module support.
vim /etc/nginx/nginx.conf
    server {
        listen       80 default_server;
        listen       [::]:80 default_server;
        server_name  _;
        index index.html index.php;   #Add php module support.
        root         /usr/share/nginx/html;


        location / {
        index index.html index.php;
        }
        location ~ \.php$ {
                 fastcgi_buffer_size 128k;
                 fastcgi_buffers 32 32k;
                 include fastcgi_params;
                 fastcgi_pass 127.0.0.1:9000;
                 fastcgi_index index.php;
                 fastcgi_param SCRIPT_FILENAME
                 $document_root$fastcgi_script_name;
        }
Edit PHP INI file
In PHP INI file, modify the following configuration items, because there will be detection when logging in zabbix graphical interface. If the monitoring fails, you can't log in to zabbix
vim /etc/php.ini
 Omit some contents........
post_max_size = 16M
max_execution_time = 300    #Maximum execution time
max_input_time = 300        #Maximum input time
memory_limit = 128M         #Memory limit
upload_max_filesize = 2M    #Maximum upload file size
date.timezone = Asia/Shanghai    #Date time zone
Copy Web directory
Copy the Web directory of Zabbix Server to the Nginx home directory.
cp -rp /usr/share/zabbix /usr/share/nginx/html/
Start Nginx and PHP FPM
systemctl start nginx php-fpm
systemctl enable nginx php-fpm
Install Zabbix Web side
Access in browser http://192.168.10.101/zabbix , you will enter the Zabbix installation guide page, as shown in the figure below.
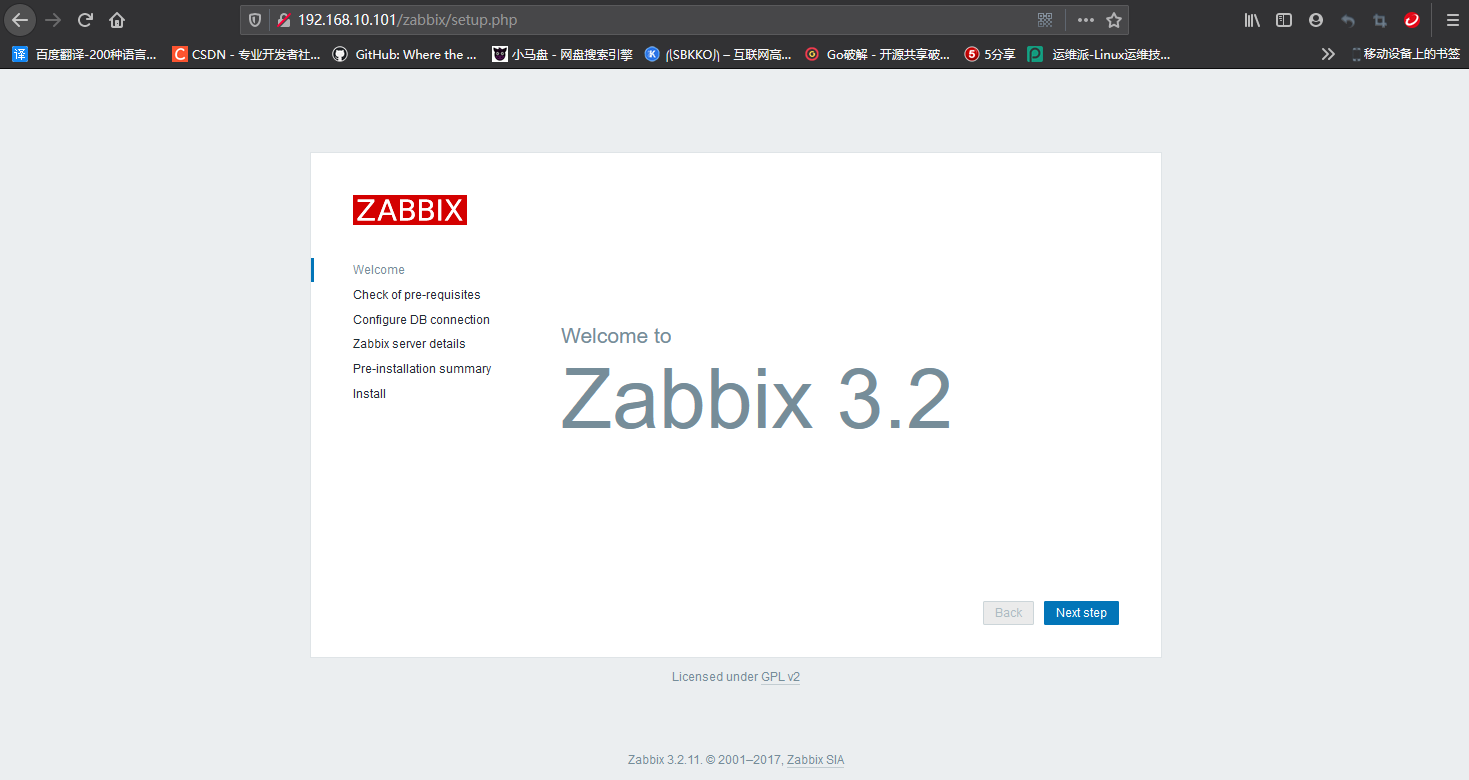
Detection configuration item
Click the "NextStep" button, and Zabbix will automatically detect the php configuration items that its operation depends on. The display "OK" indicates that the test has passed; The display of "Fail" indicates that the detection has failed. At this point, the user can continue to modify php. php according to the suggested value INI file, then restart the php FPM service, refresh the page, and continue the installation steps, as shown in the figure below.
We have already modified PHP INI file, so all tests here are OK
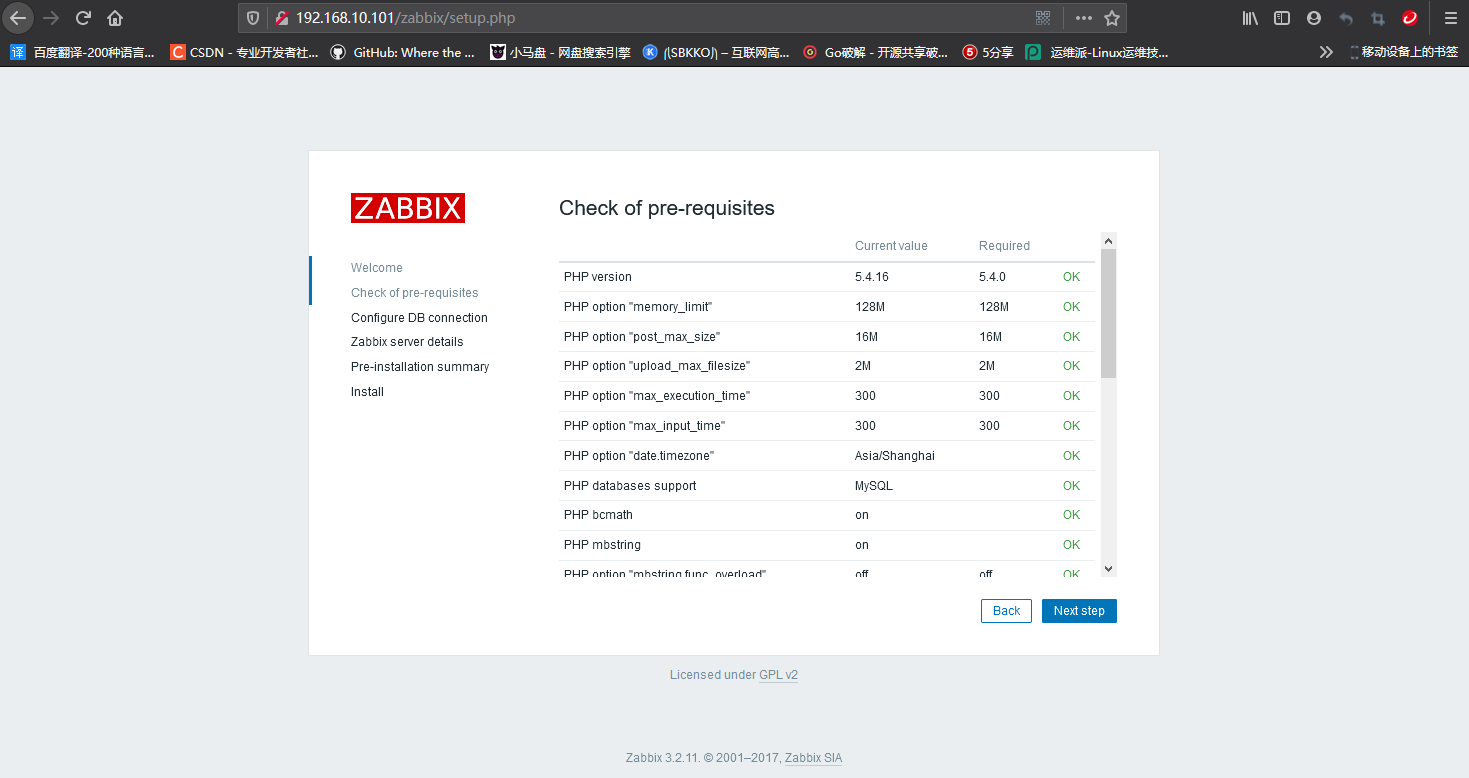
Fill in configuration
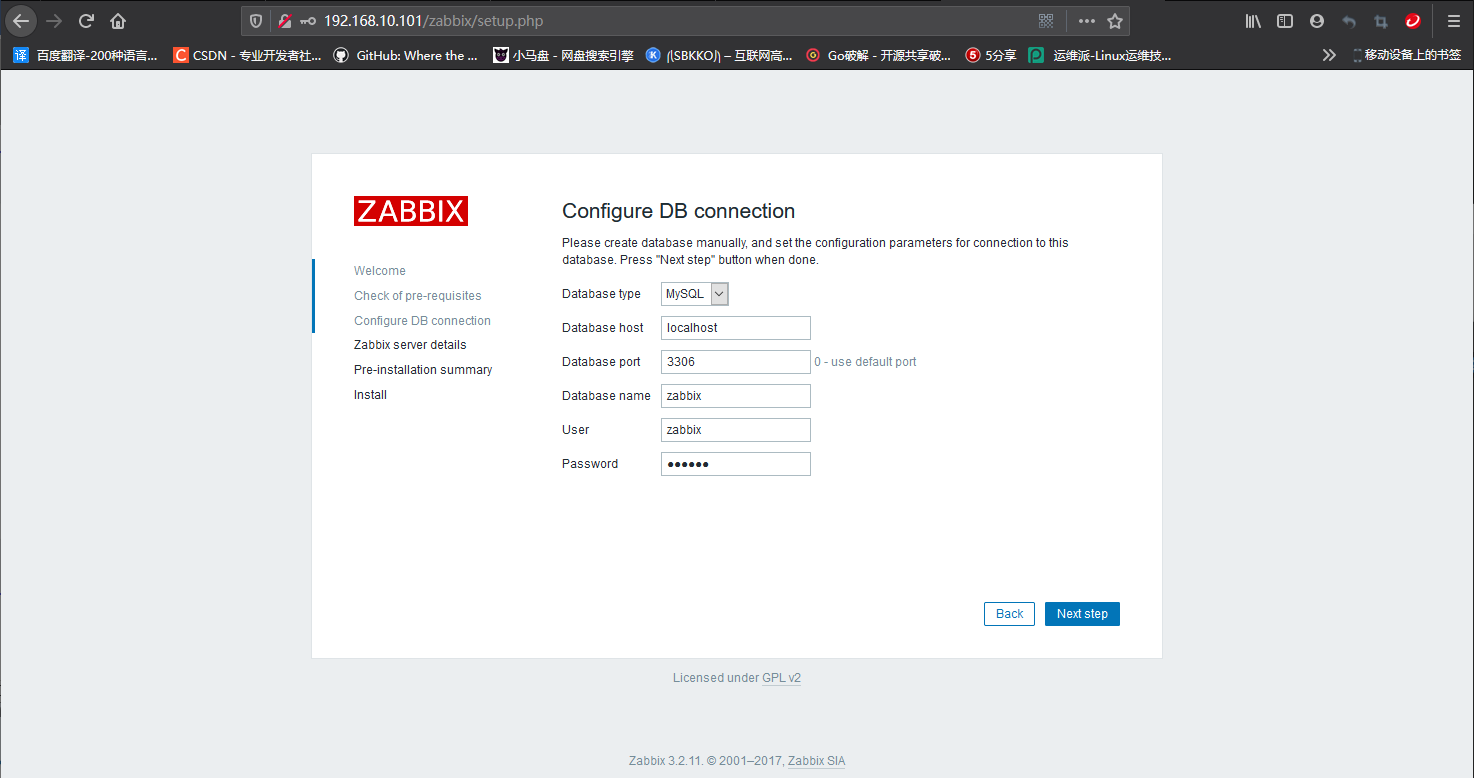
If all tests are passed, click "NextStep" to enter the database configuration page and fill in the correct configuration, as shown in the figure below.
The password here is zabbix, which is the account password created in the database earlier
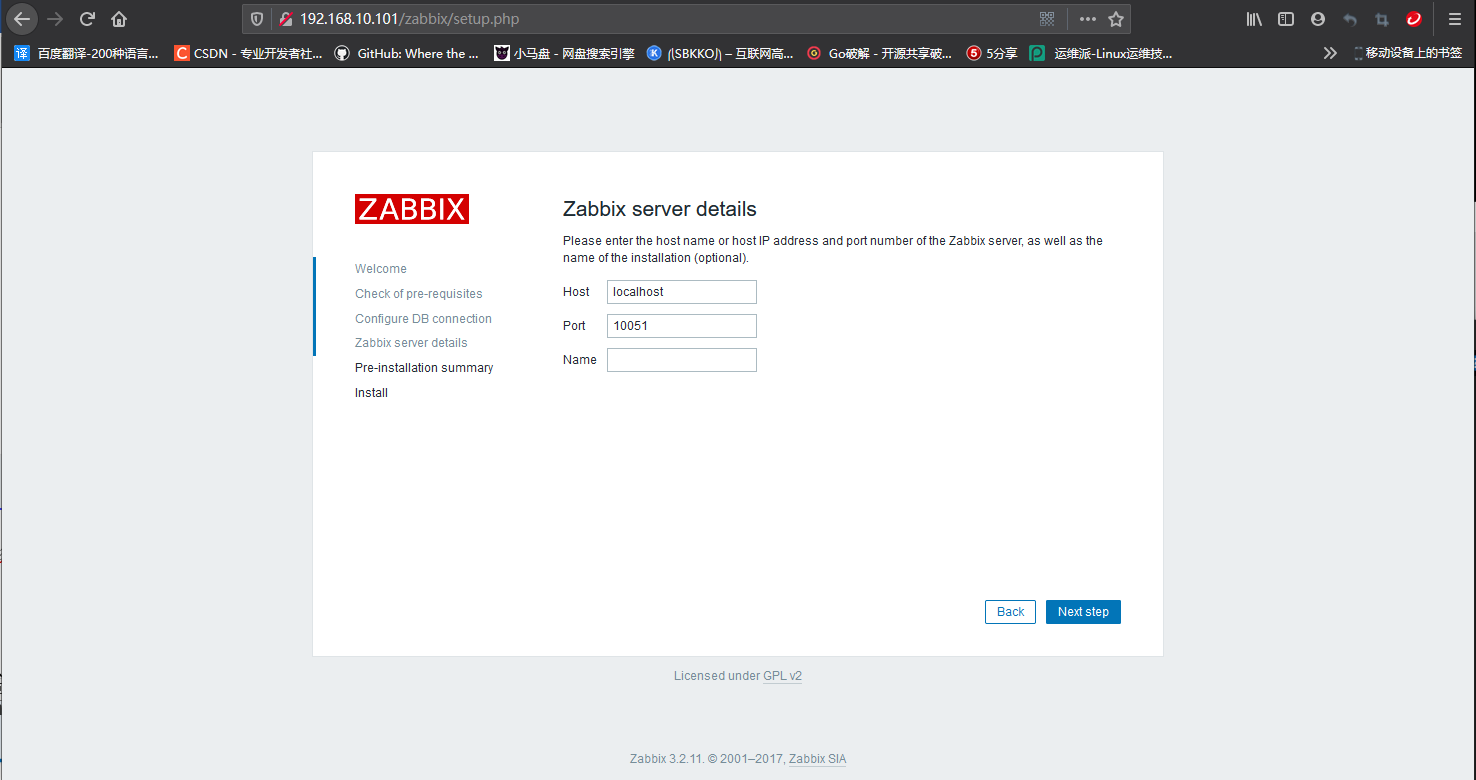
Set the host name, port and other information of Zabbix Server
Click the "NextStep" button to enter the detail setting page. Here you can set the host name and port of Zabbix Server and keep the default value, as shown in the figure below.
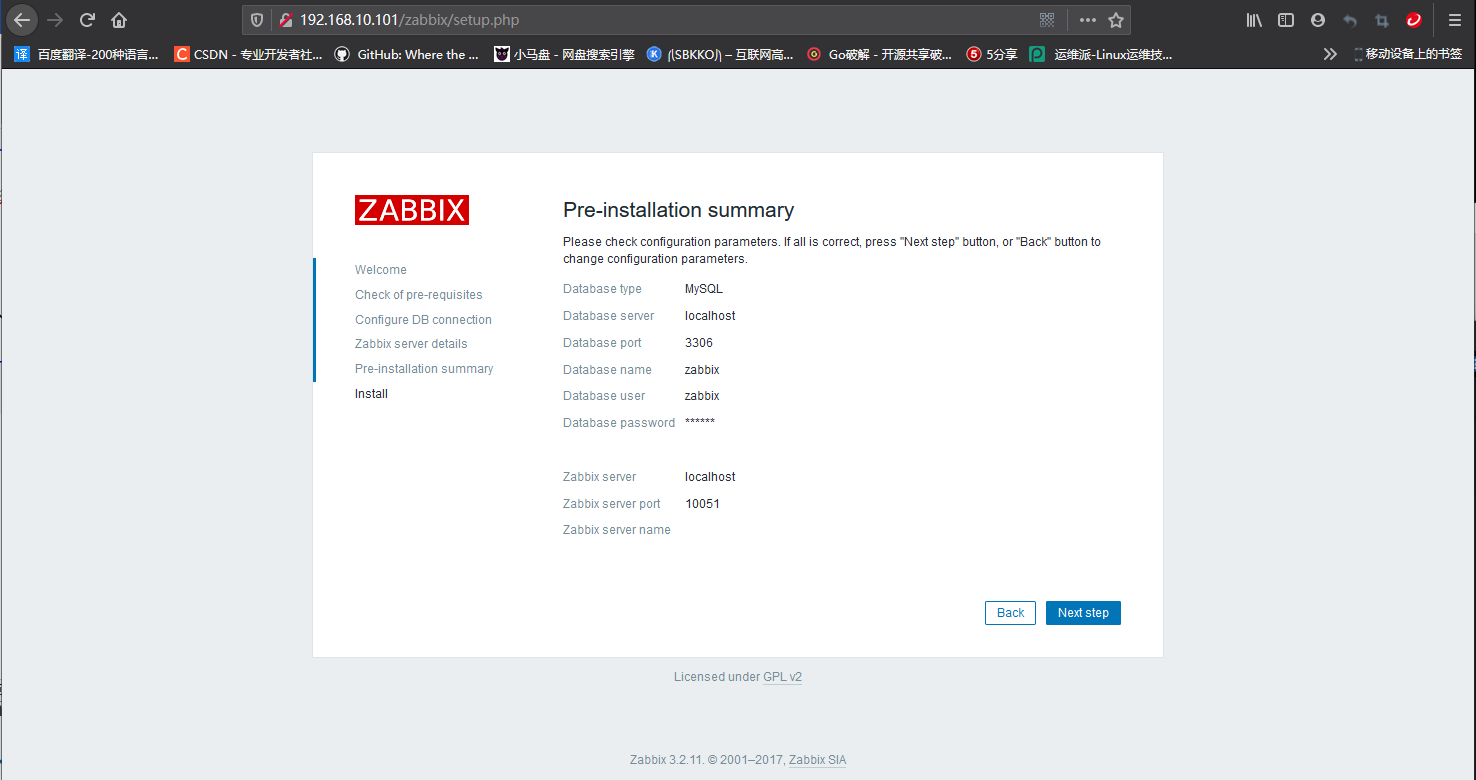
Information confirmation
Click the "NextStep" button to enter the information confirmation page, as shown in the figure below
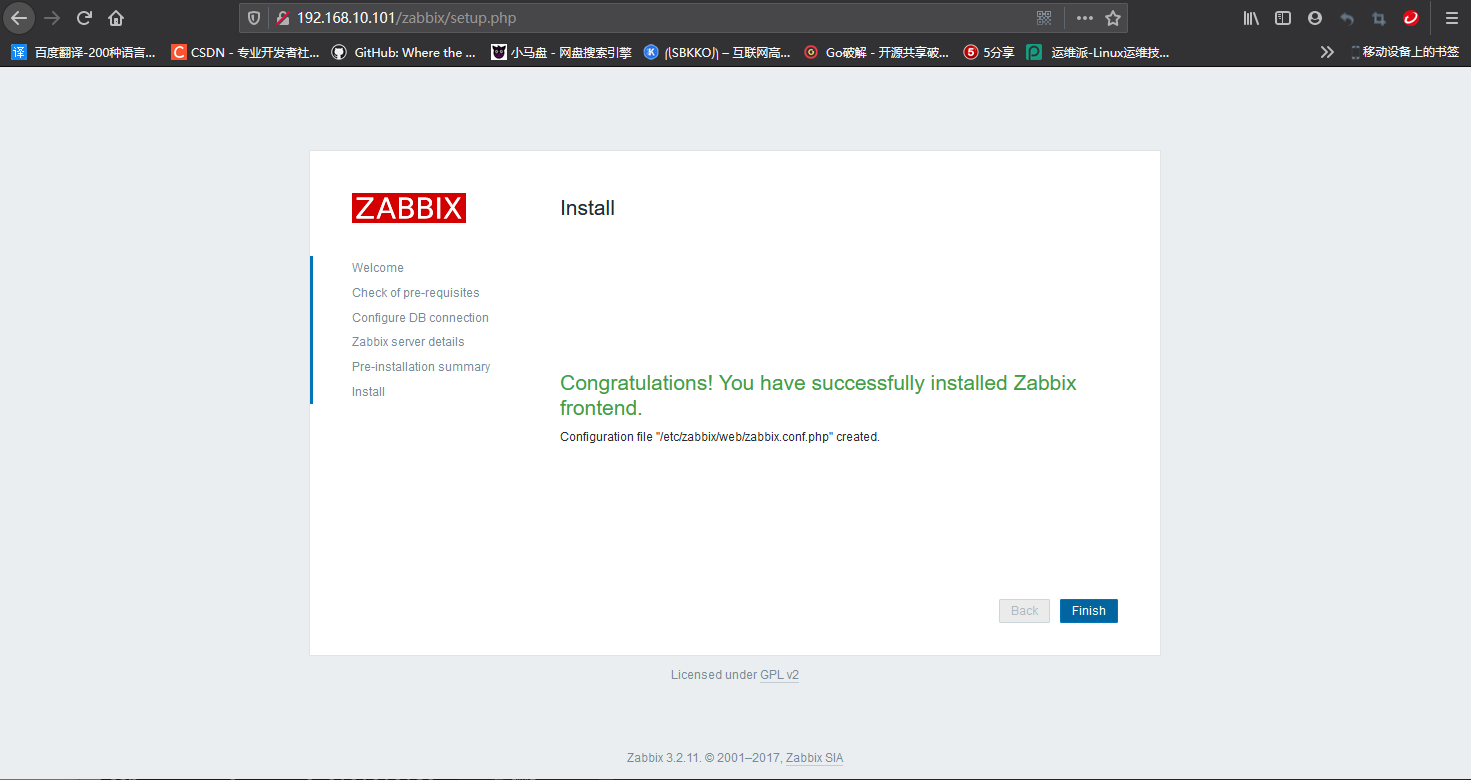
Complete installation
Click the "NextStep" button to enter the installation completion page, as shown in the figure below.
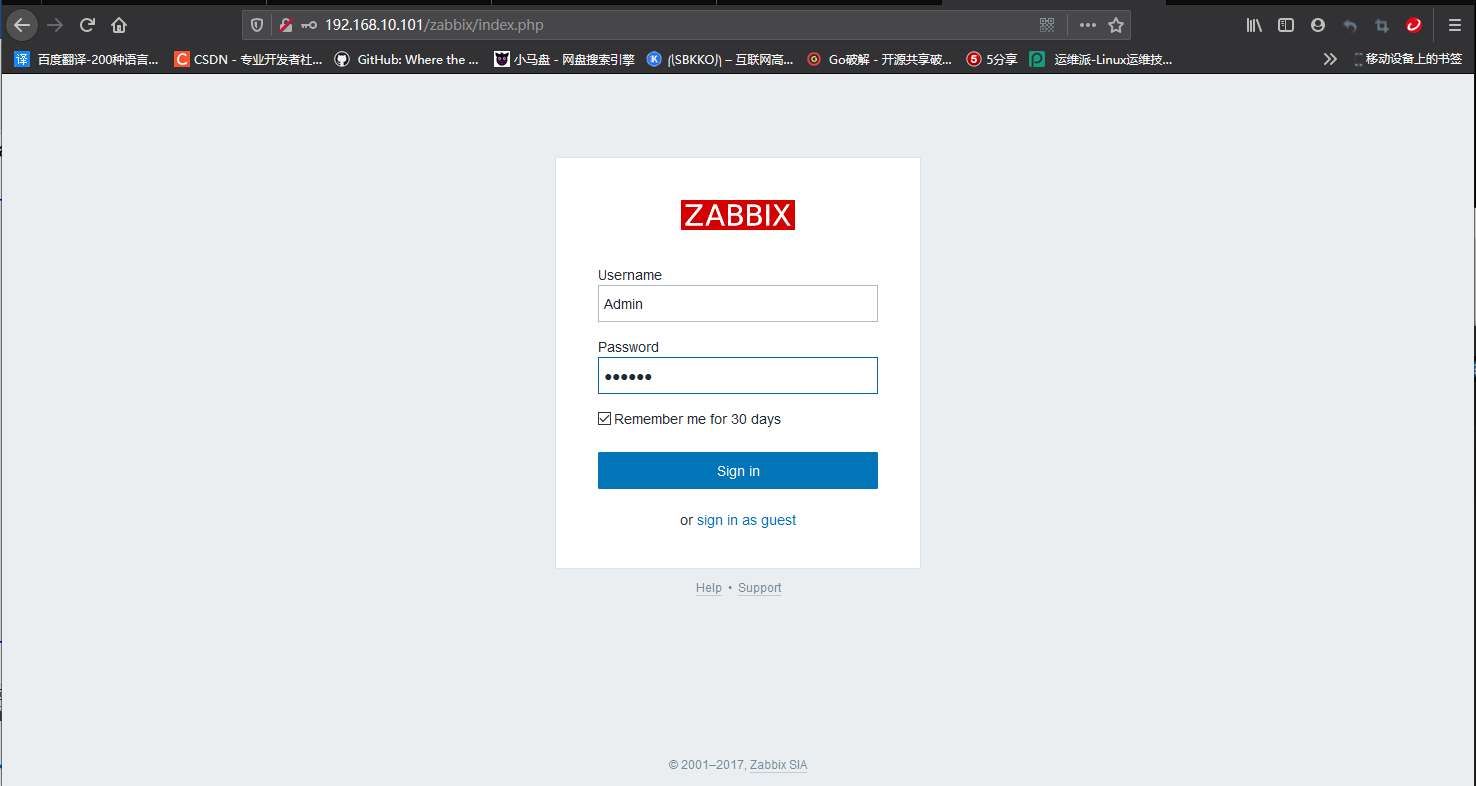
Enter the login page
Click "Finish" to enter the Zabbix Web login page, as shown in the figure below.
The default account here is Admin password zabbix
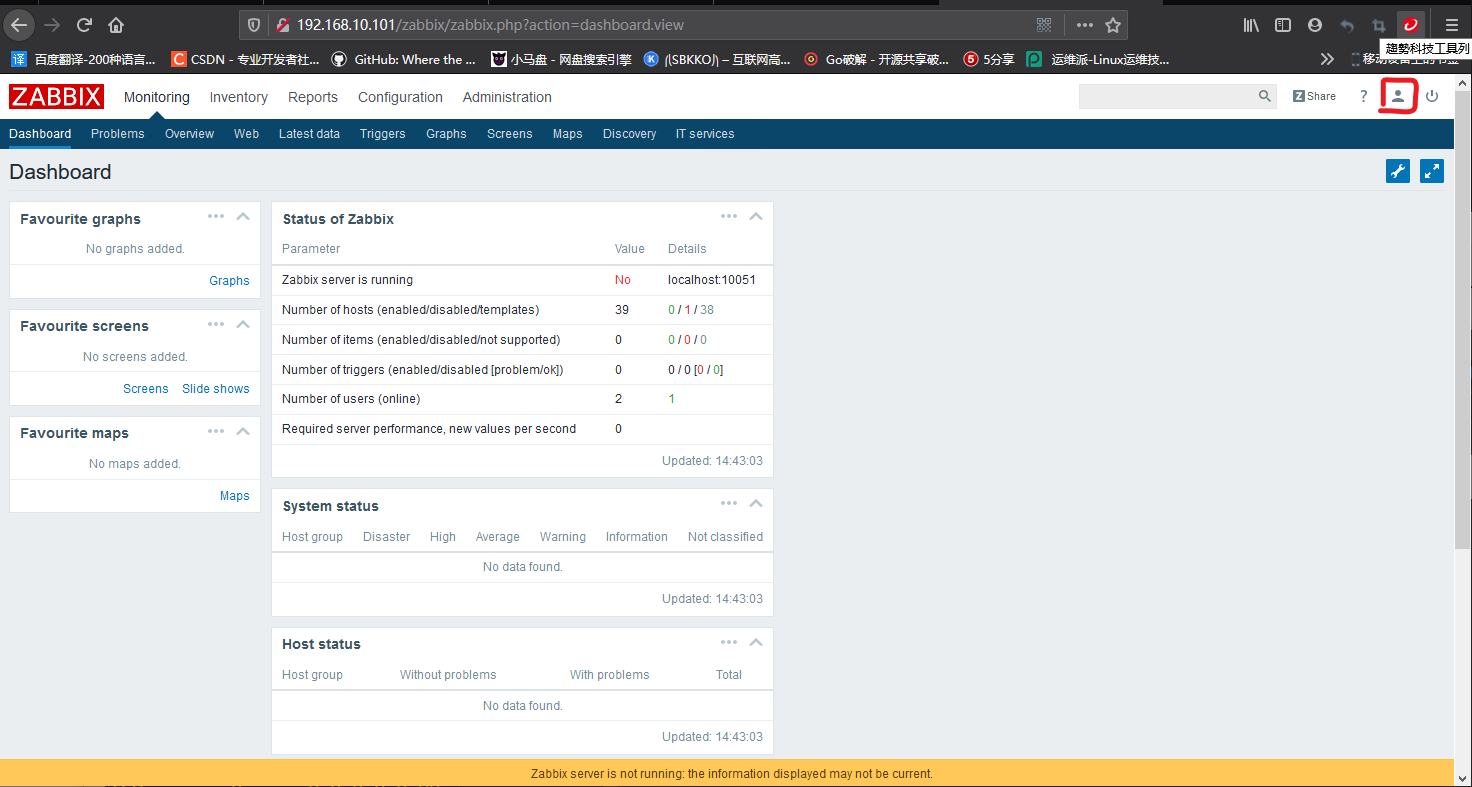
Enter the monitoring instrument page
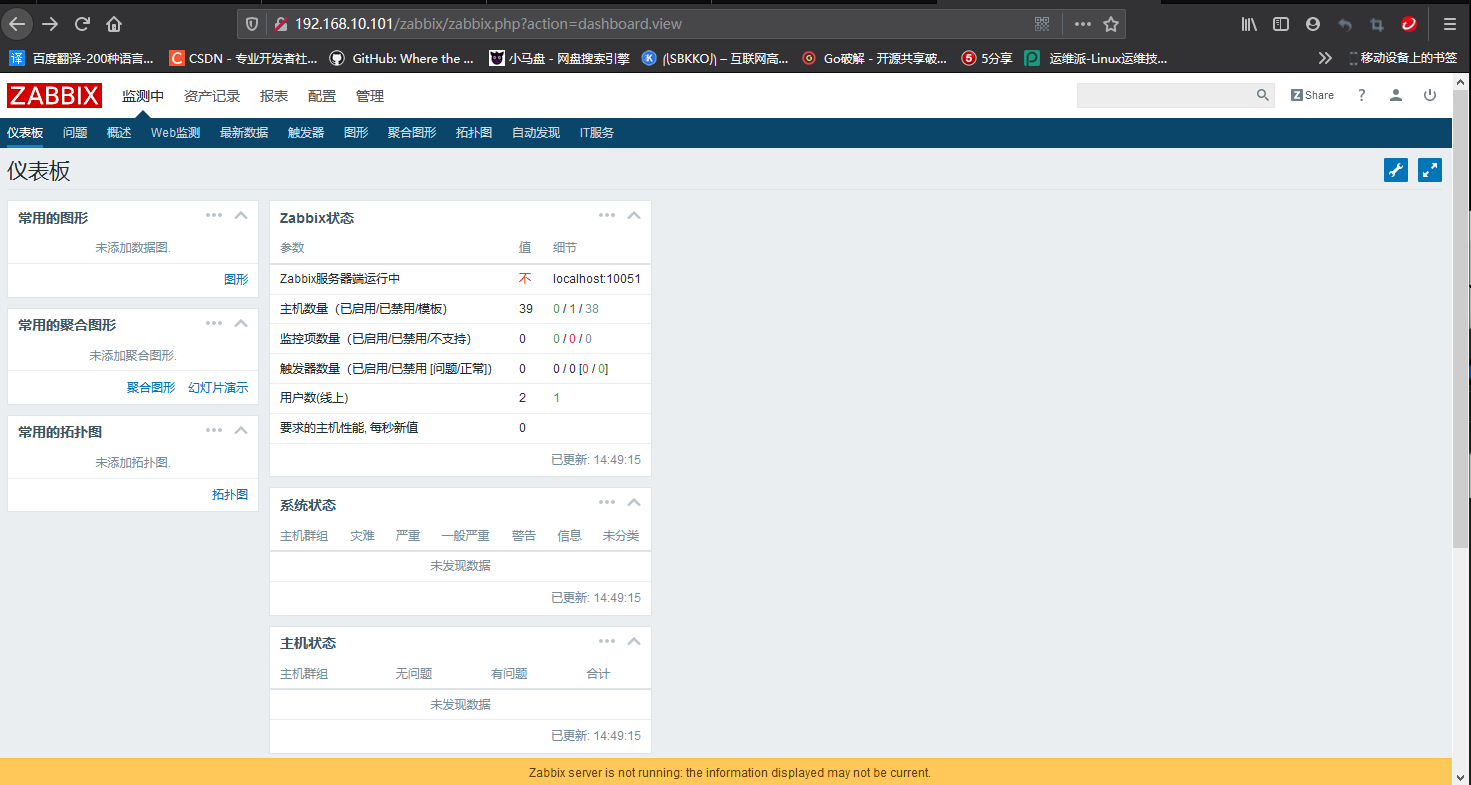
Click "Sign in" to enter the monitoring instrument page, as shown in the figure below.
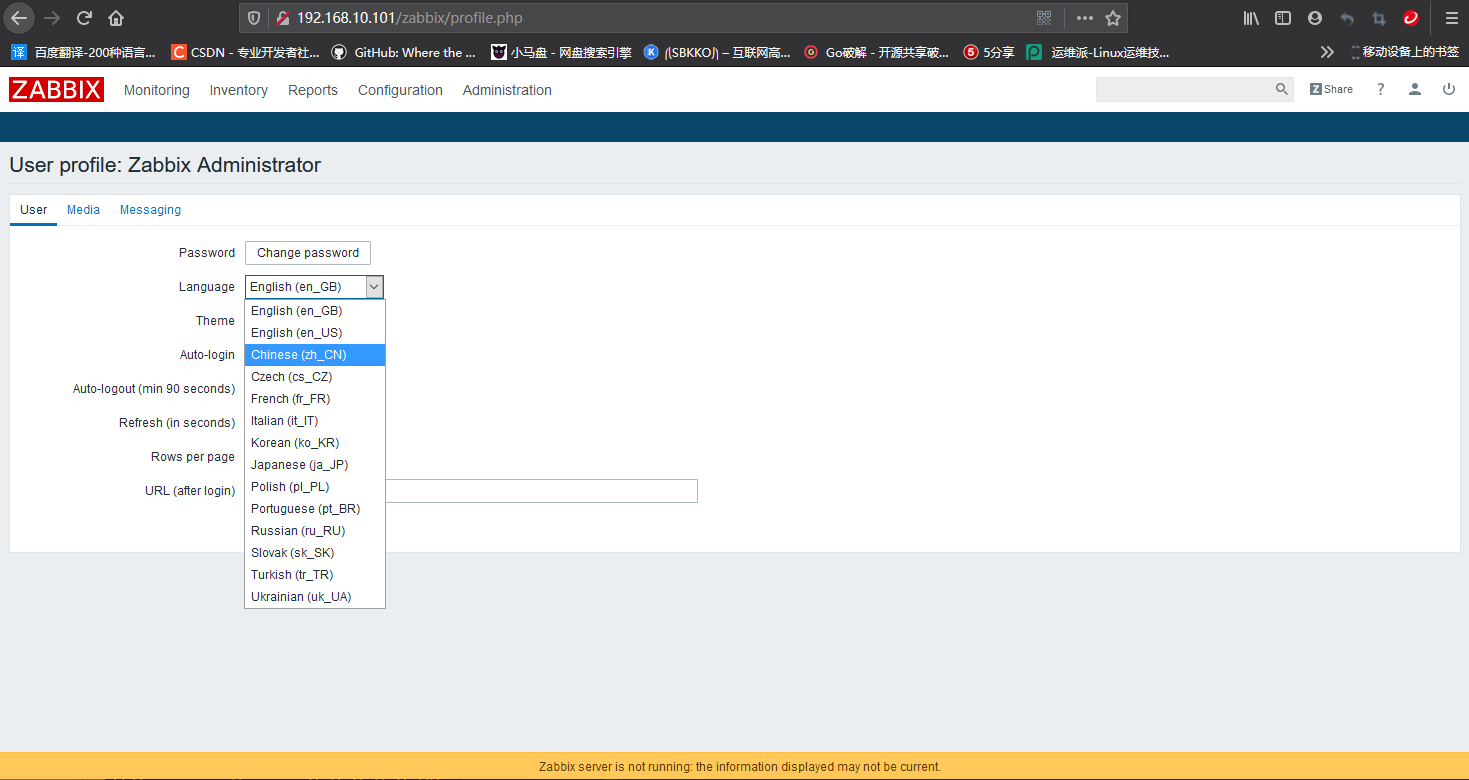
Click the place circled in the figure to switch the language to Chinese
Modify page language
Click the administrator icon in the upper right corner of the monitoring instrument page to enter the administrator setting page, as shown in the following figure. Of course, you can also change the login password and other things here. If you have time, you can study the following. There is no operation here
Deploy Zabbix Agent
agent1 node operation
Installing the Zabbix Agent
Execute the following command to install Zabbix Agent software.
Because the source of zabbix has been installed before, you can directly install yam here
yum install -y zabbix-agent
Edit Zabbix Agent configuration file
In the Zabbix Agent configuration file, modify the following configuration items:
vim /etc/zabbix/zabbix_agentd.conf
 Omit some contents..........

Server=192.168.10.101  #Specify the IP address of the server side

ServerActive=192.168.10.101   #Specify the active IP address of the server side

Hostname=Zabbix Agent1
#Agent1 local name. This name needs to be consistent with the host name of the host added on the Web page on the server side. The name is user-defined
Start Zabbix Agent
systemctl start zabbix-agent.service
systemctl enable zabbix-agent.service
In the previous deployment, the server side directly monitors the agent side, and there is no proxy agent in the middle
The following deployment is to use zabbix proxy agent to monitor the agent side
Deploy Zabbix Proxy
proxy node operation
mount this database
Here, the data of zabbix server and zabbix proxy are stored in different hosts, so you also need to install the database here.
Execute the following command to install MySQL database. If you want abbix_ The proxy library is created into the database of the host with zabbix library. You only need to execute the following commands in the database once.
yum install -y mariadb-server
systemctl start mariadb
systemctl enable mariadb

mysql	#Initial password is empty

MariaDB [(none)]> CREATE DATABASE zabbix_proxy character set utf8 collate utf8_bin;
#Create zabbix_proxy library and set the character set to utf8

MariaDB [(none)]> USE mysql;  #Switch to mysql Library

MariaDB [mysql]> UPDATE mysql.user SET password = PASSWORD('zabbix') WHERE user = 'root';
#Set the root account password to 'zabbix'

MariaDB [mysql]> GRANT ALL PRIVILEGES ON zabbix_proxy.* TO 'zabbix'@'localhost' IDENTIFIED BY 'zabbix';
#Authorize zabbix account to access zabbix locally with password 'zabbix'_ Proxy database

MariaDB [mysql]> GRANT ALL PRIVILEGES ON zabbix_proxy.* TO 'zabbix'@'%' IDENTIFIED BY 'zabbix';
#Authorize zabbix account to access zabbix remotely with password 'zabbix'_ Proxy database

MariaDB [mysql]> FLUSH PRIVILEGES;   #Update data

MariaDB [mysql]> quit;   #sign out
Install the Zabbix Proxy based on MySQL
Because all hosts have been configured with zabbix source before, the direct installation is omitted here
vim /etc/yum.repos.d/zabbix.repo

[zabbix]
name=Zabbix Official Repository - $basearch
baseurl=http://repo.zabbix.com/zabbix/3.2/rhel/7/$basearch/
enabled=1
gpgcheck=0   #No key verification
gpgkey=file:///etc/pki/rpm-gpg/RPM-GPG-KEY-ZABBIX-A14FE591

[zabbix-non-supported]
name=Zabbix Official Repository non-supported - $basearch
baseurl=http://repo.zabbix.com/non-supported/rhel/7/$basearch/
enabled=1
gpgkey=file:///etc/pki/rpm-gpg/RPM-GPG-KEY-ZABBIX
gpgcheck=0   #No key verification
yum install -y zabbix-proxy-mysql
The Zabbix database initialization command is as follows
zcat /usr/share/doc/zabbix-proxy-mysql-3.2.*/schema.sql.gz | mysql -h192.168.10.101 -uzabbix -p zabbix_proxy
#If zabbix library and zabbix_ The proxy library uses the above command to initialize the database in the database of the same host, and the specified IP address is the IP address of the database side

zcat /usr/share/doc/zabbix-server-mysql-3.2.*/create.sql.gz | mysql -uzabbix  -p zabbix_proxy
#zabbix_ The proxy library uses this command to log in locally in the proxy node
If you want to connect to the database remotely, you can use the following command
mysql -h ip address -u user -p password
 Examples
mysql -h 192.168.10.102 -u zabbix -p
Enter password:     #The password of the user who initialized the database
Edit Zabbix Proxy profile
vim /etc/zabbix/zabbix_proxy.conf

Server=192.168.10.101   #IP address of server side

Hostname=Zabbix Proxy
#The local name of the Proxy. This name needs to be consistent with the name of the Proxy on the Web page on the server side in the future. The name is user-defined

DBHost=192.168.10.102
#zabbix_ IP address of proxy database, ZABBIX_ The proxy database is local, so it uses the local IP

DBName=zabbix_proxy  #The name of the generated database

DBUser=zabbix    #Users of the database

DBPassword=      #The database password is the password when initializing the database, that is, the password of the zabbix user of the local database

DBPort=3306   #Port of the database
Start ZABBIX proxy
systemctl start zabbix-proxy
systemctl enable zabbix-proxy
Deploy Zabbix Agent
agent2 node operation
Execute the following command to install Zabbix Agent software.
Because the source of zabbix has been installed before, you can directly install yam here
yum install -y zabbix-agent
Modify the Zabbix Agent configuration file as follows
vim /etc/zabbix/zabbix_agentd.conf

Server=192.168.10.102   #Point to the Proxy address, that is, the IP address of the Proxy

ServerActive=192.168.10.102    #Point to the Proxy address, that is, the IP address of the Proxy

Hostname=Zabbix Agent2 on Proxy
#The local name of Zabbix Agent on Proxy needs to be consistent with the host name on the Web page on the Server side in the future. The name is user-defined
Start Zabbix Agent
systemctl start zabbix-agent.service
systemctl enable zabbix-agent.service
Zabbix Web front end configuration
server node operation
Zabbix Web front-end configuration is the specific monitoring configuration in the Web management interface of Zabbix Server. It is divided into several steps: adding hosts, adding host groups, configuring proxies, and defining monitoring items. First, configure "add host".
Add host
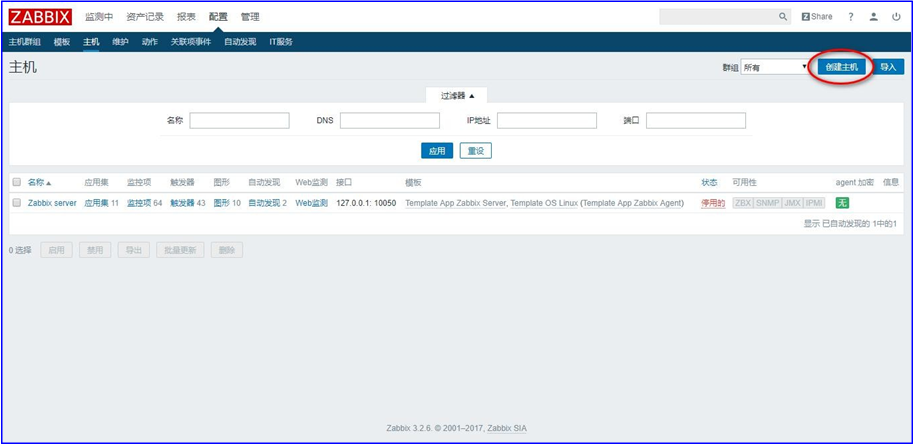
On the Web interface, select configuration - Host - create host, as shown in the following figure.
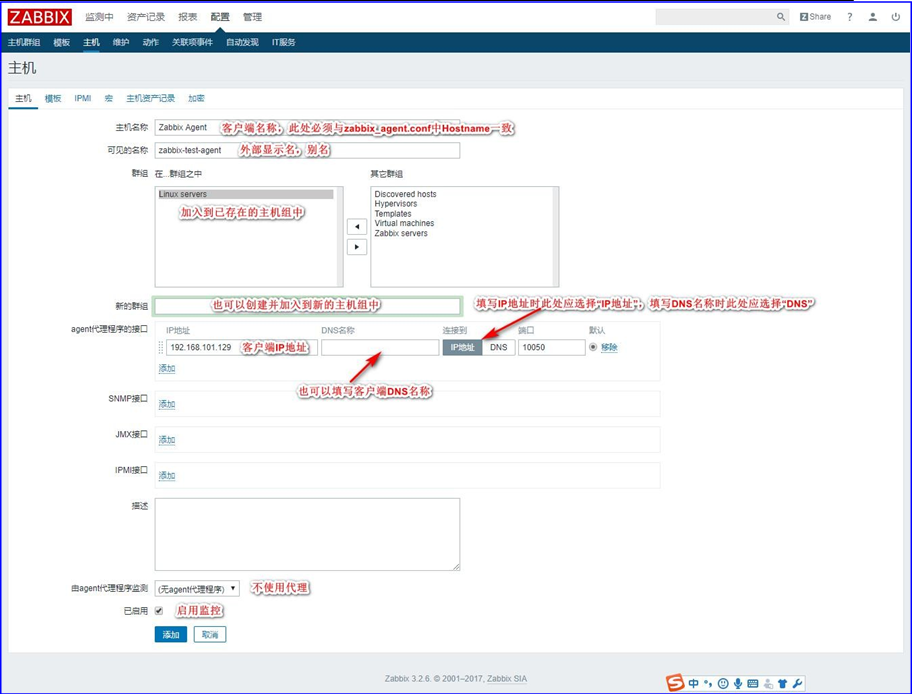
Fill in the client related information according to the instructions in the figure below.
 After filling in the client information, select the "template" tab to select the monitoring template for the client host, as shown in the following figure.
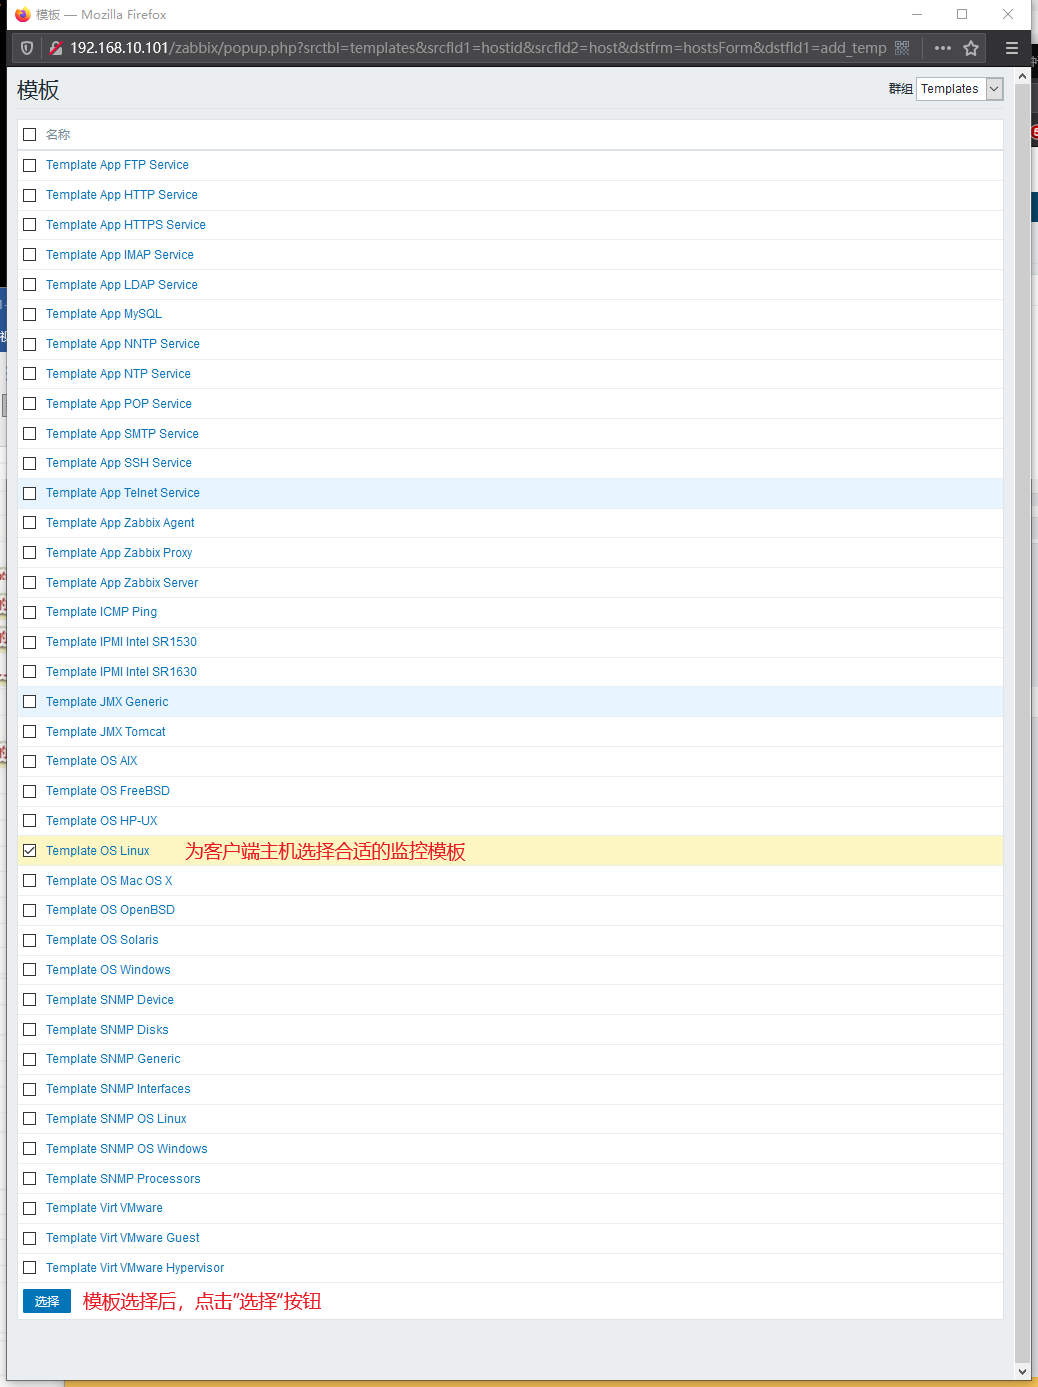
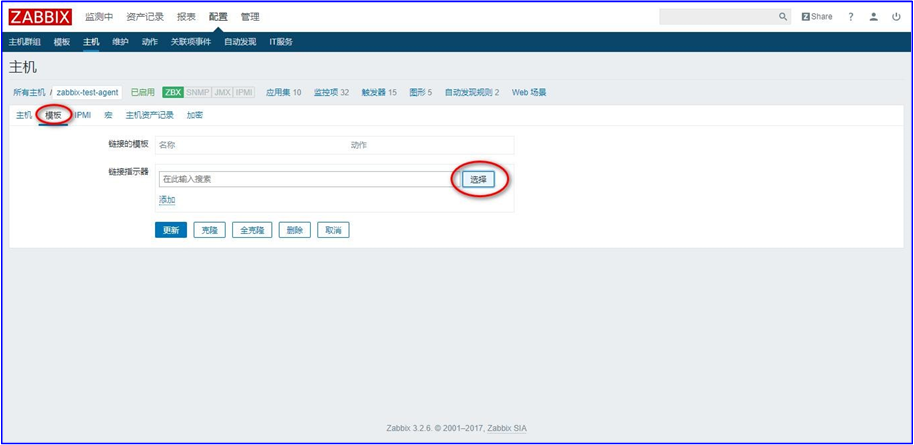 Check the template suitable for the client host and click the "select" button, as shown in the figure below.
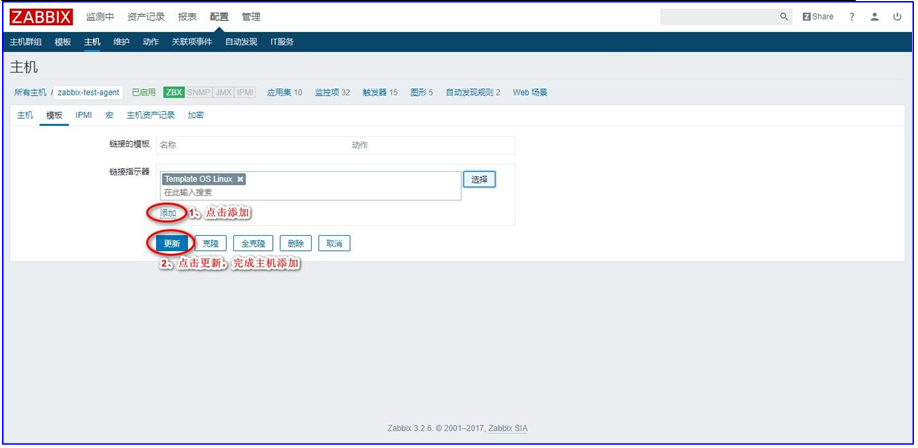
Click the "add" button and "update" button in turn to complete the addition of the client host, as shown in the figure below
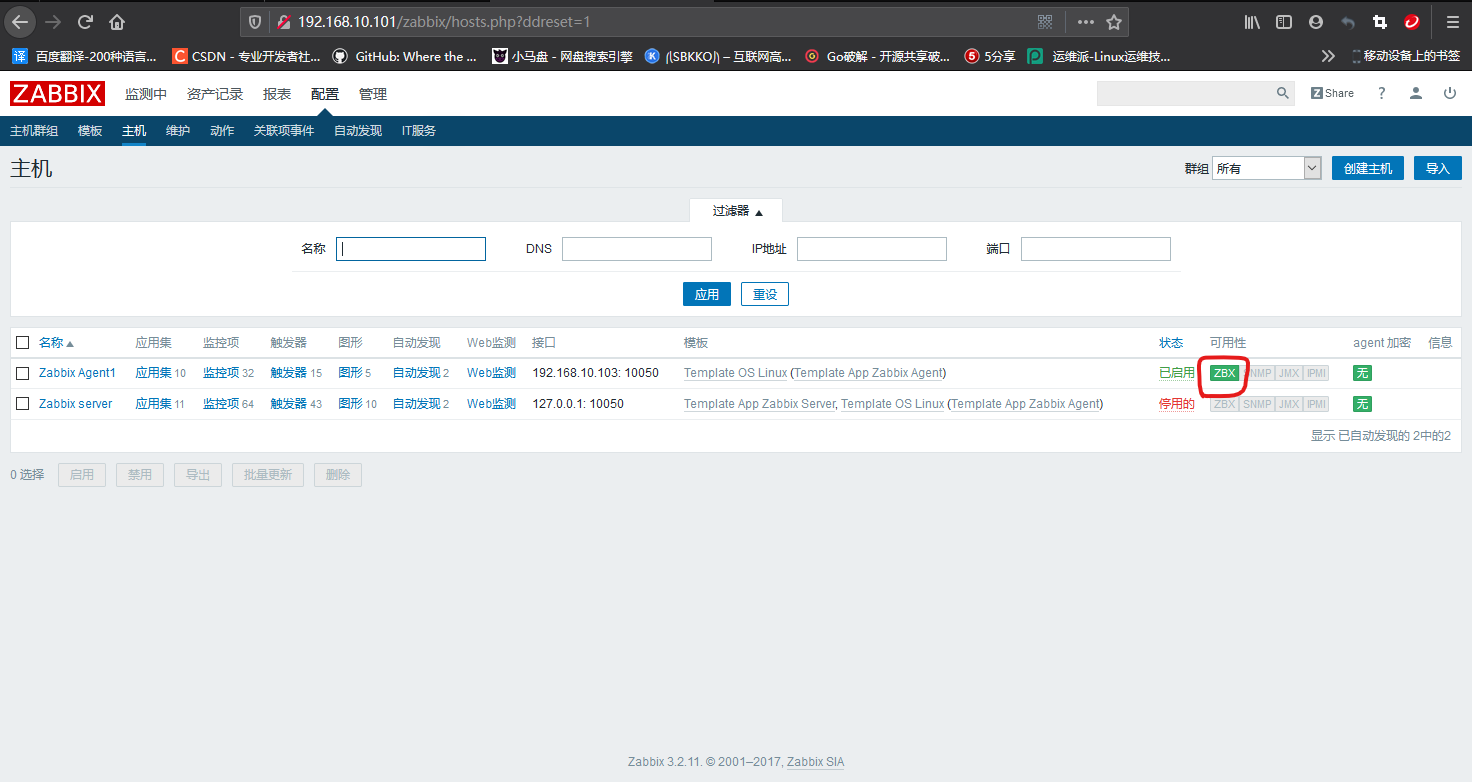
After adding, return to the host list. The green "ZBX" on the right indicates that the addition is successful. If it is a red "ZBX", it means that the addition fails. At this time, move the mouse to the red "ZBX" and there will be specific prompt information, as shown in the following figure.
Add host group
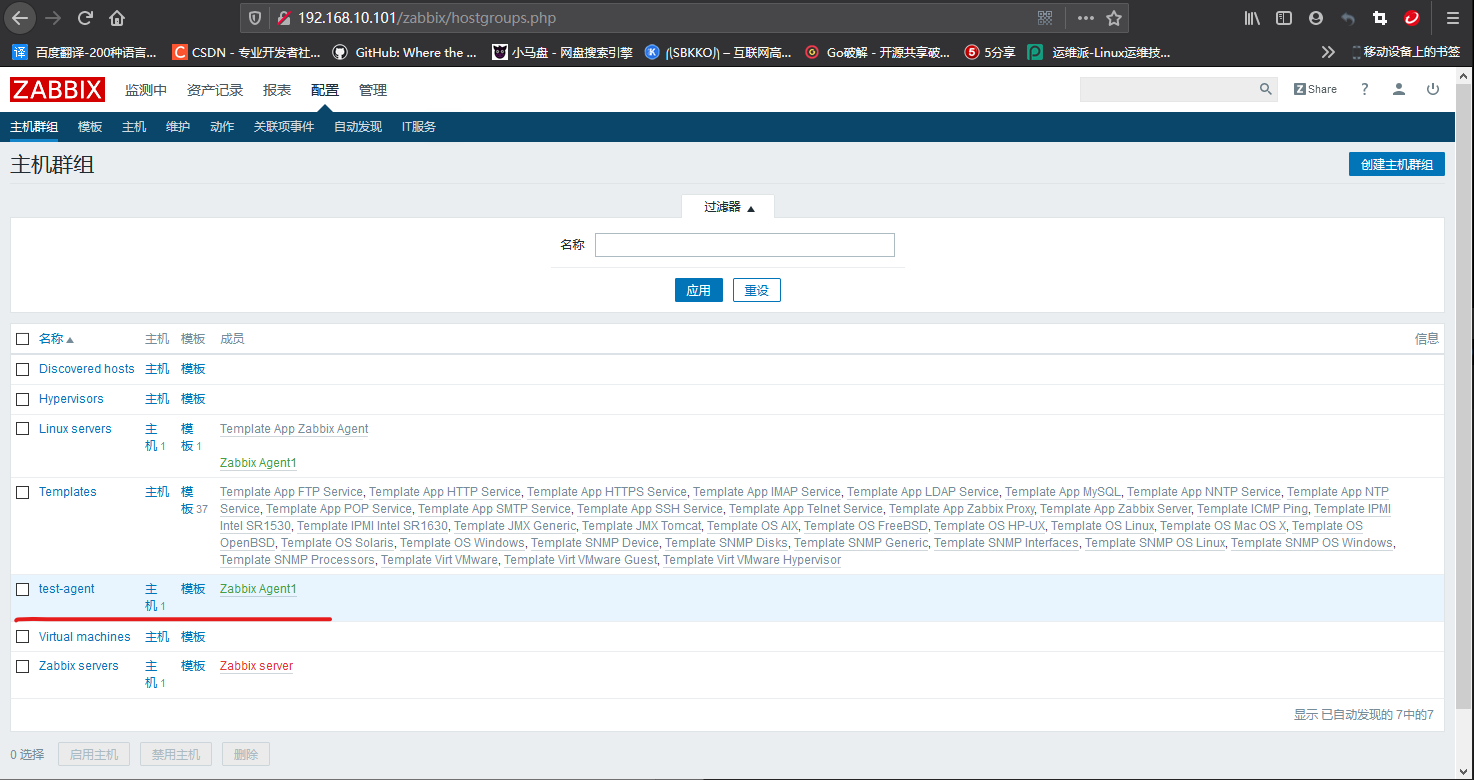
On the Web page, select configuration - host group - create host group, as shown in the following figure.
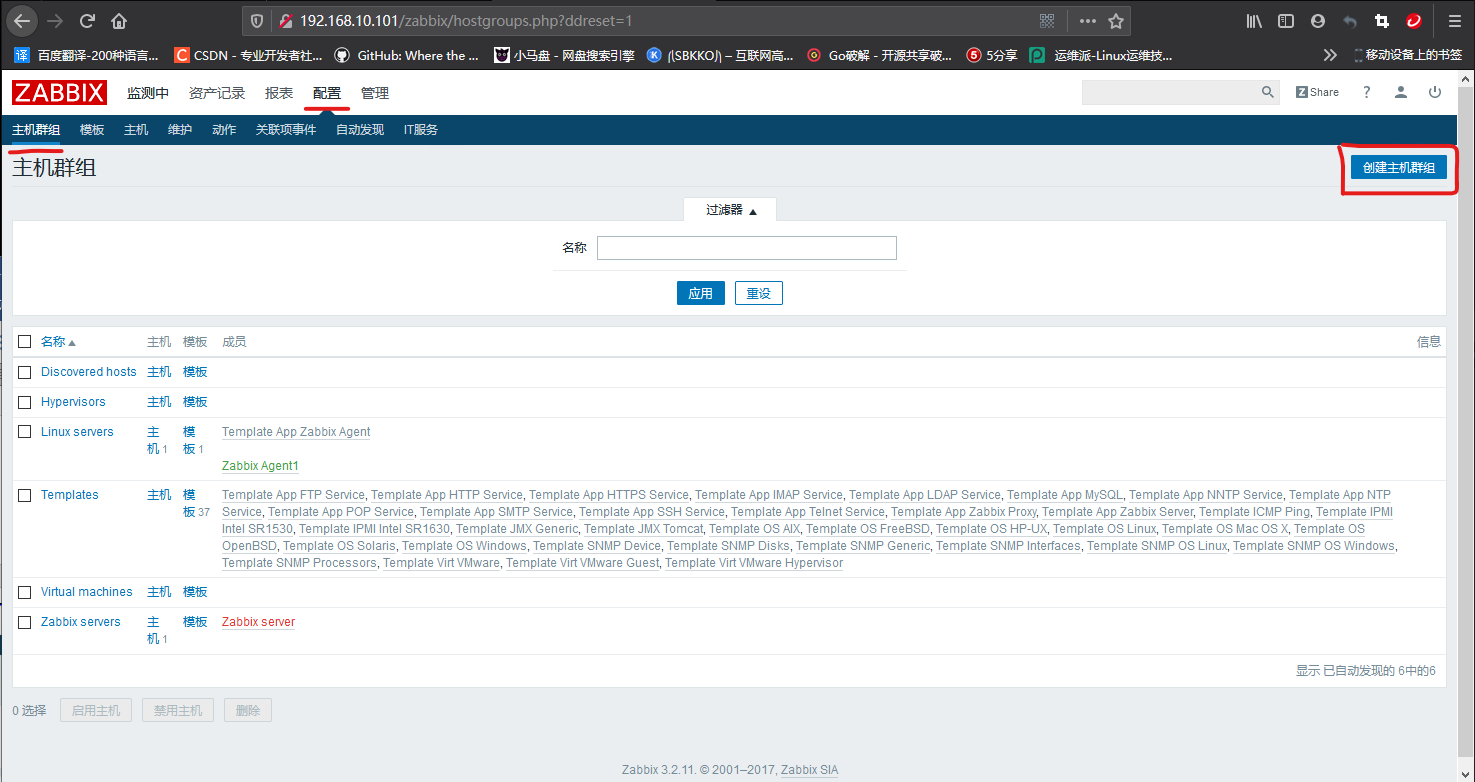
Fill in the group name and select the group members, as shown in the figure
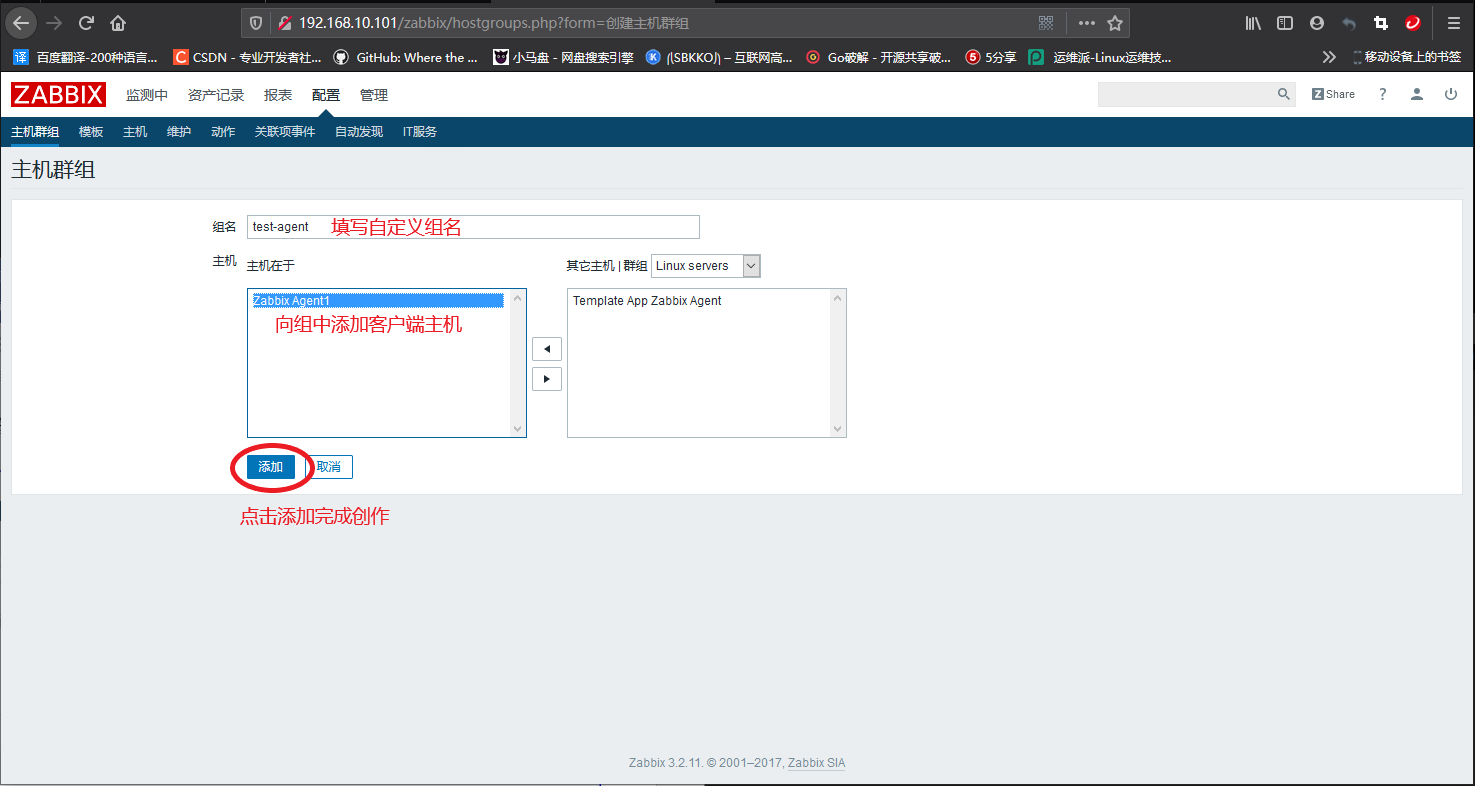
Configure Proxy
Add Proxy
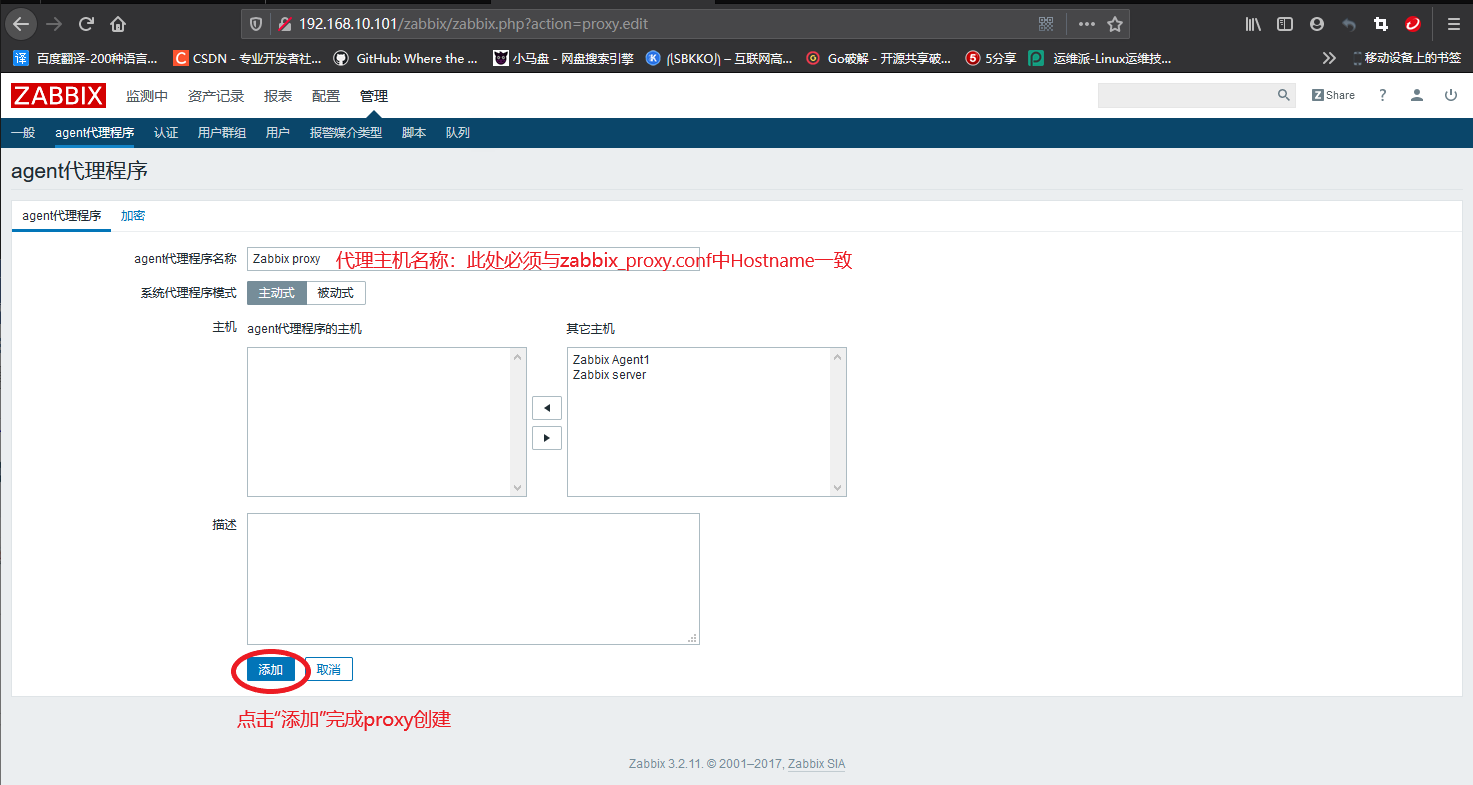
On the Web interface, select: manage - agent - create agent, as shown in the following figure.
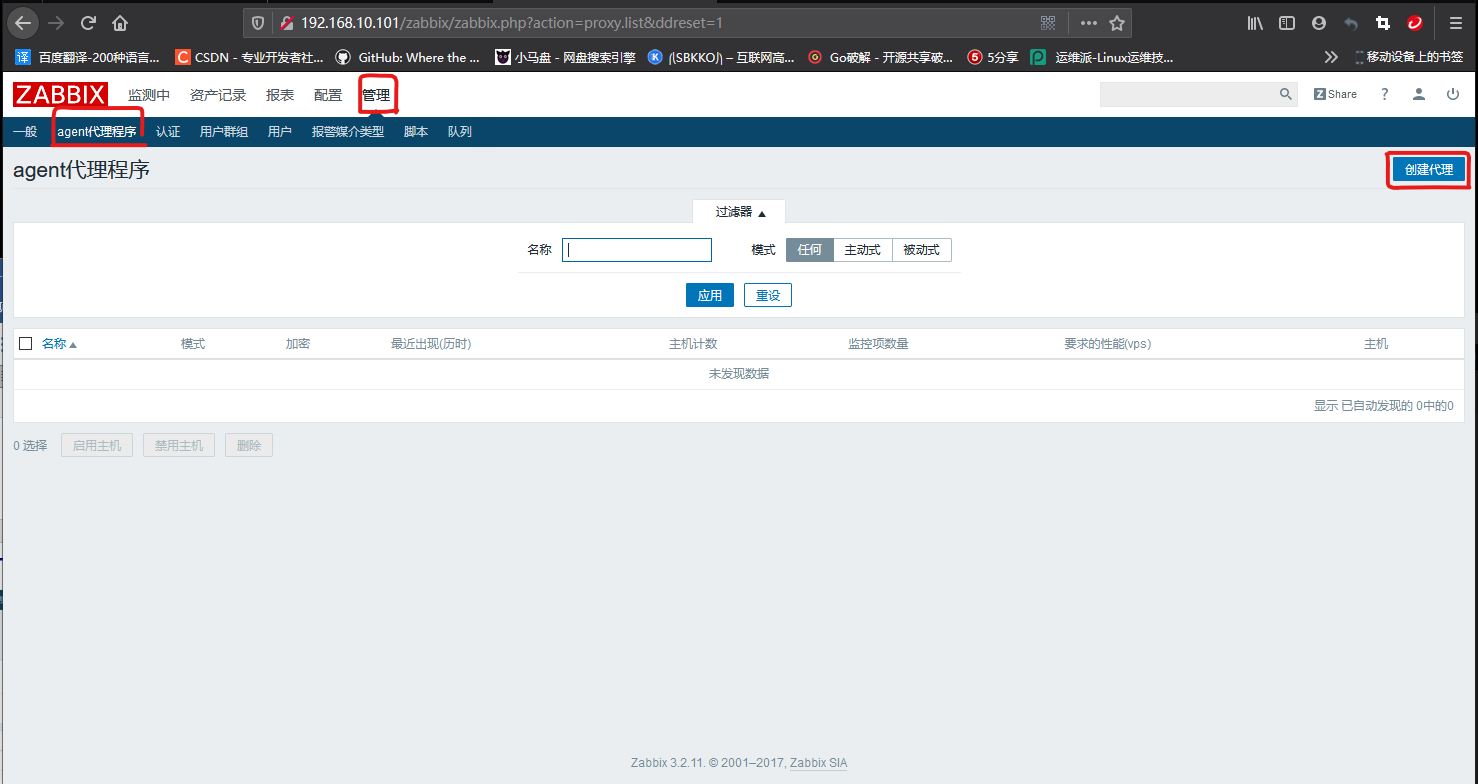
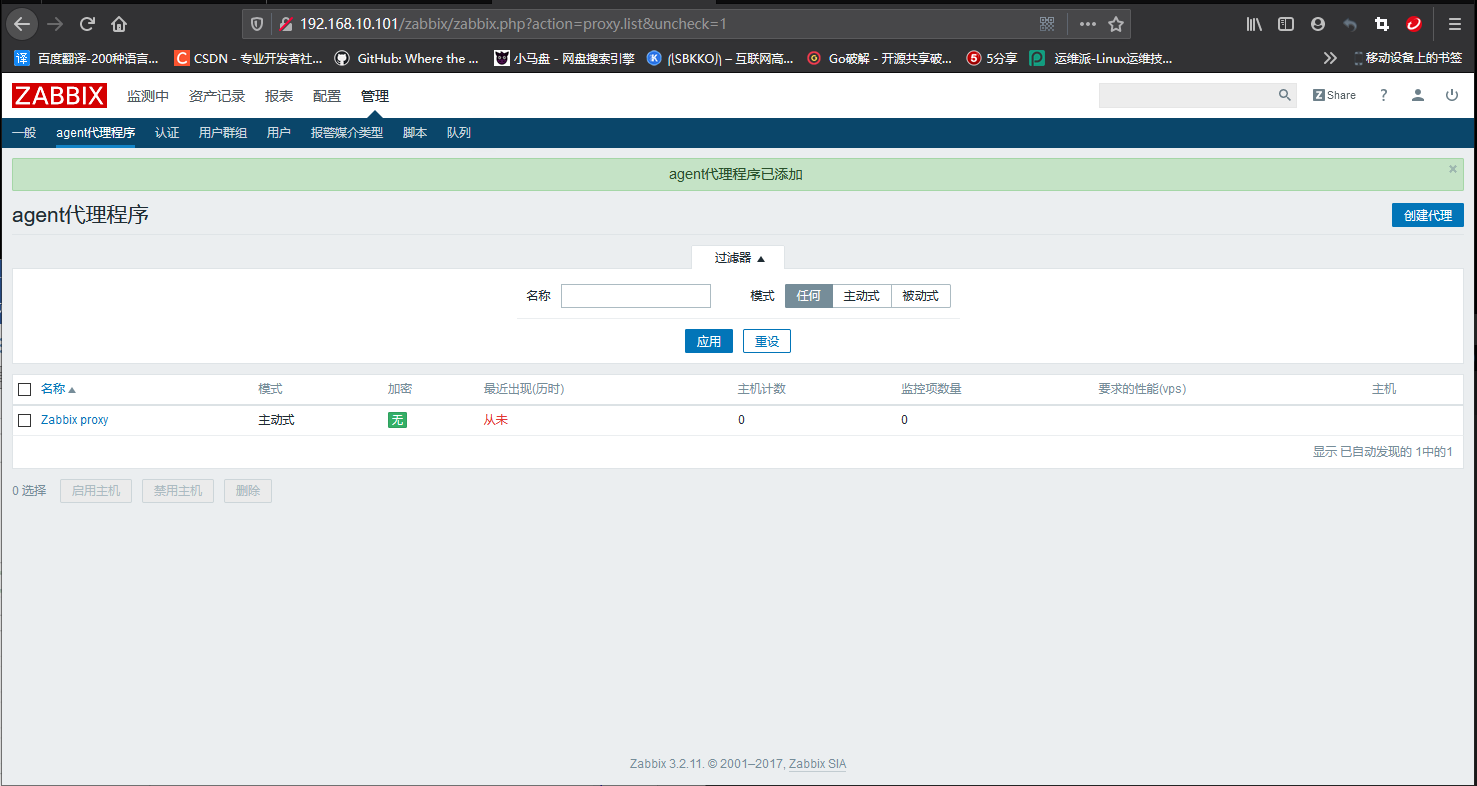
Fill in the Proxy host name and click the "add" button to complete the Proxy creation, as shown in the figure below.
Add Agent host
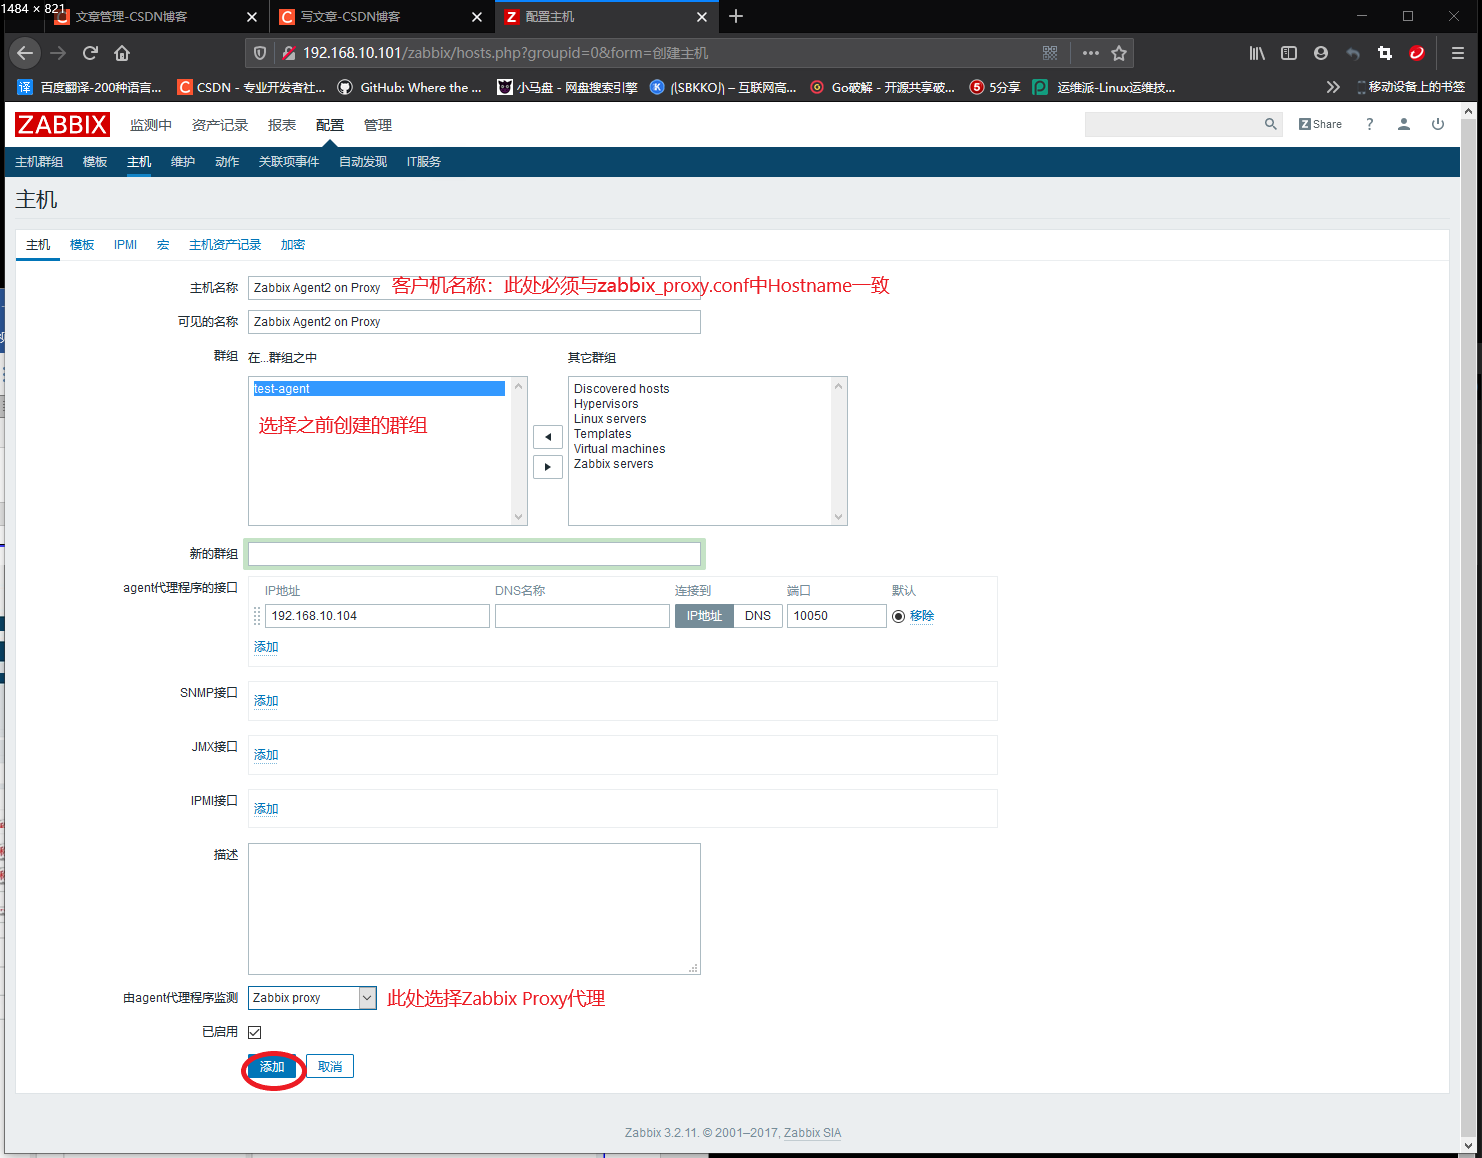
The addition steps are the same as 192.168.10.103. Select configuration - Host - create host on the Web interface, and select use agent agent to monitor as Zabbix Proxy on the host page, as shown in the figure.
Custom triggers, monitoring items
Create monitor item
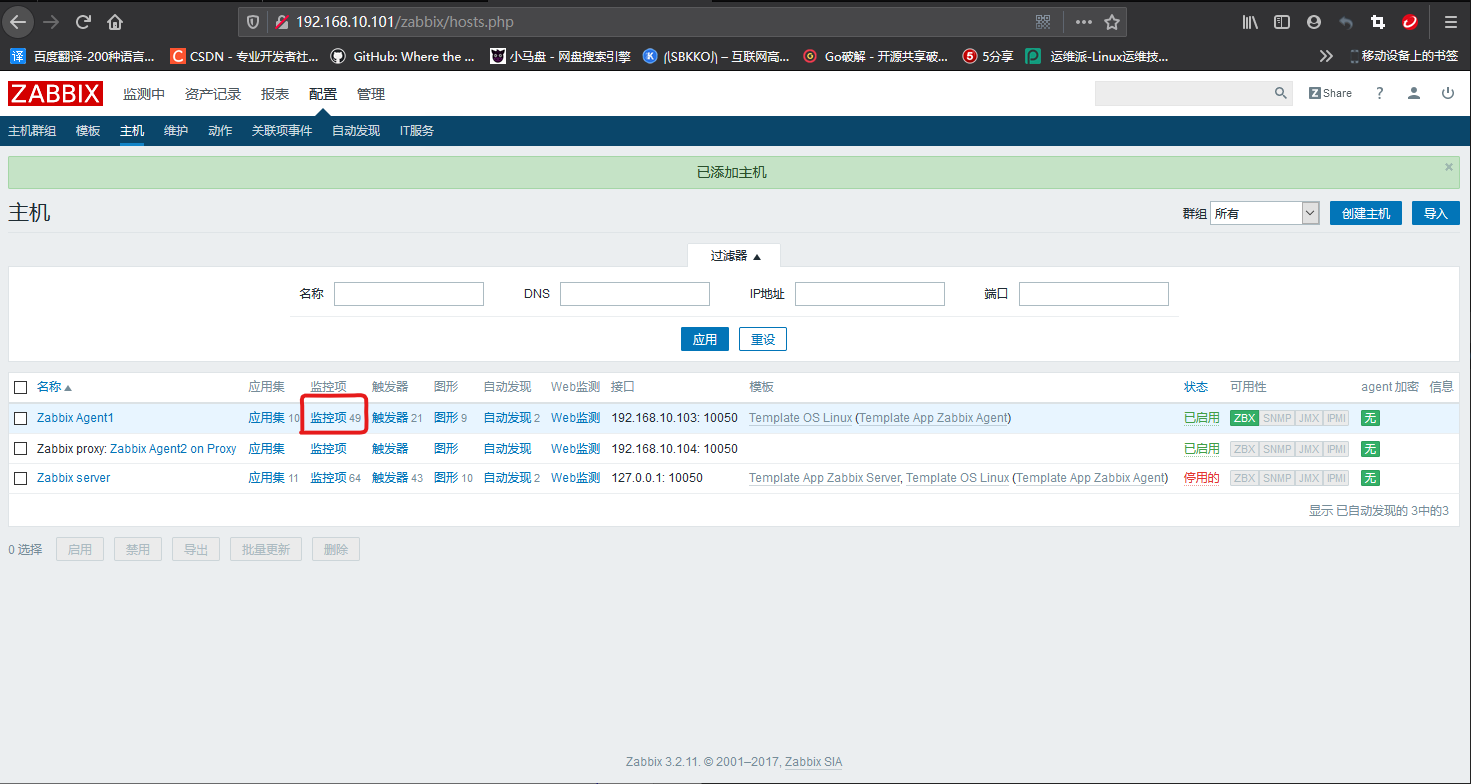
Click "configuration" - "host" in turn, and click "monitoring item" on the column of host to be configured, as shown in the figure below.
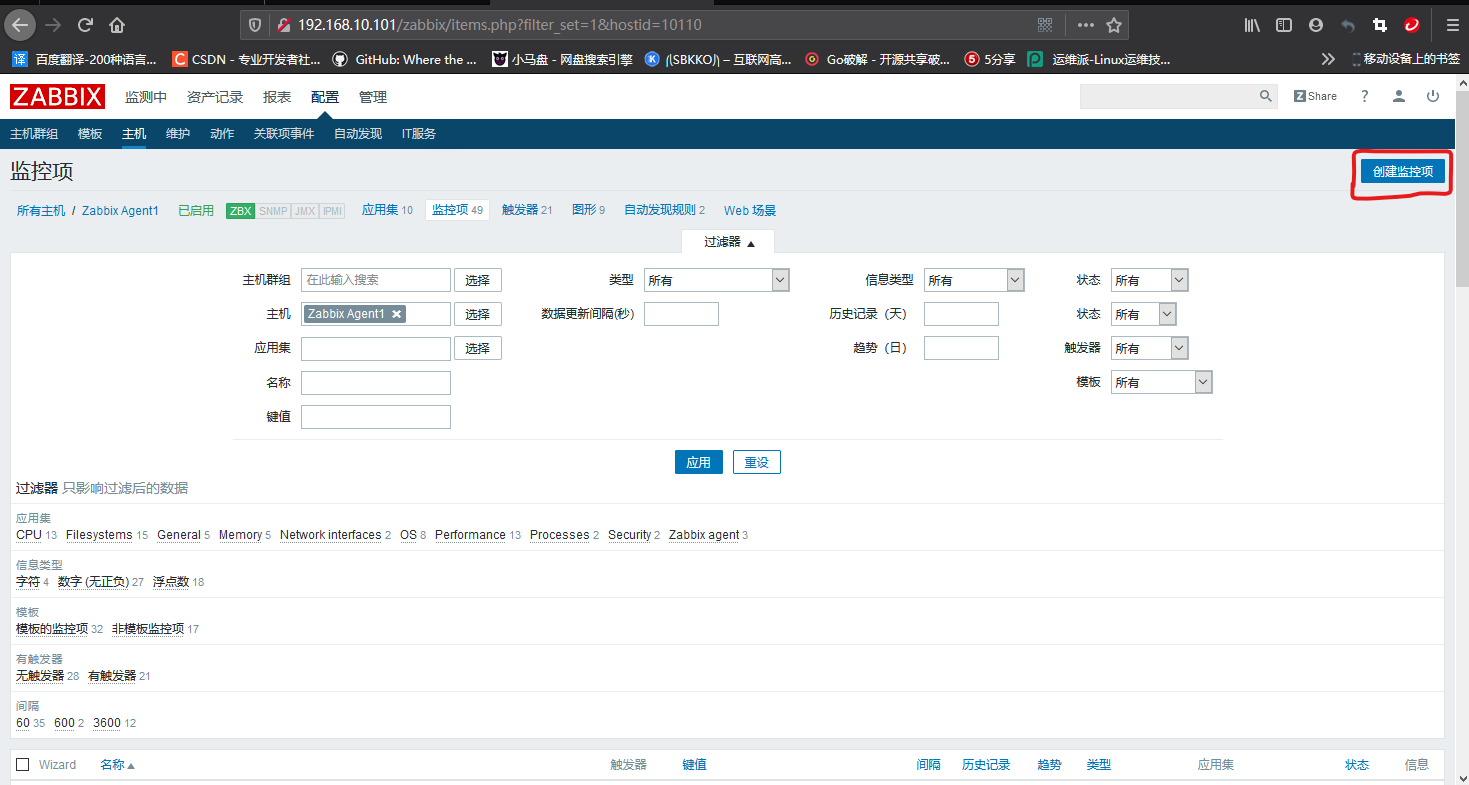
Click "create monitoring item", as shown in the following figure.
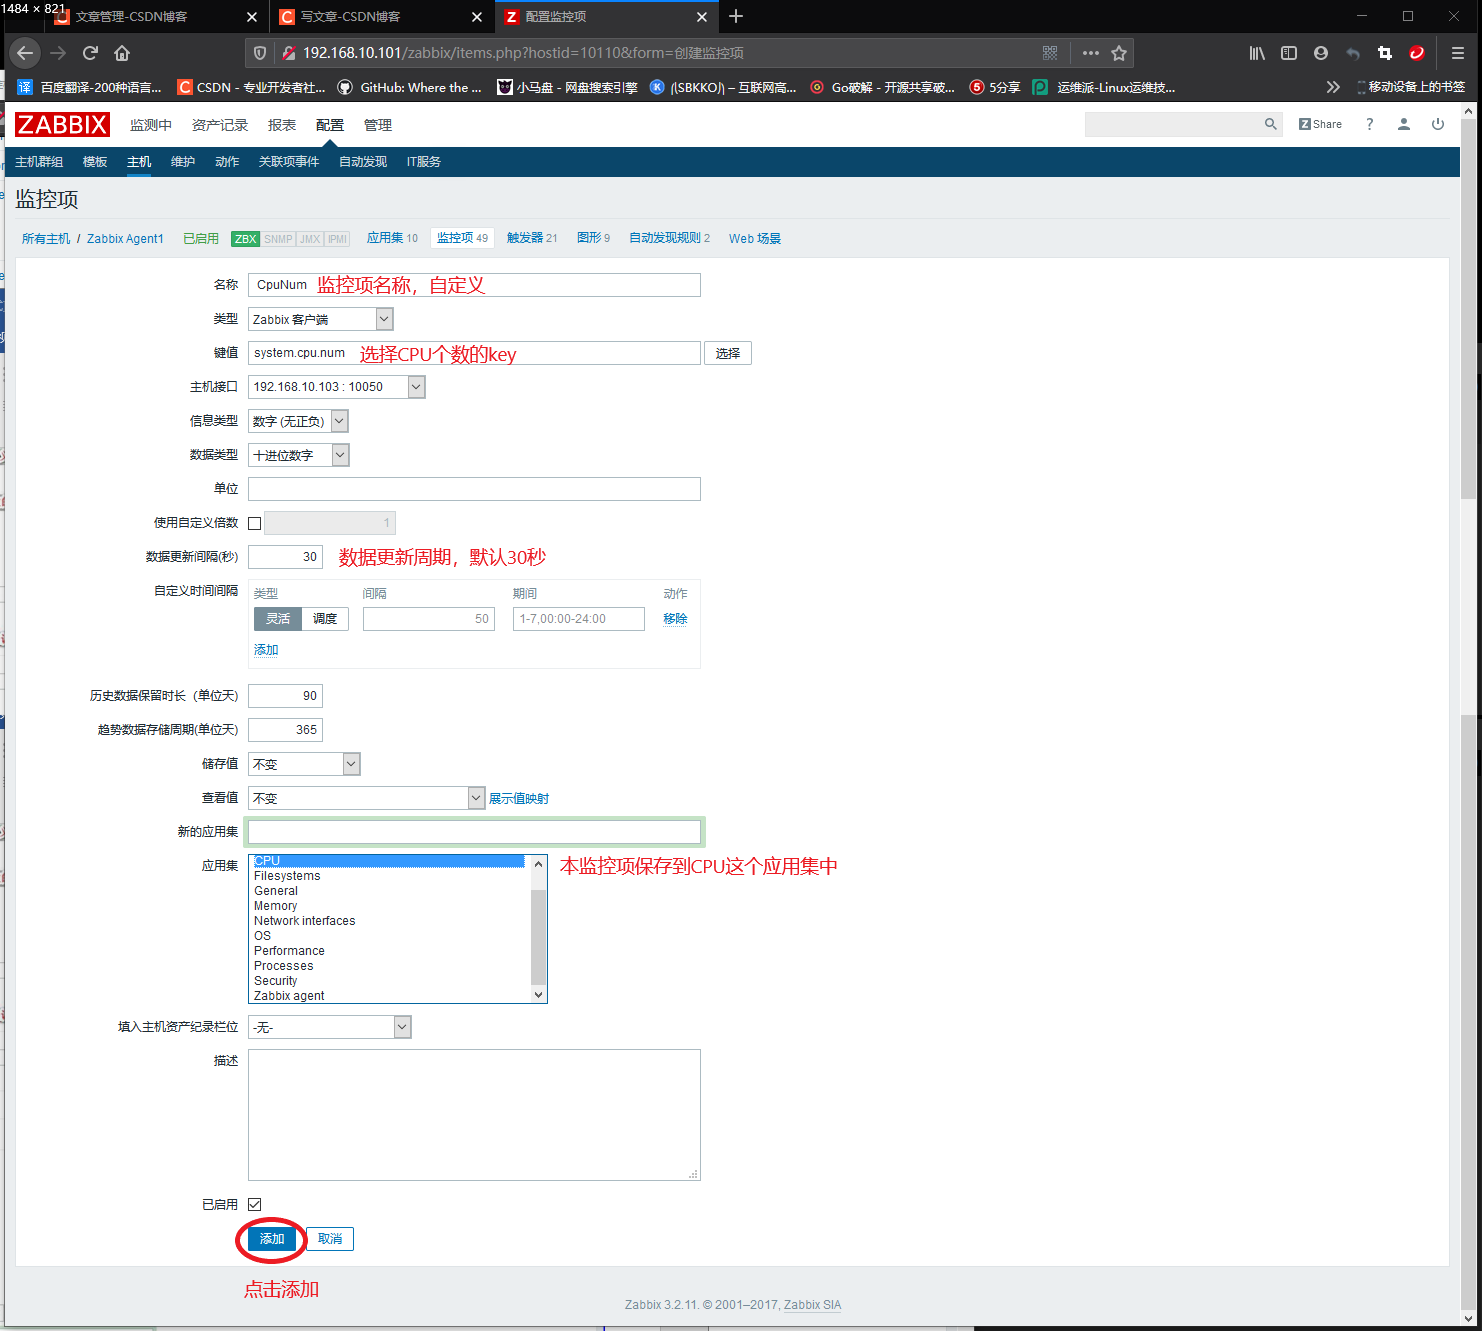
Fill in the relevant information of monitoring items and click the "add" button to complete the creation of monitoring items, as shown in the figure.
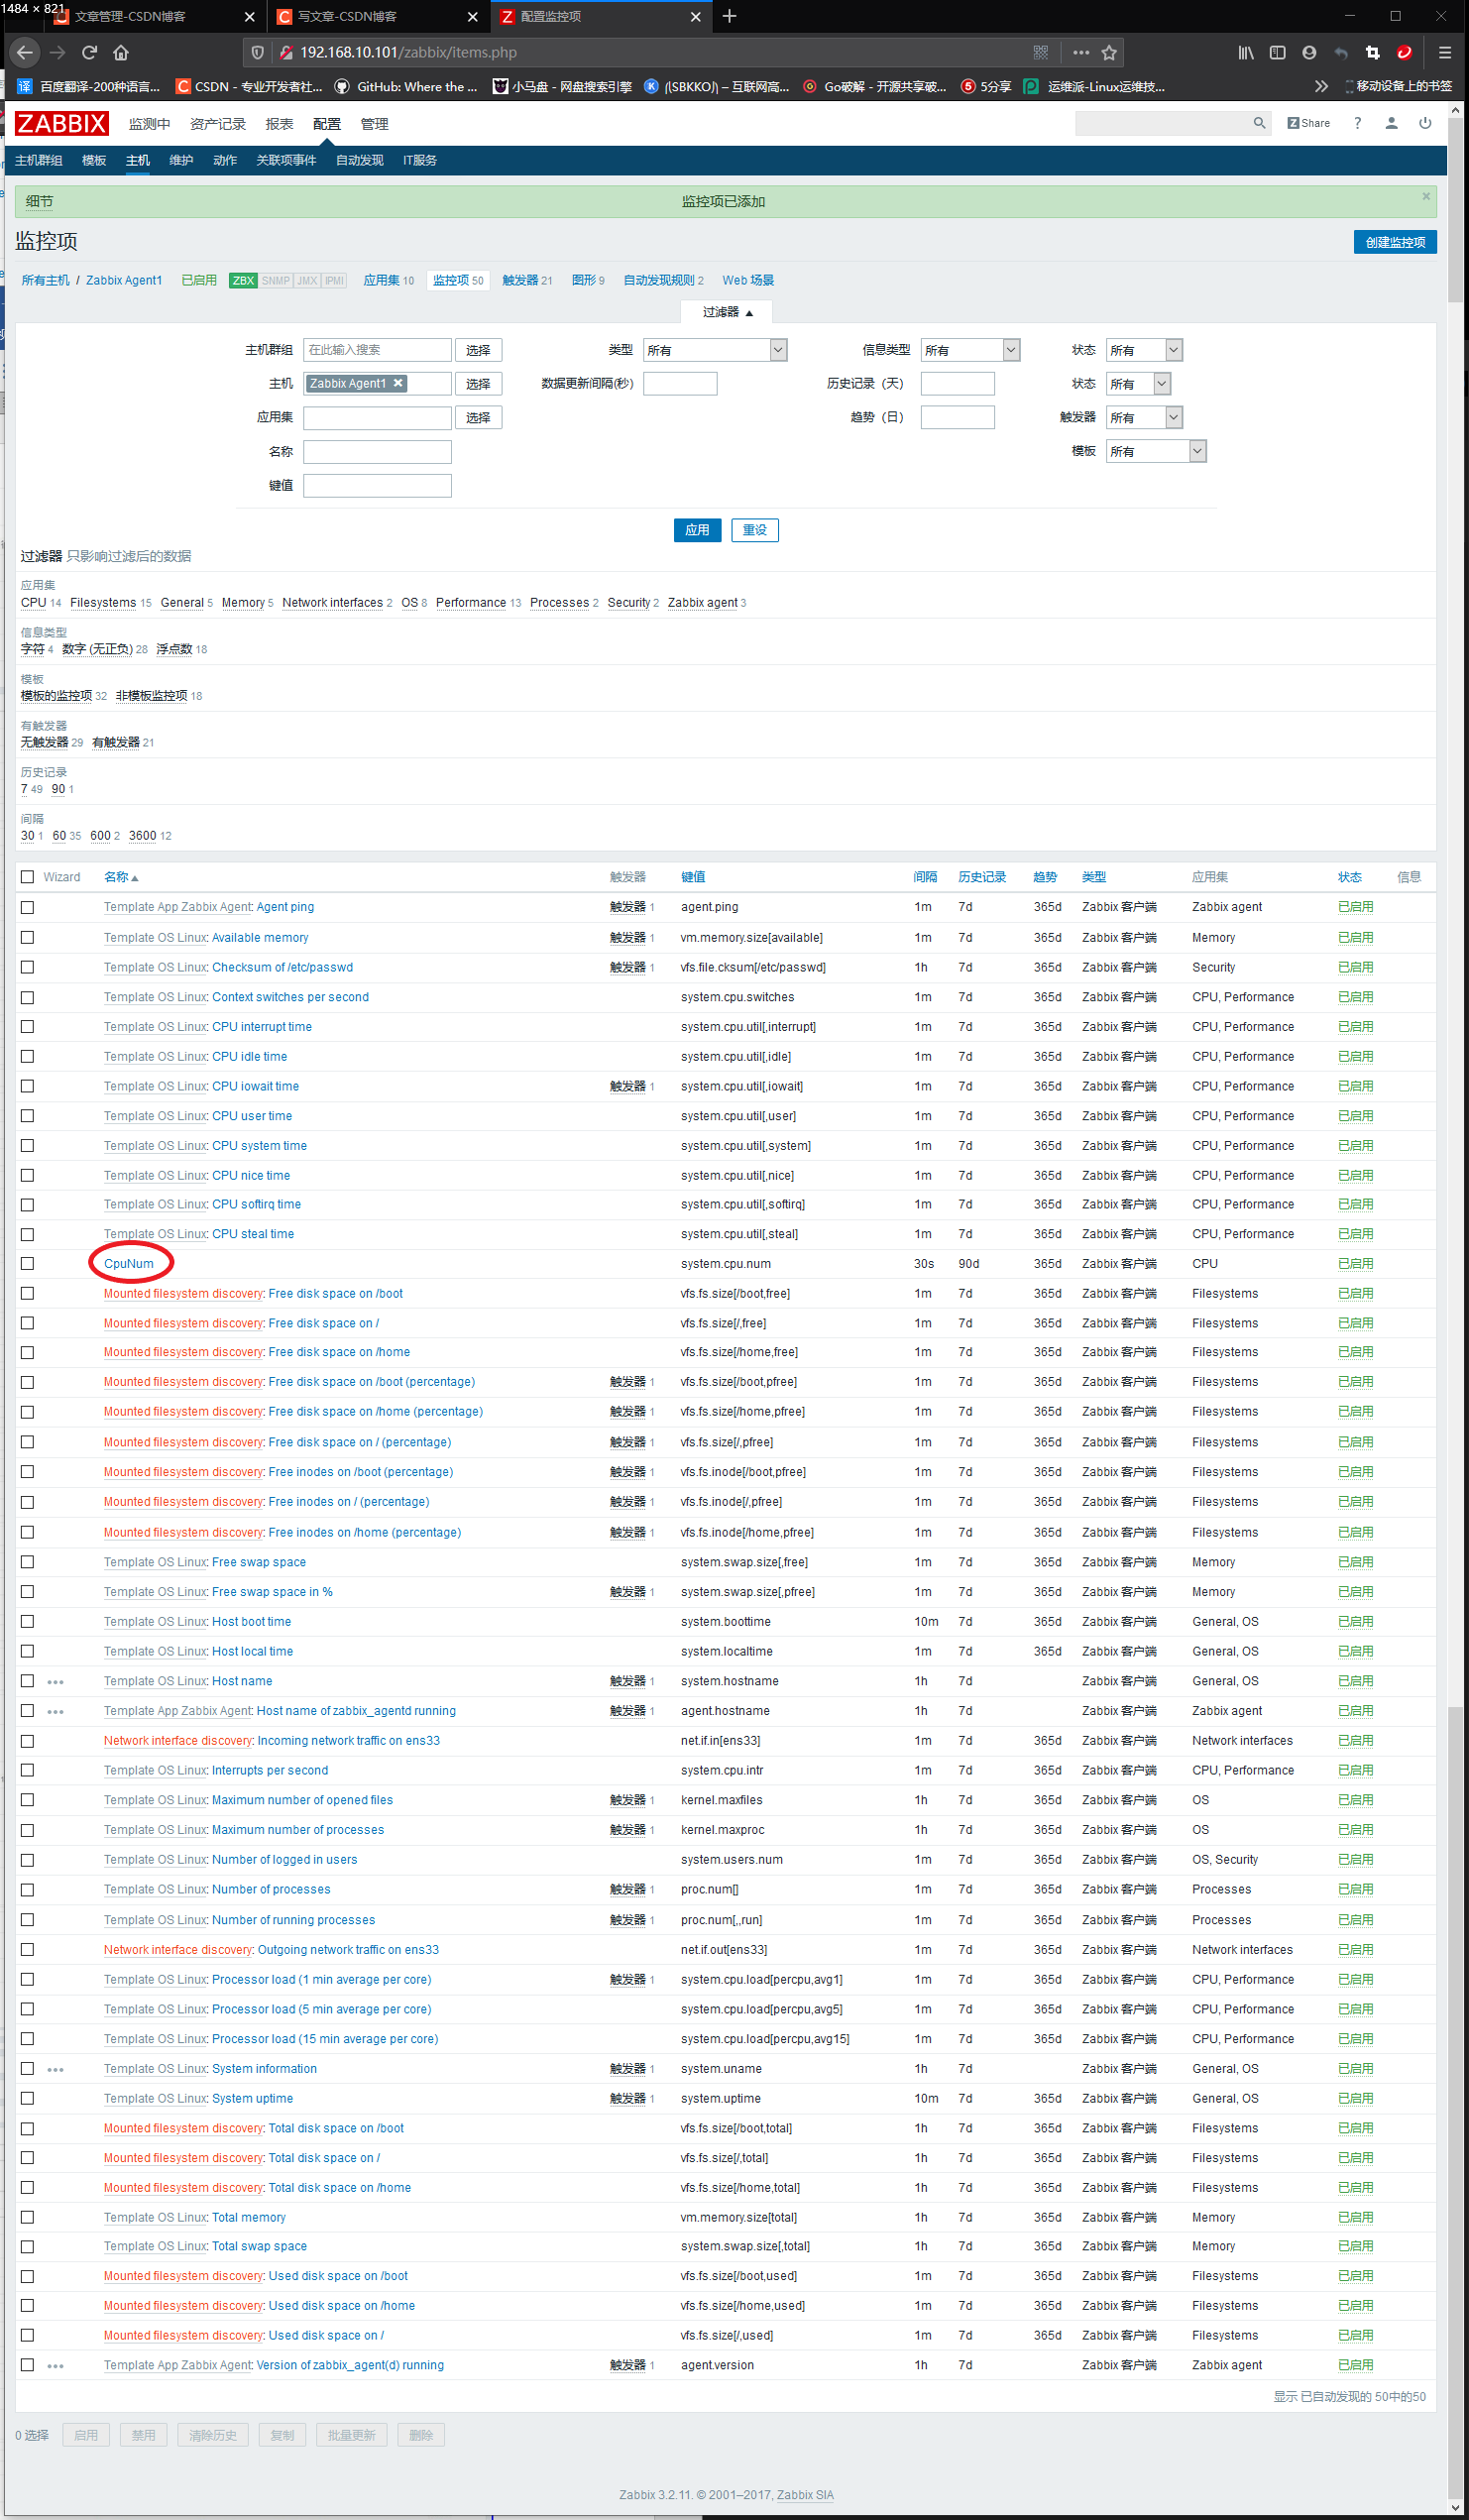
After adding successfully, the "cpunnum" monitoring item will appear in the monitoring item list, as shown in the following figure.
Create trigger
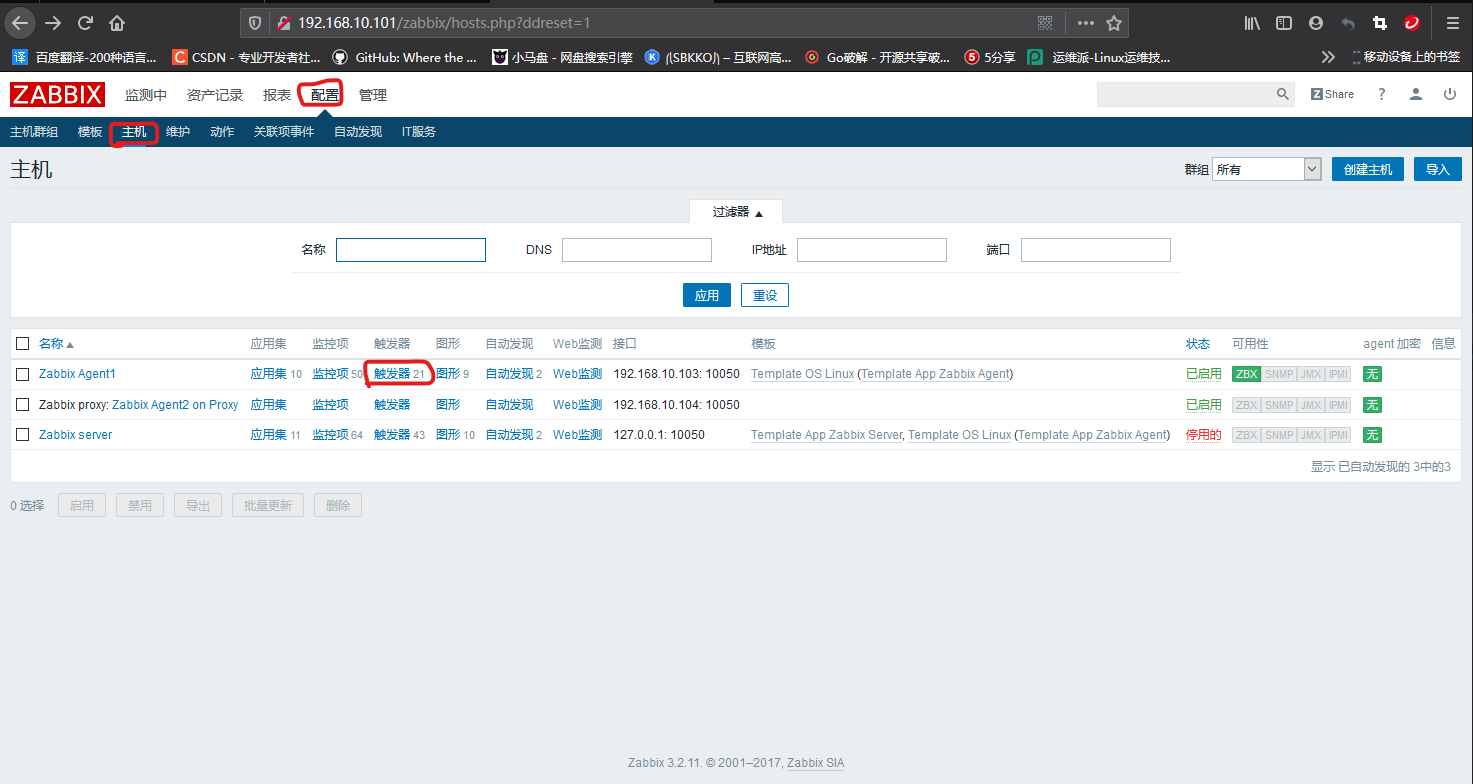
Click "configuration" - "host" in turn, and click "trigger" on the column of host to be configured, as shown in the figure below.
Click "create trigger", as shown in the figure below.
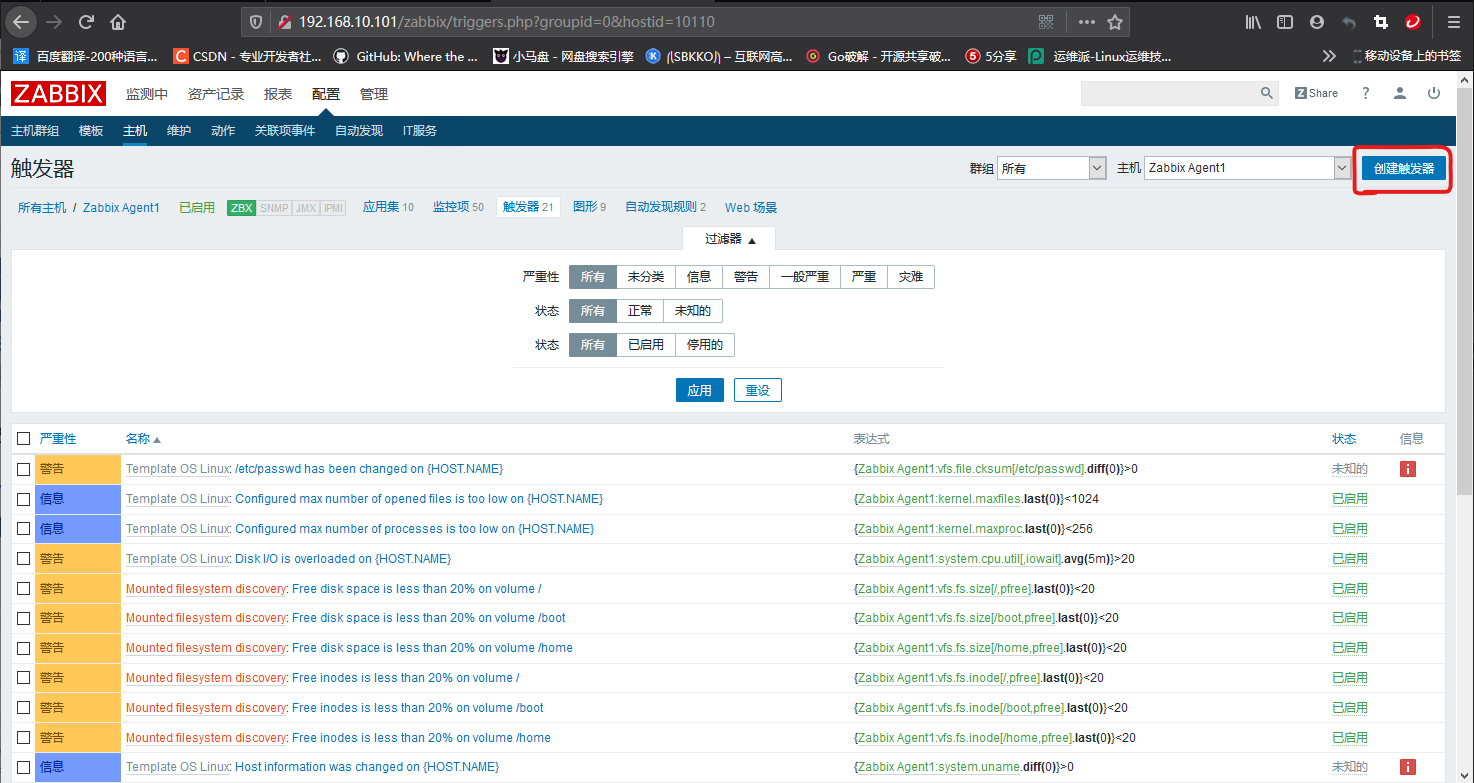
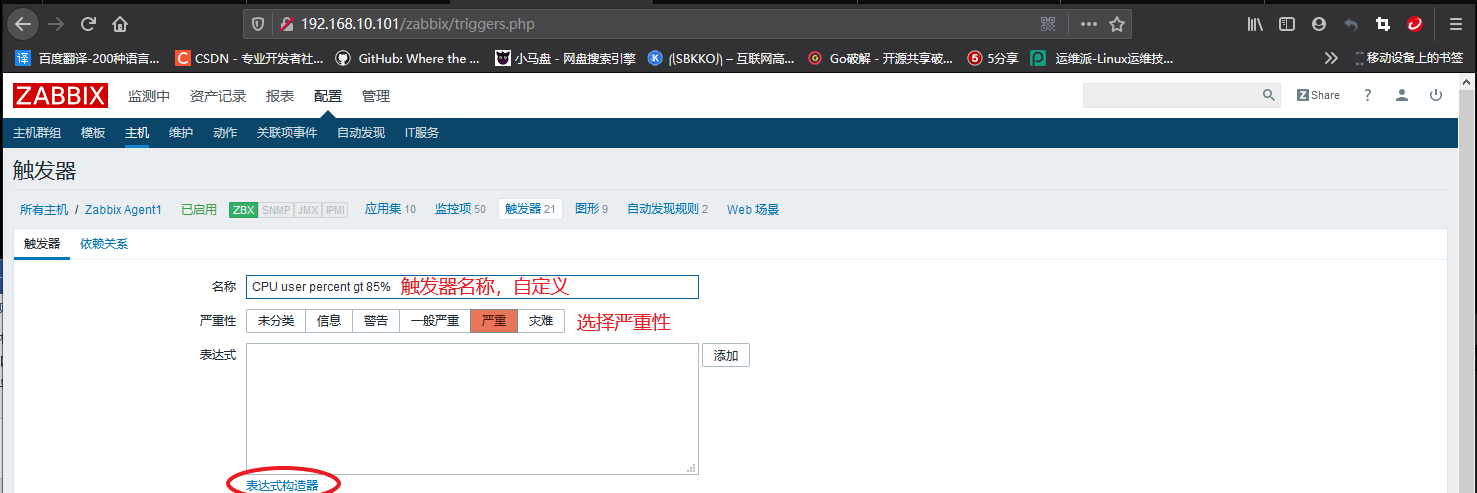
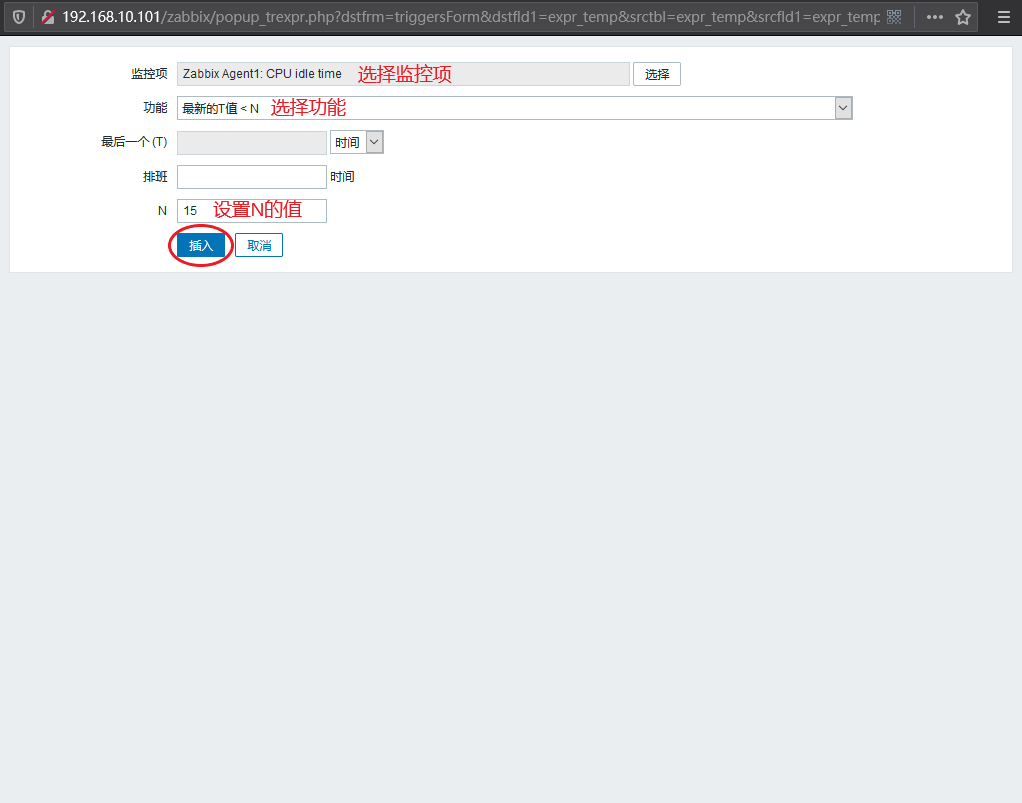
Follow the instructions in the figure below to fill in the trigger related information.

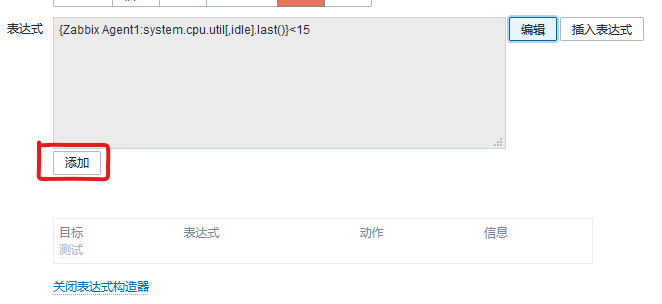
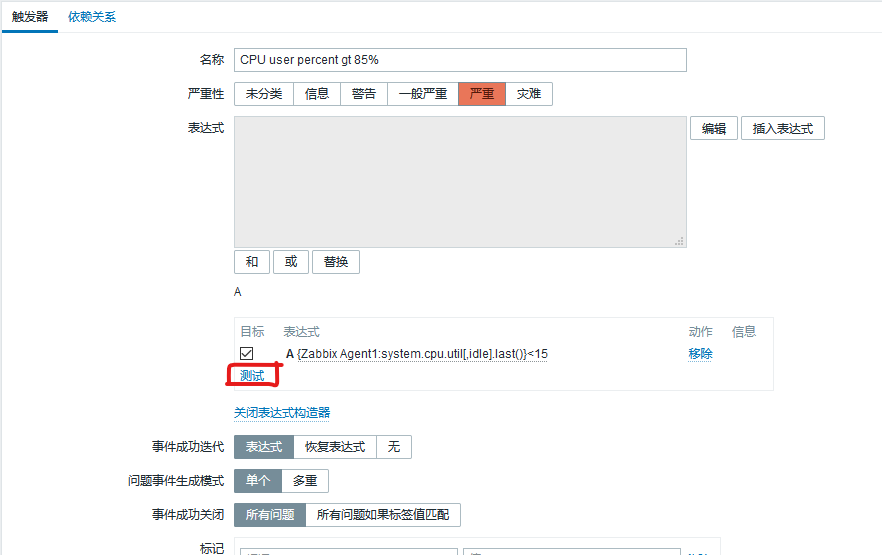
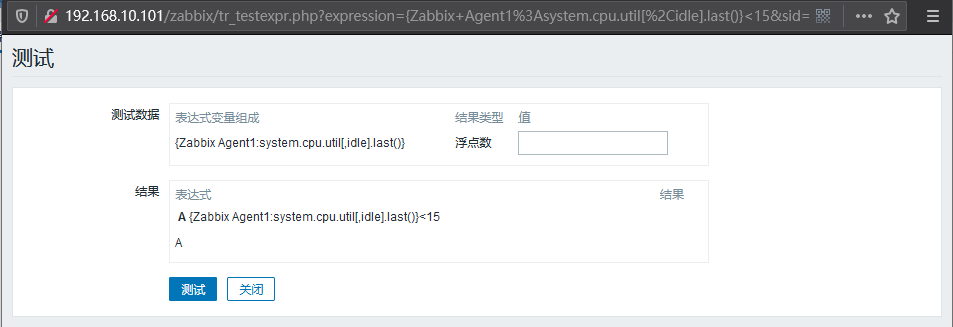
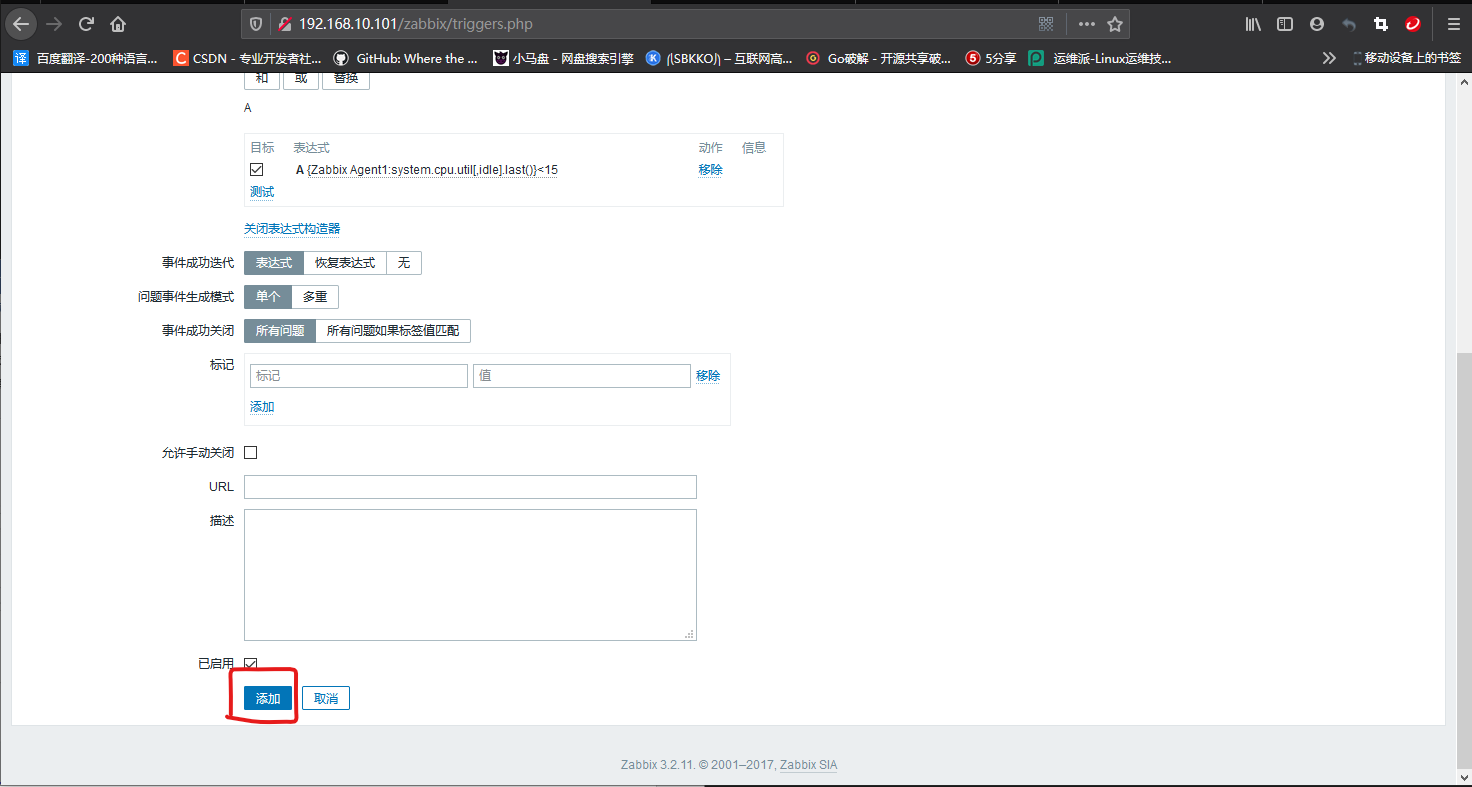
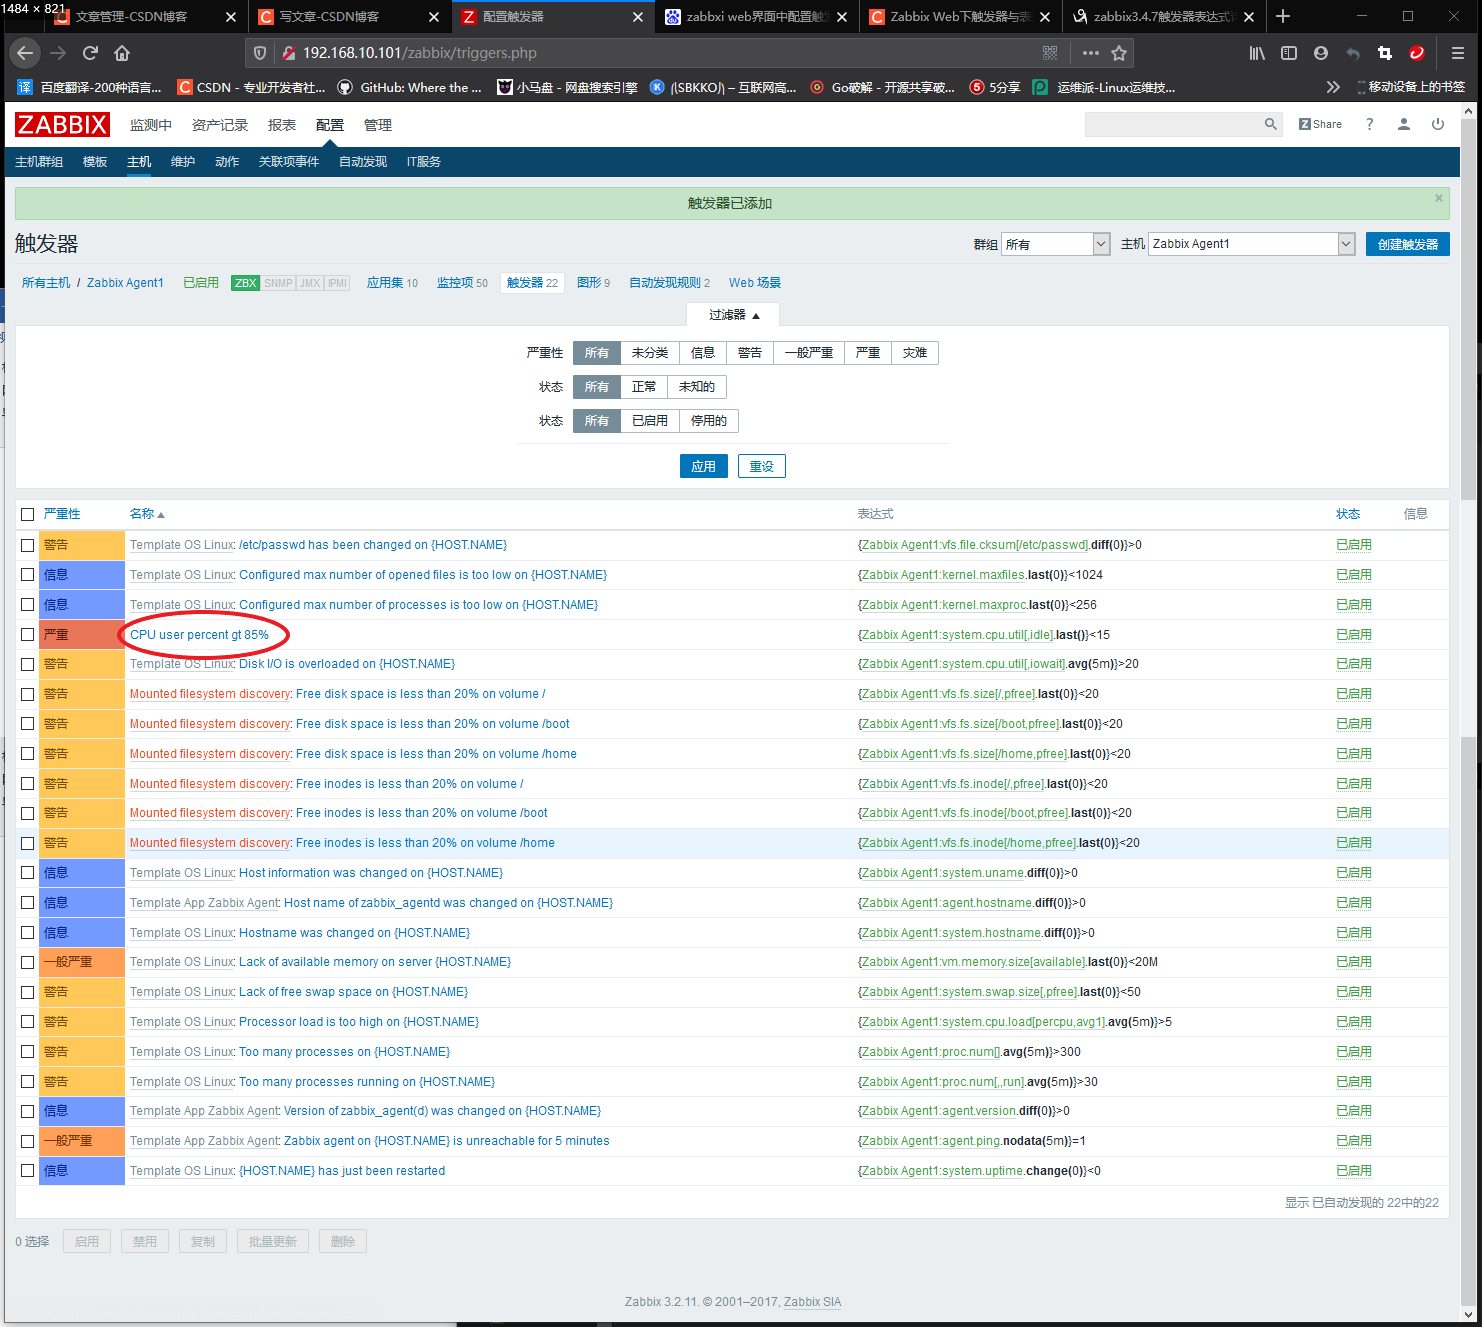
After successful creation, you can see "CPU user percent gt 85%" in the trigger list, as shown in the following figure.
Custom template
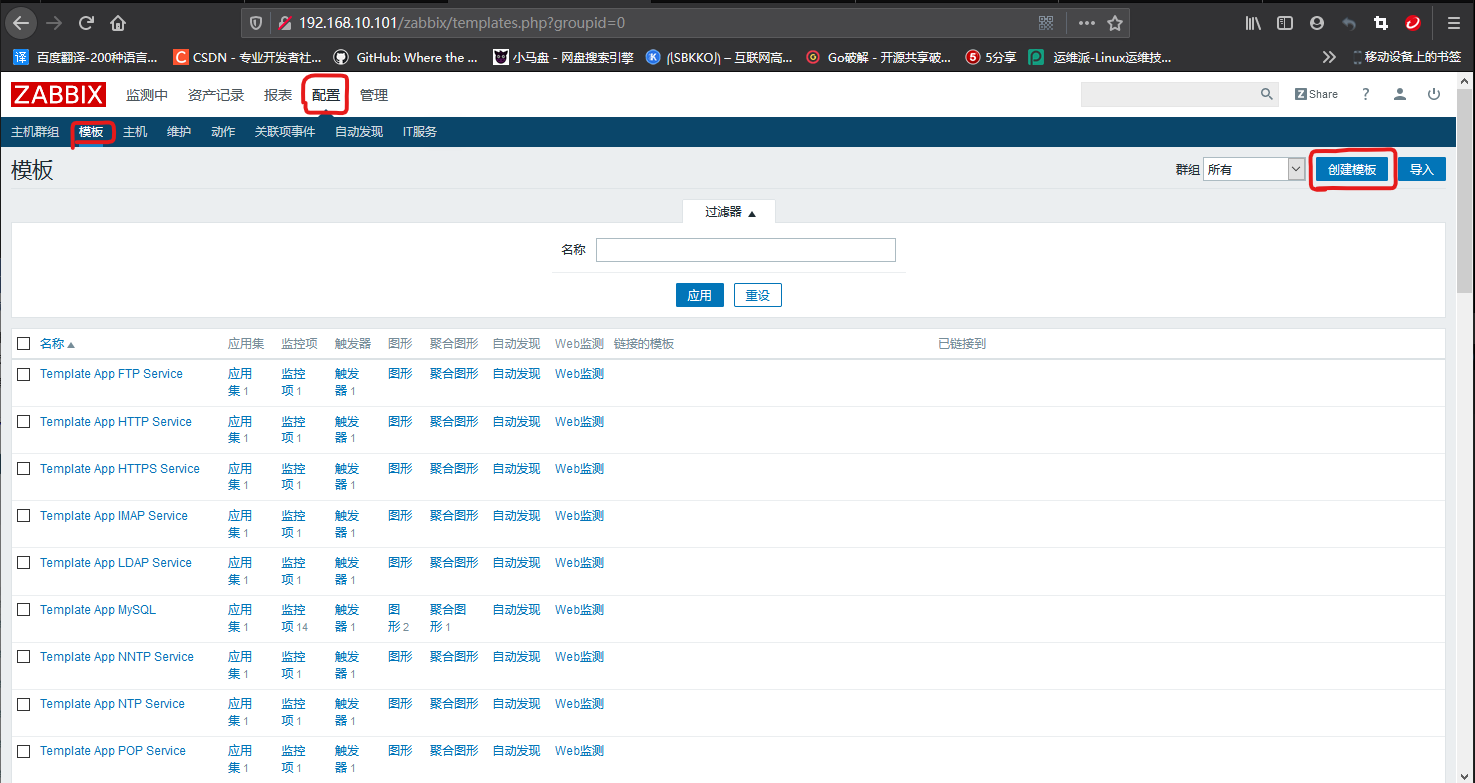
Click Configure - template in turn and select create template, as shown in the following figure.
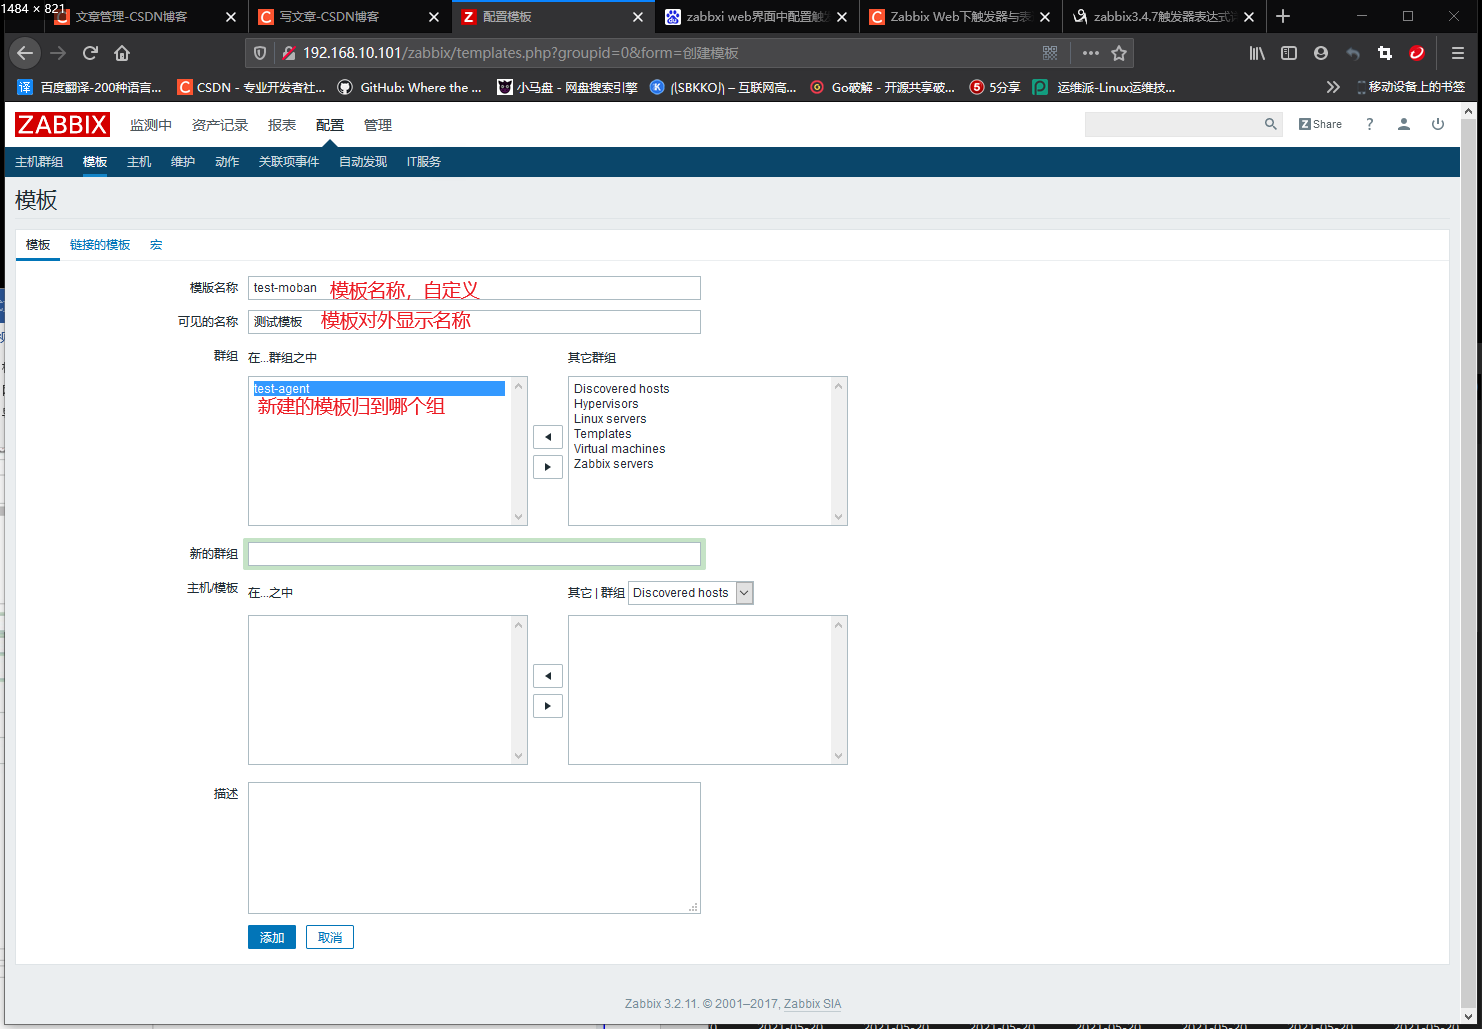
Fill in the template related information according to the instructions in the figure below.
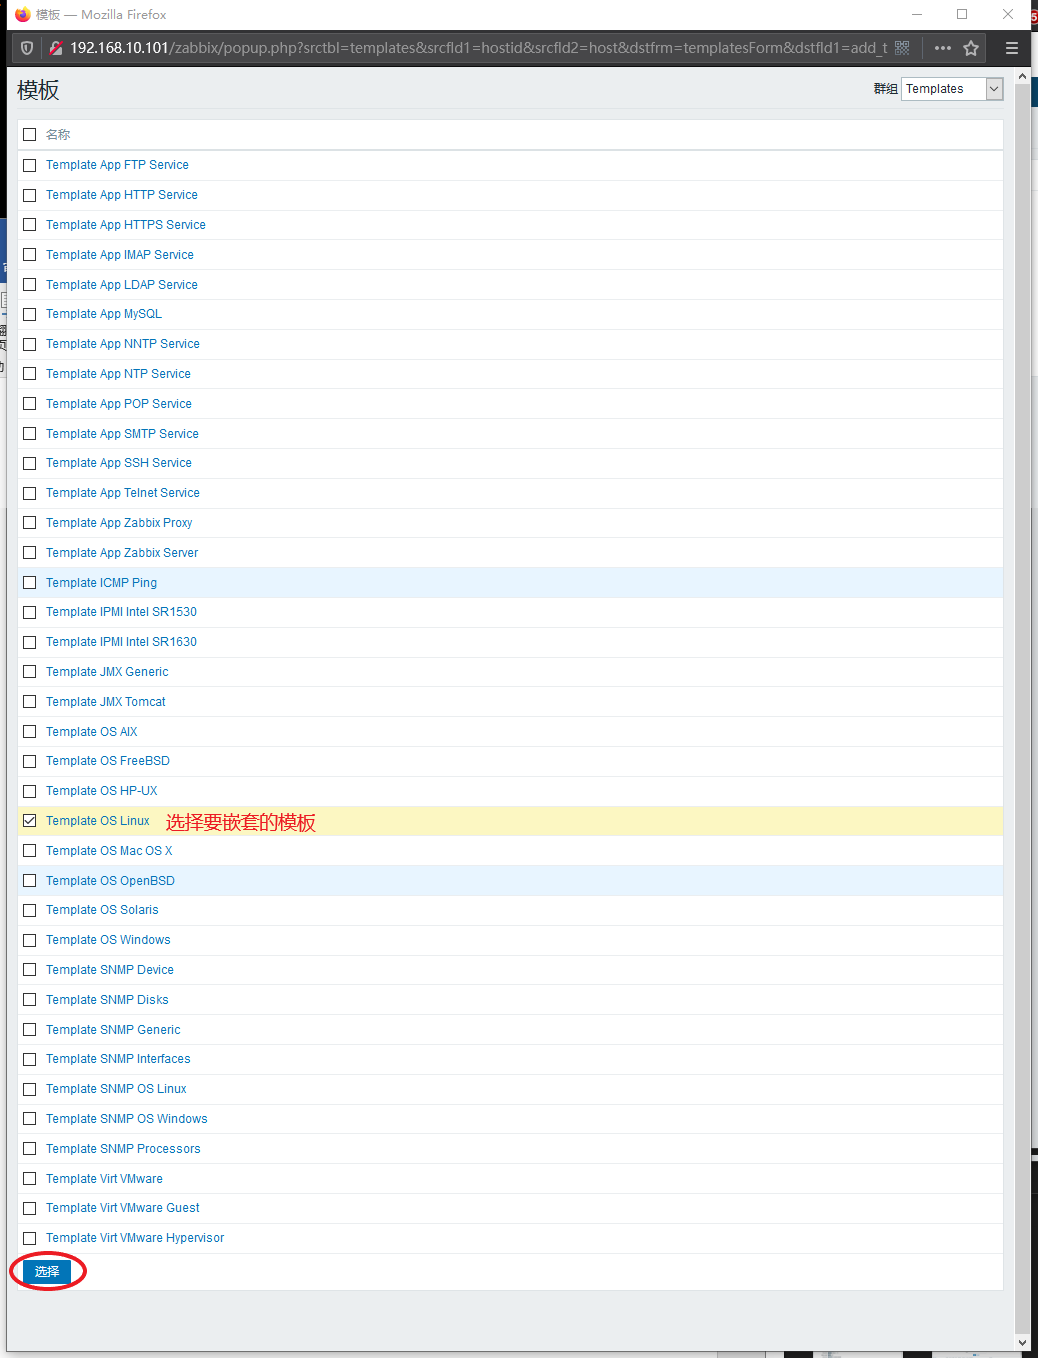
Select the linked templates tab to add templates that need to be nested, as shown in the following figure.


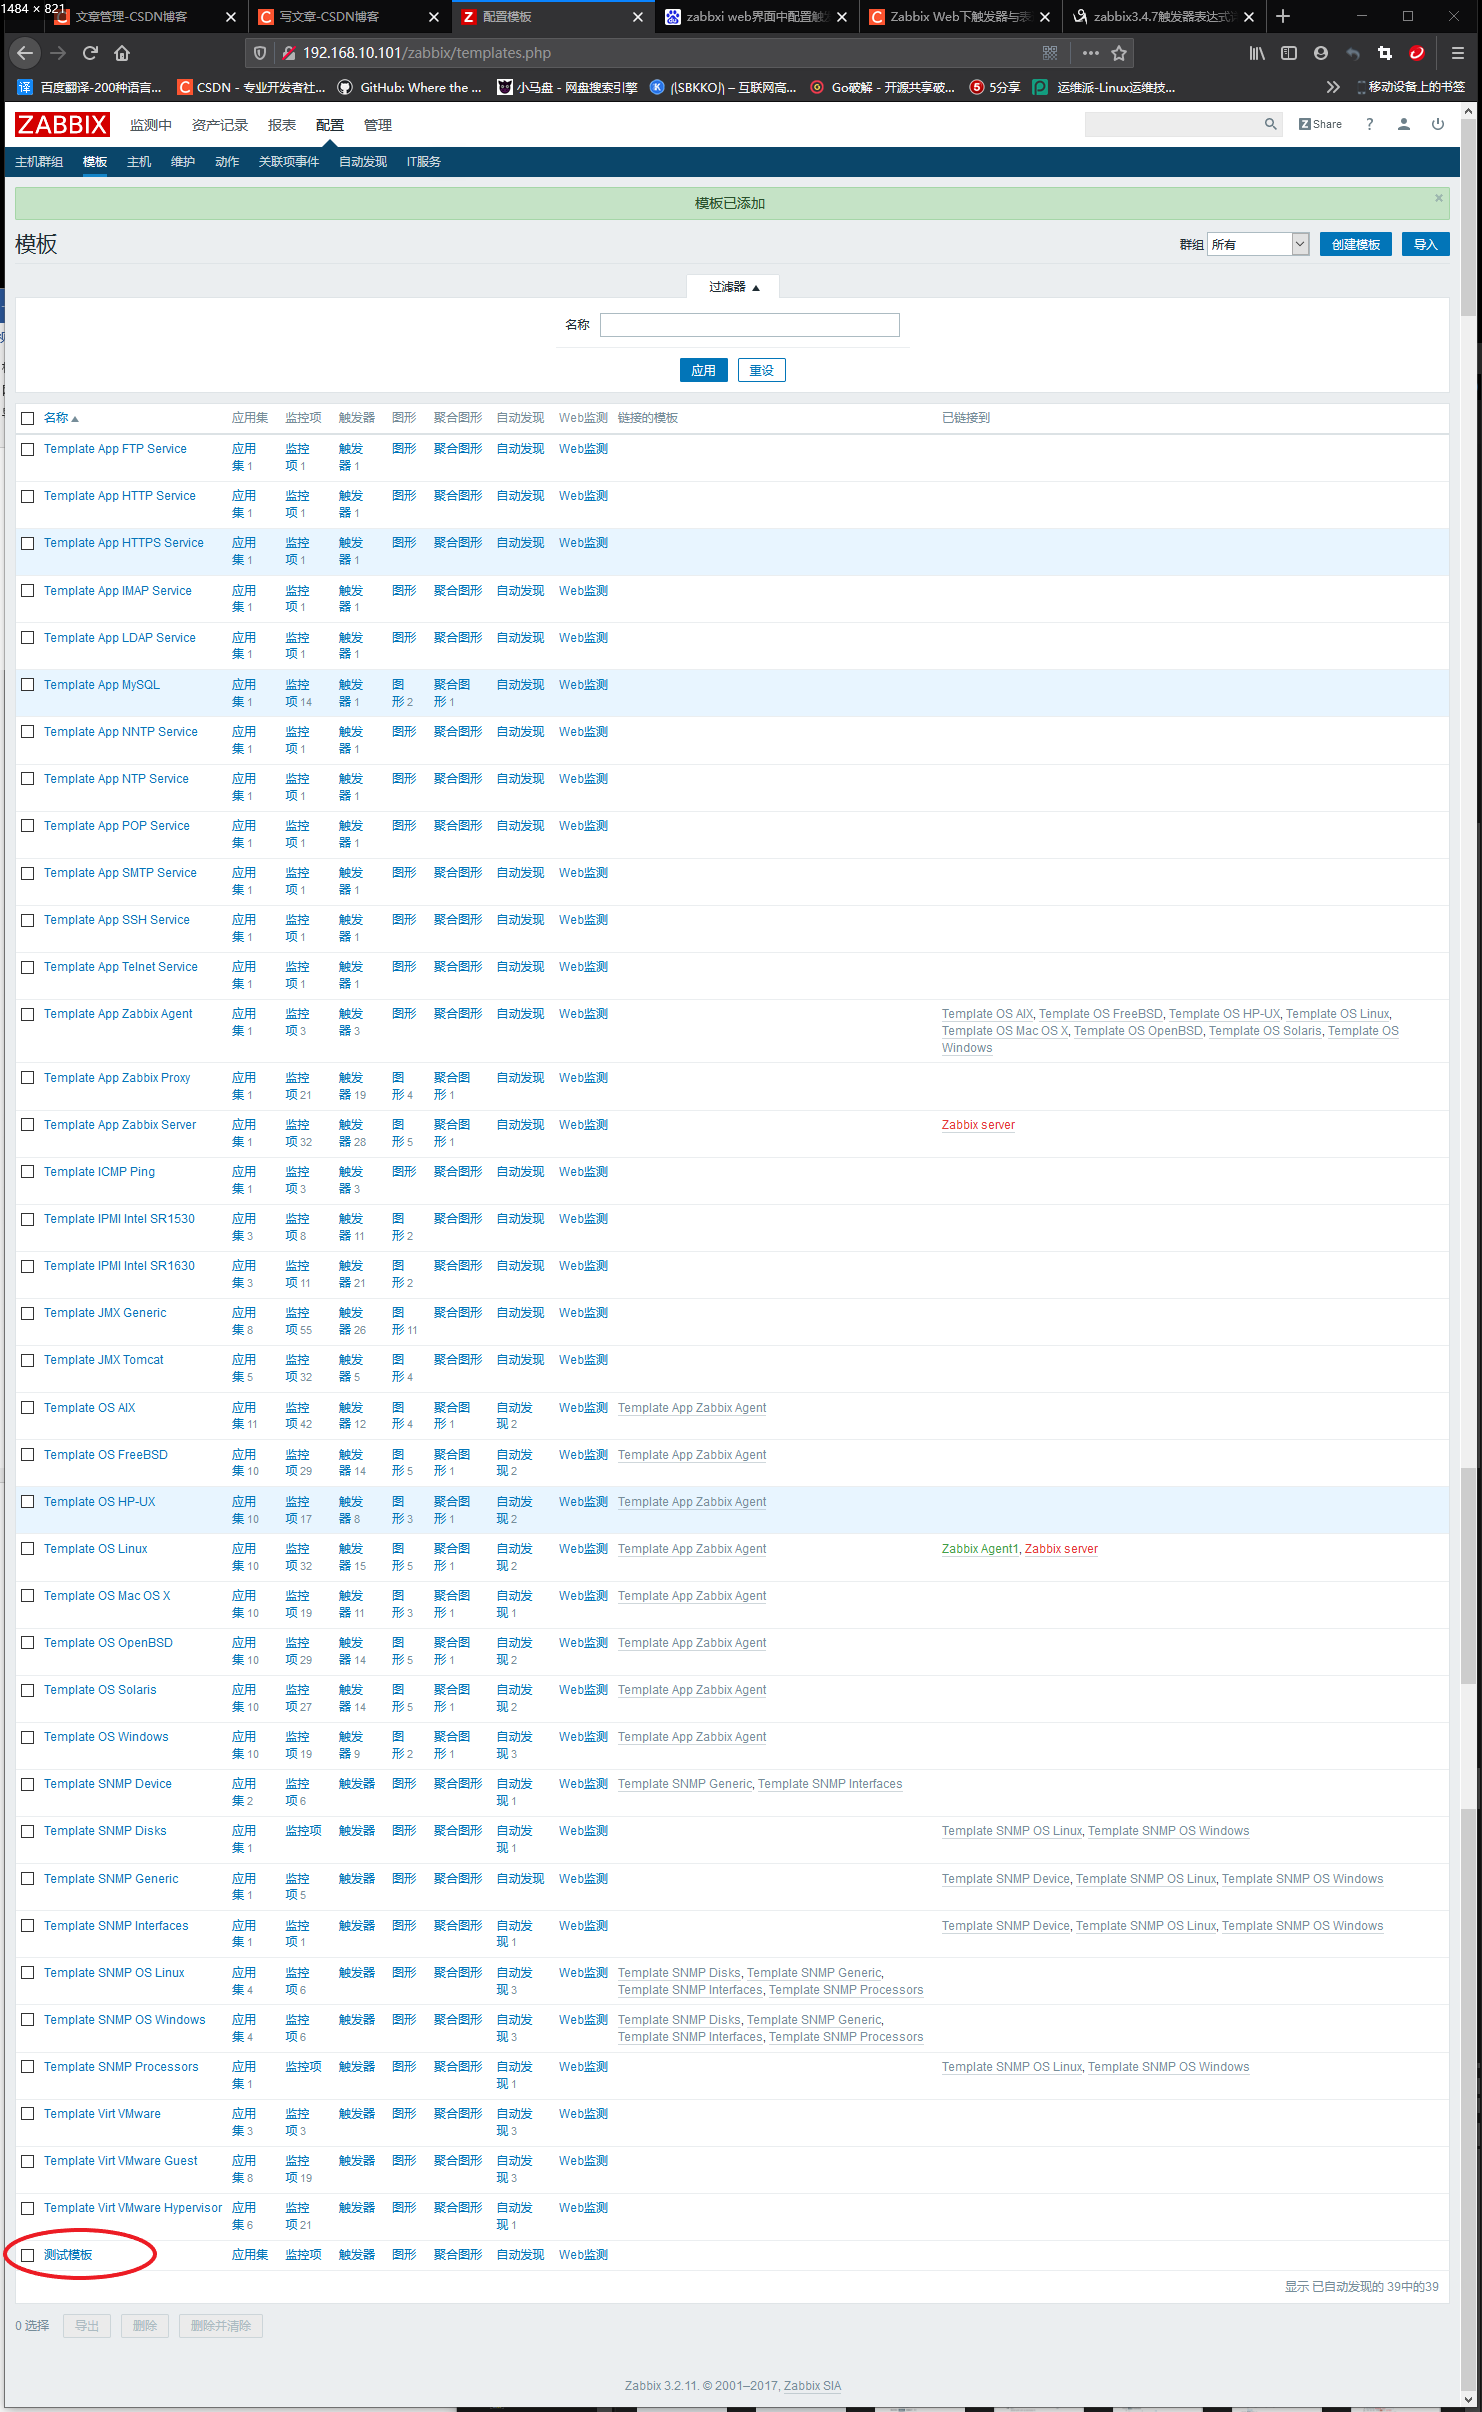
After creation, you can see the item "test template" in the template list. Users can continue to add monitoring items and triggers to the template, as shown in the following figure.
Main functions of Zabbix
Zabbix can monitor Windows, Linux and other host operating systems, as well as common application systems, such as Web system, mail system and so on. The following illustrates the common functions of Zabbix from the aspects of server monitoring, SSH application monitoring, Web system monitoring and network topology configuration.
1. Server monitoring
The basic monitoring items of Linux server exist in the Template OS Linux. You can realize the basic monitoring of the server by associating the client host with the template. In this example, both client hosts have been associated with the template.
2. Application monitoring
Taking monitoring sshd as an example, first create a monitoring item to monitor the number of sshd processes, as shown in the figure below.
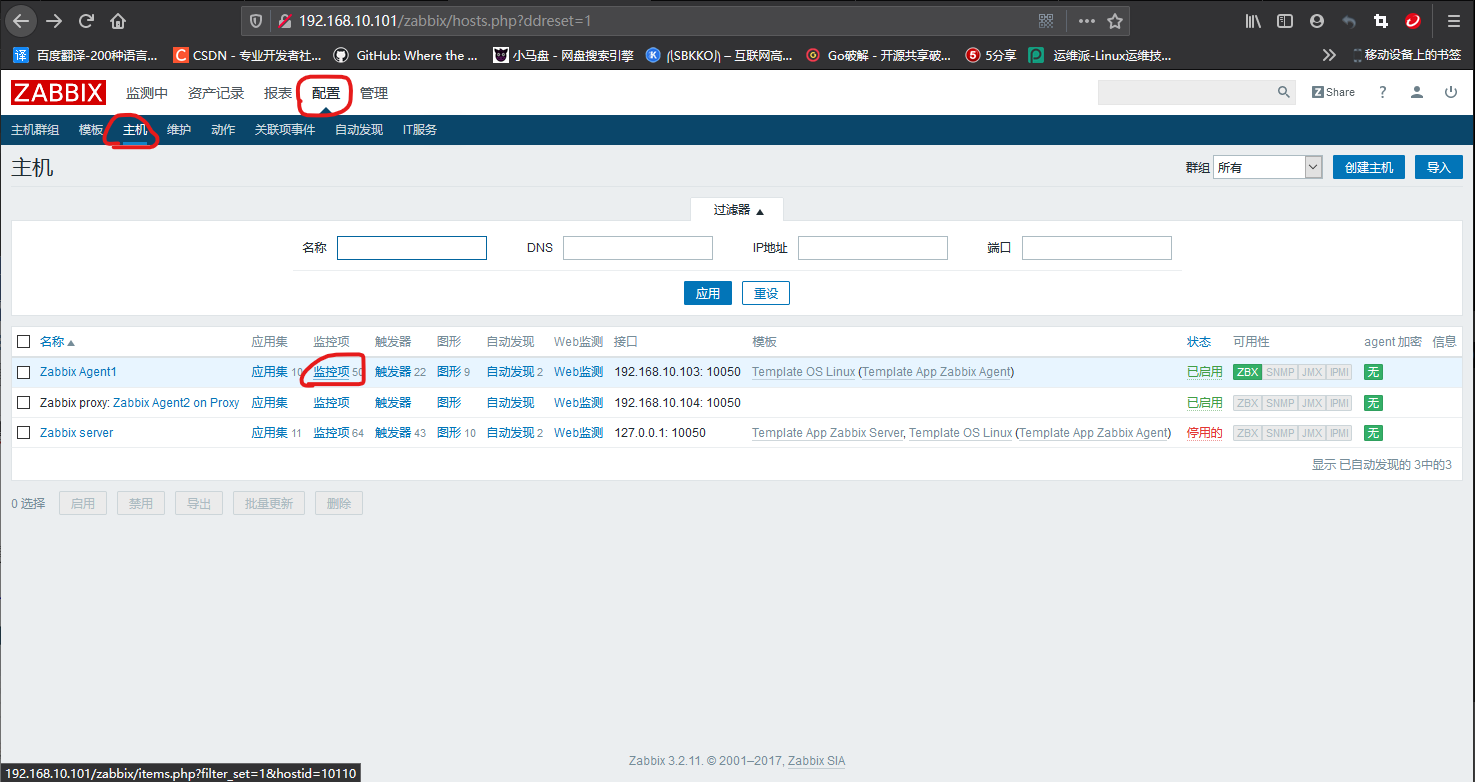
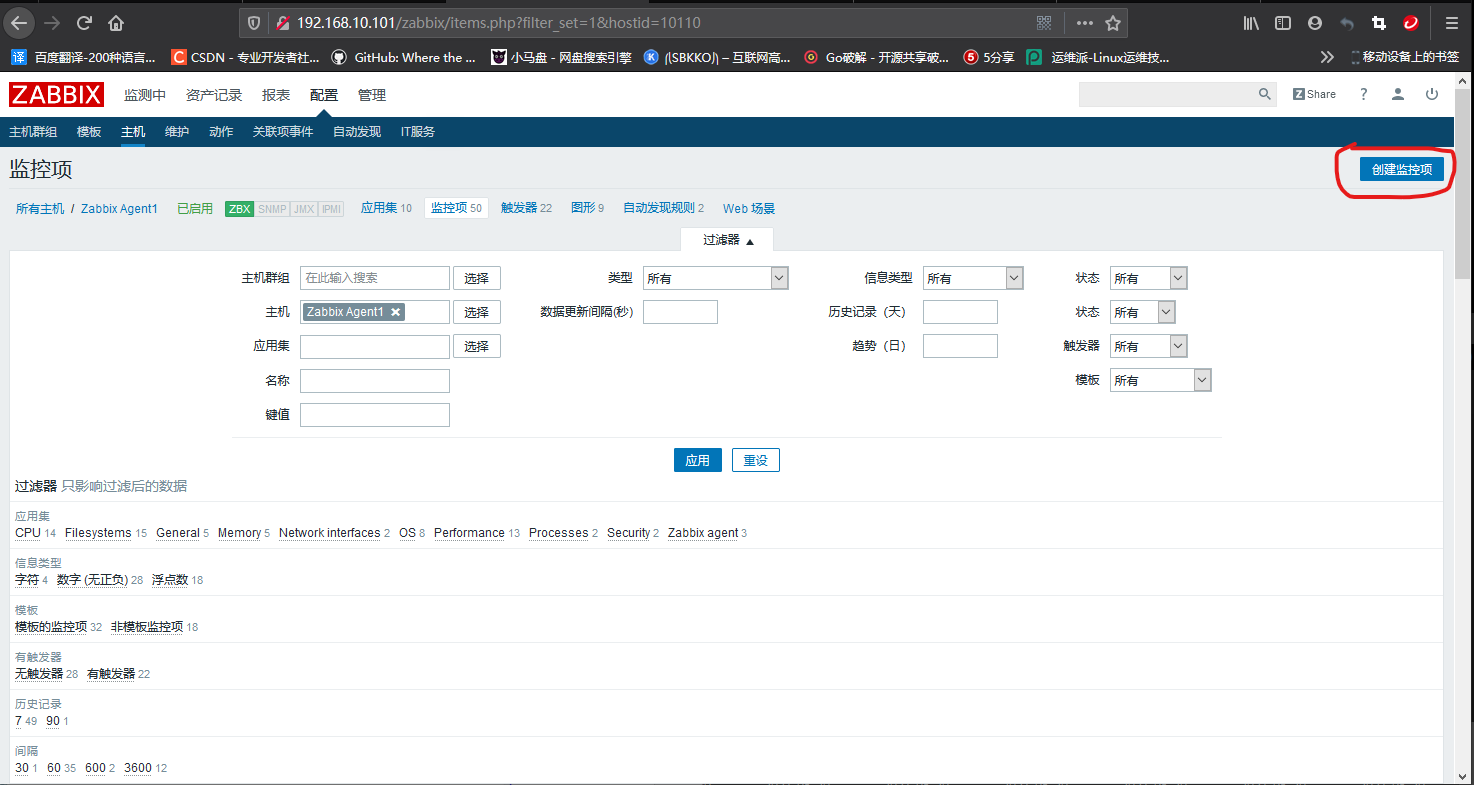
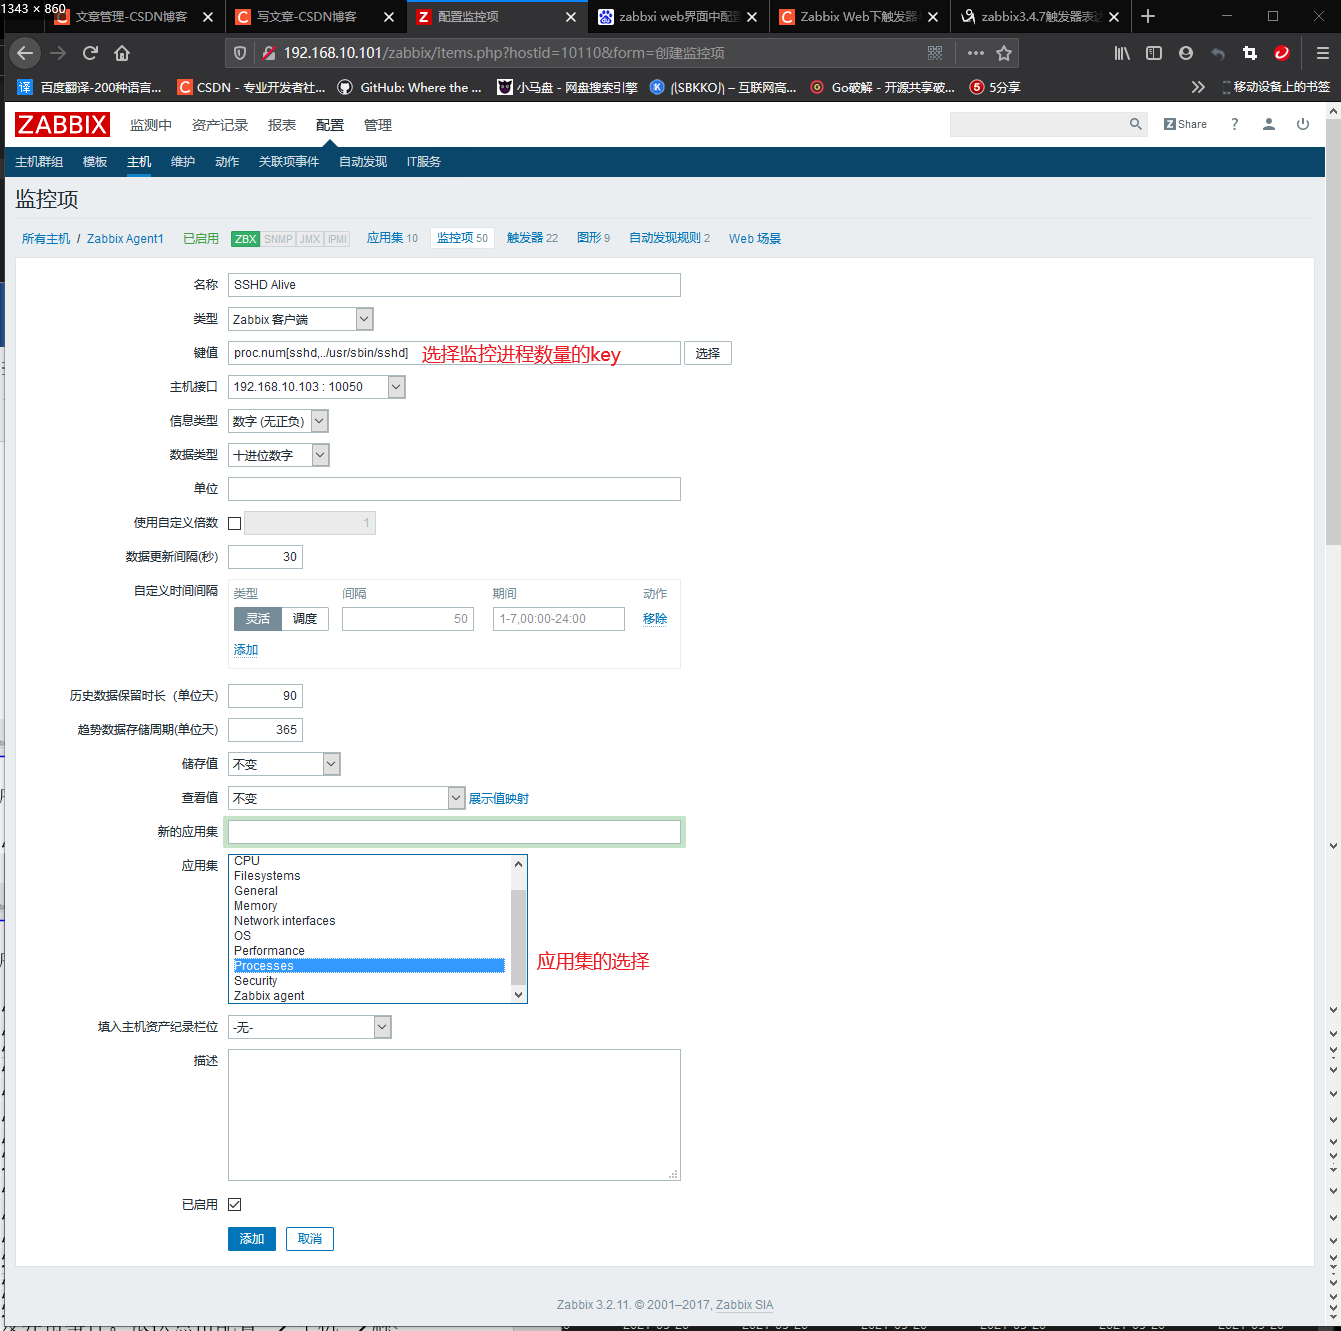
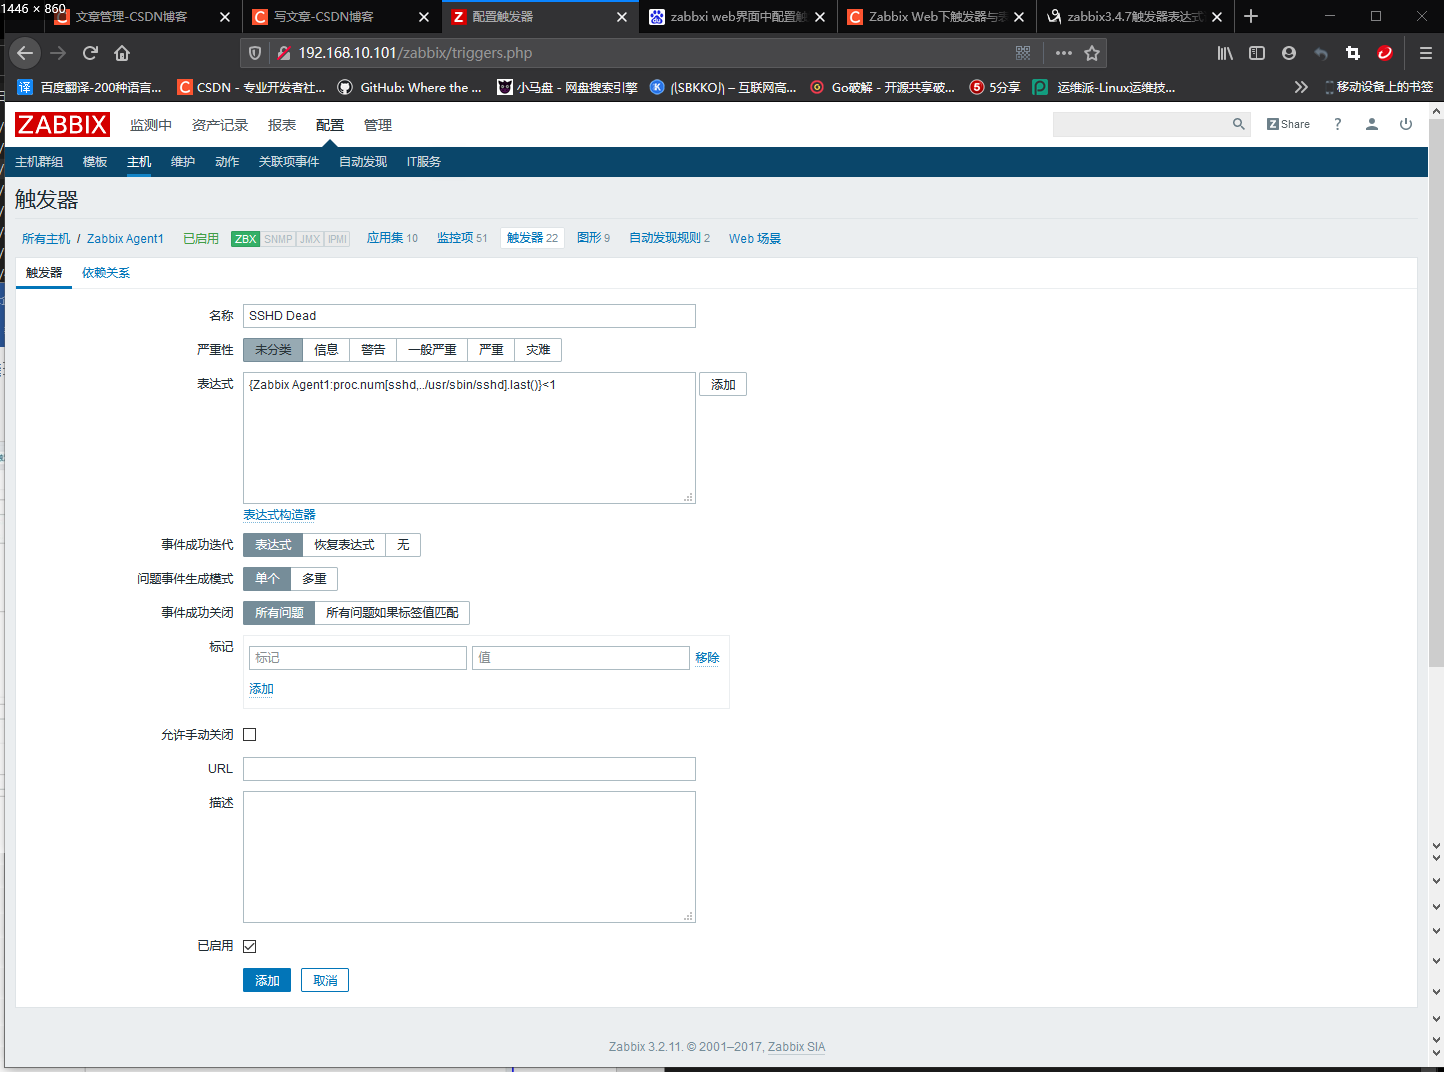
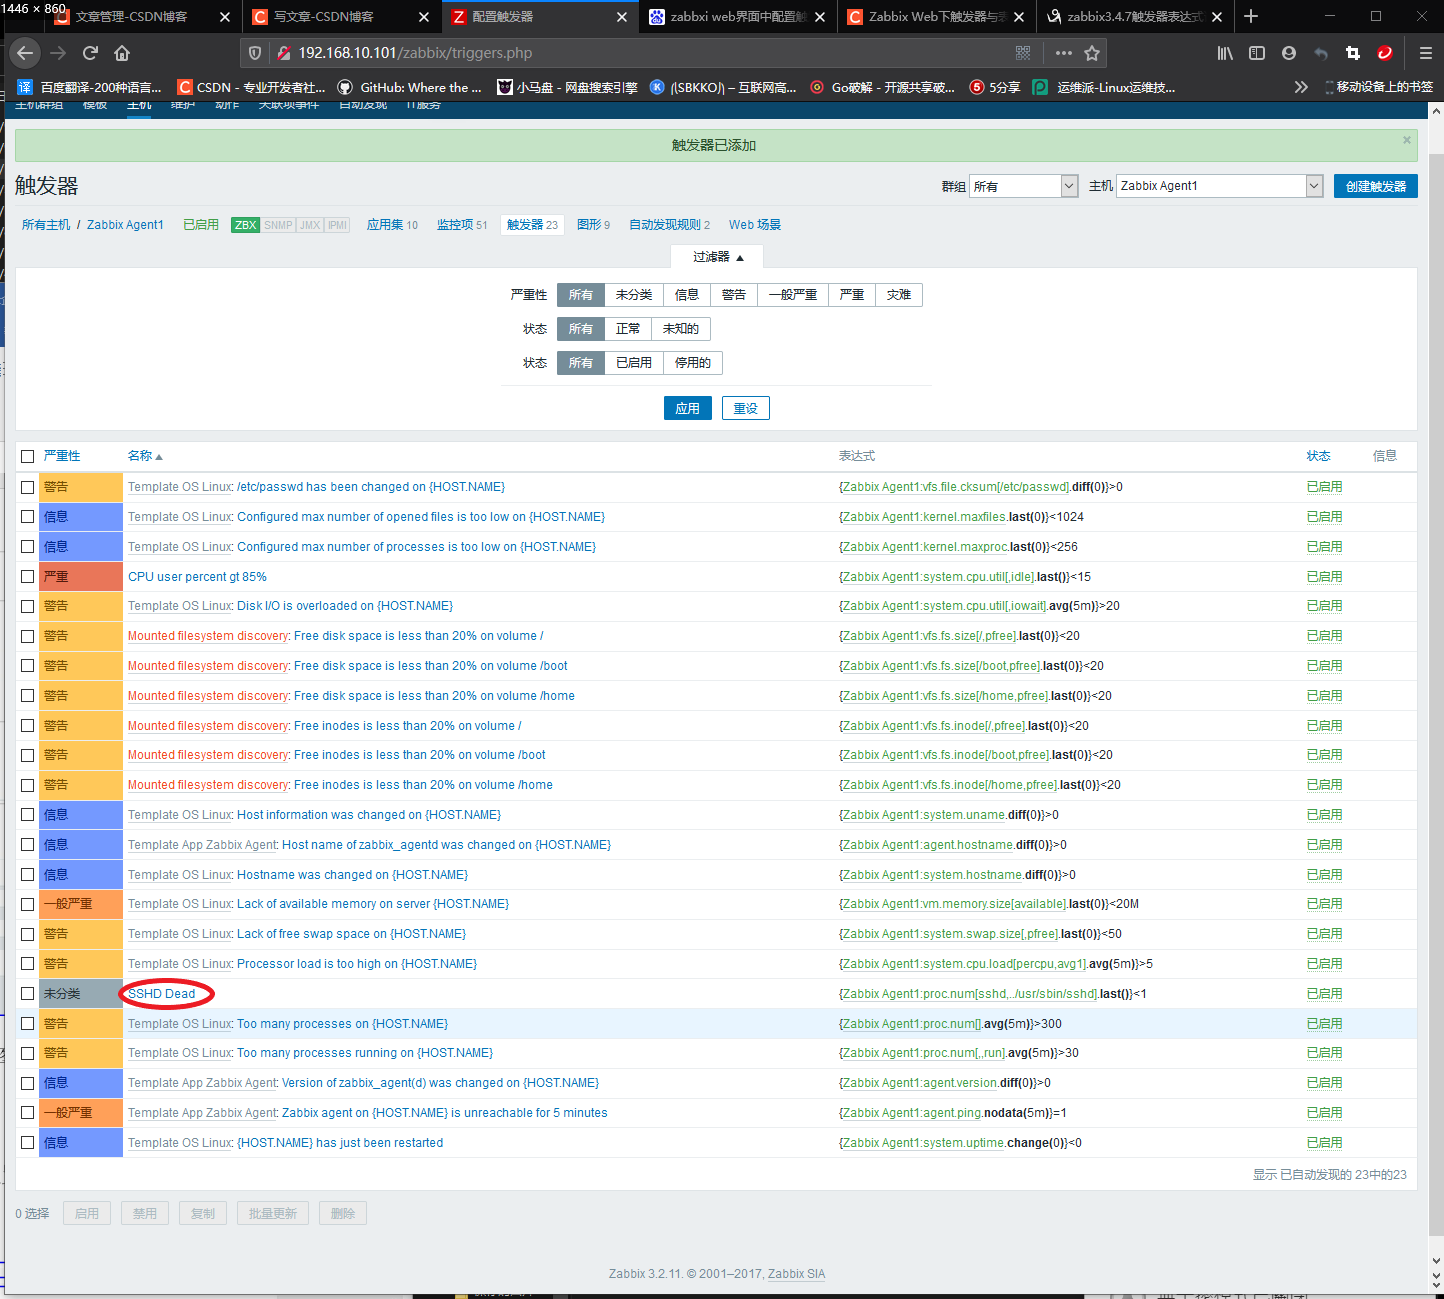
Secondly, create triggers to trigger abnormal events when the number of processes is less than 1. Click Configure - Host - trigger in turn and select Create trigger, as shown in the figure.
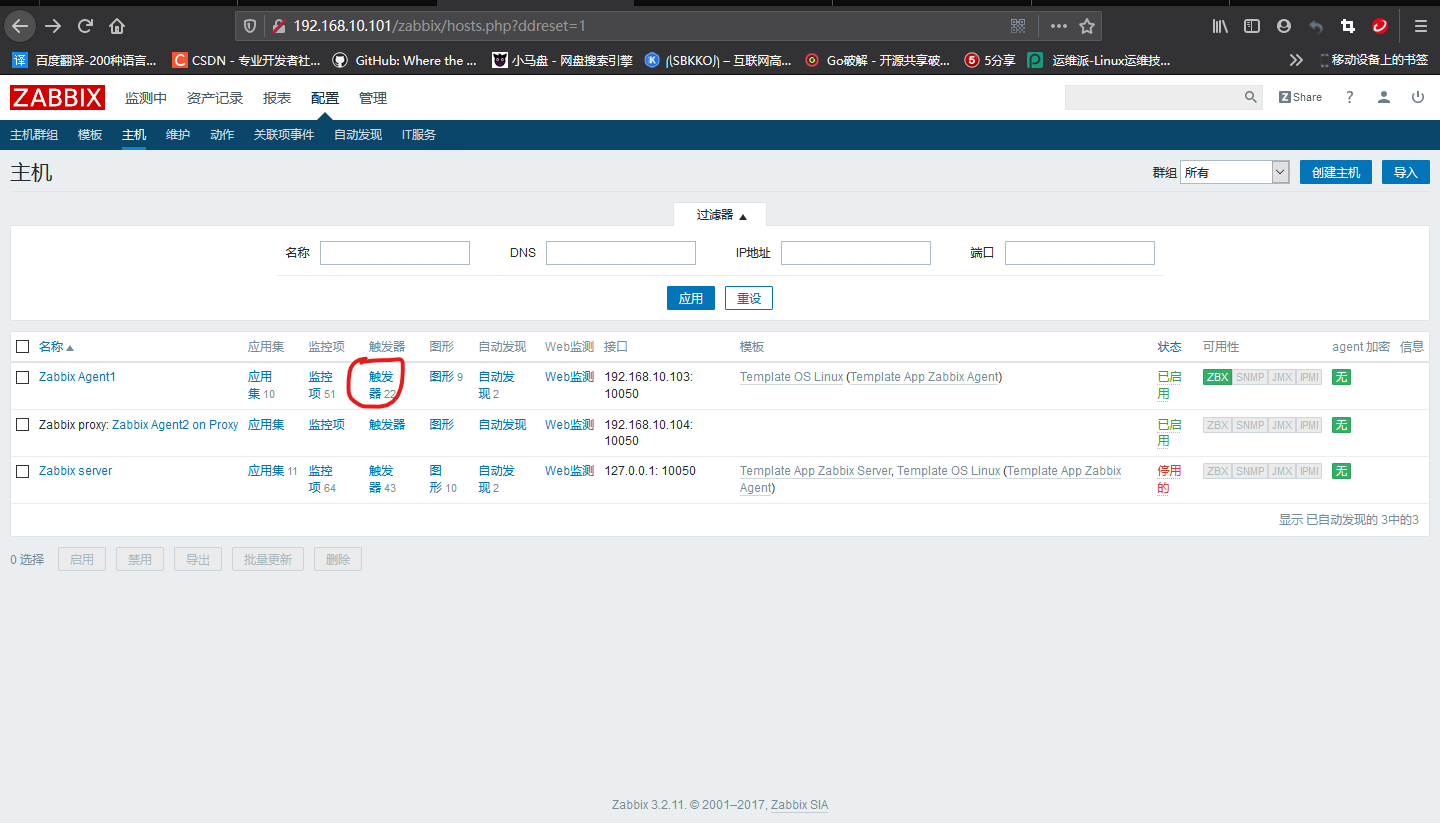

Web Monitoring
Click "configuration" - "host" in turn, and click "Web monitoring" - "create web scenario" on the column of host to be configured, as shown in the following figure.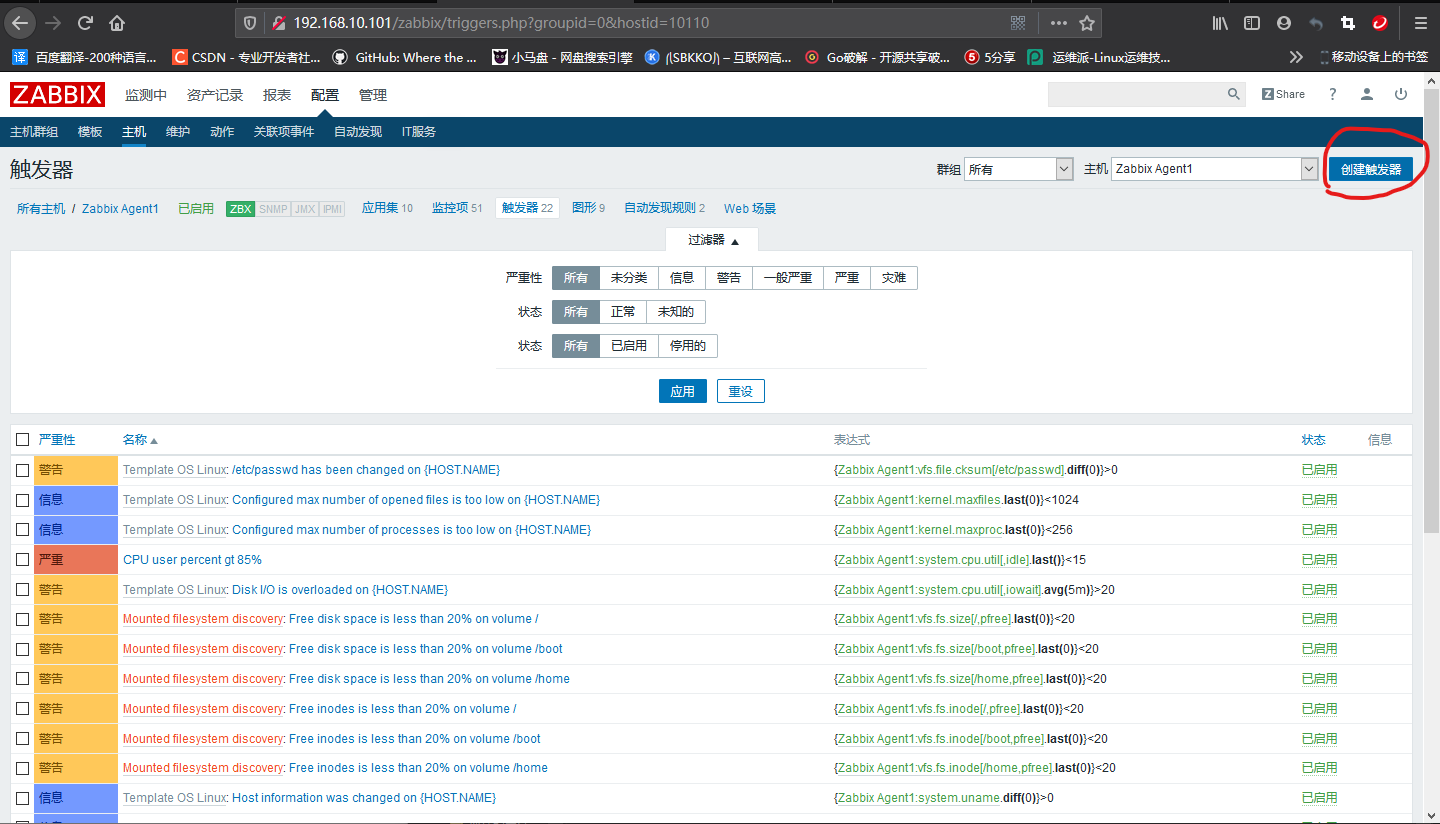
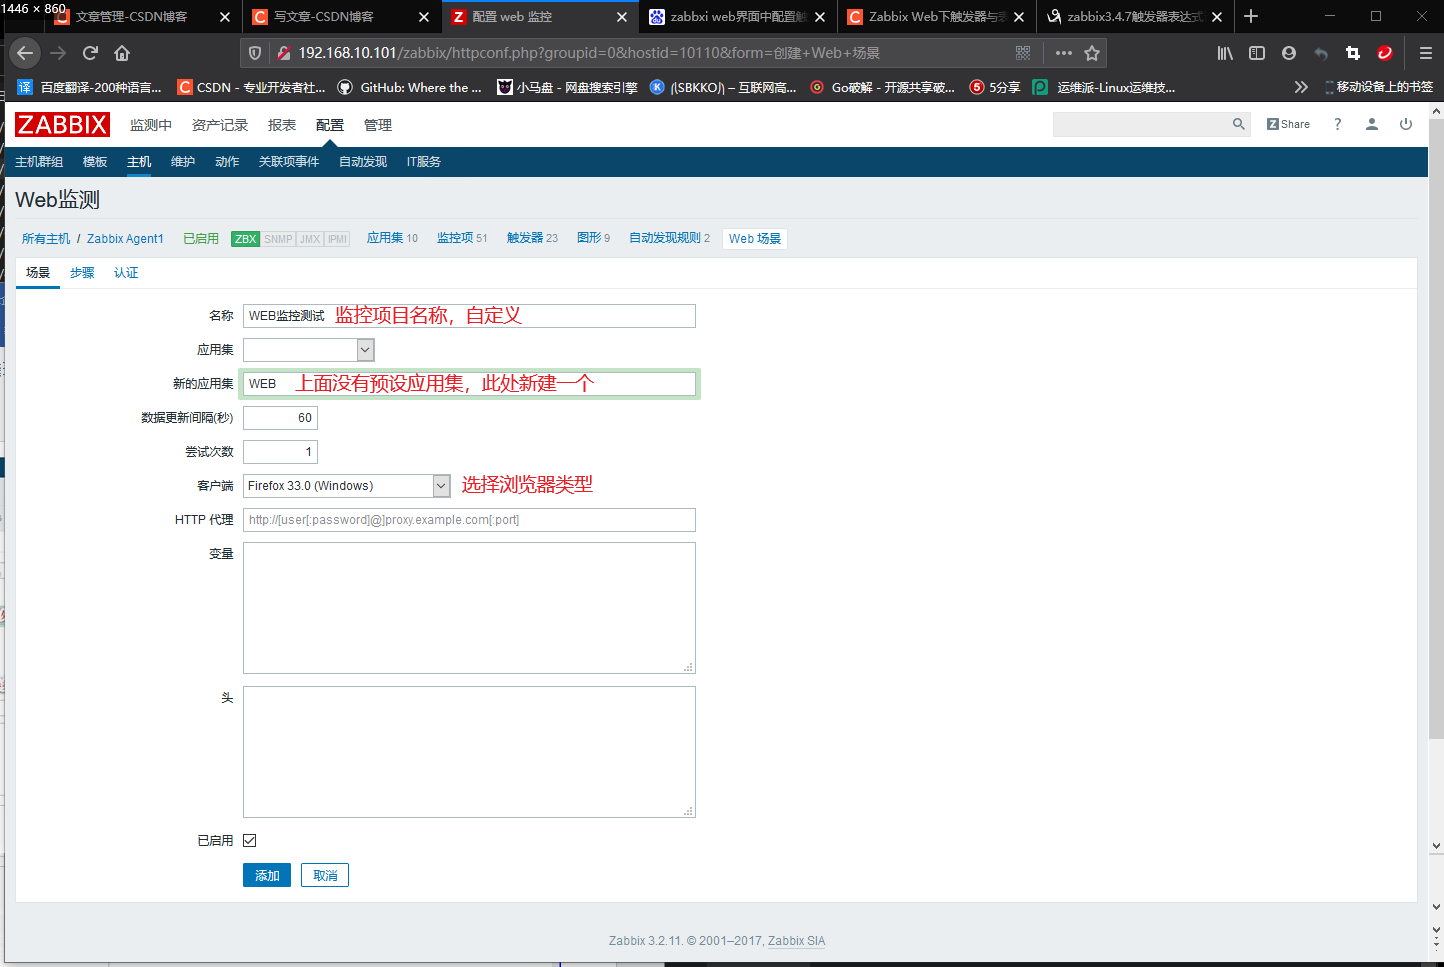
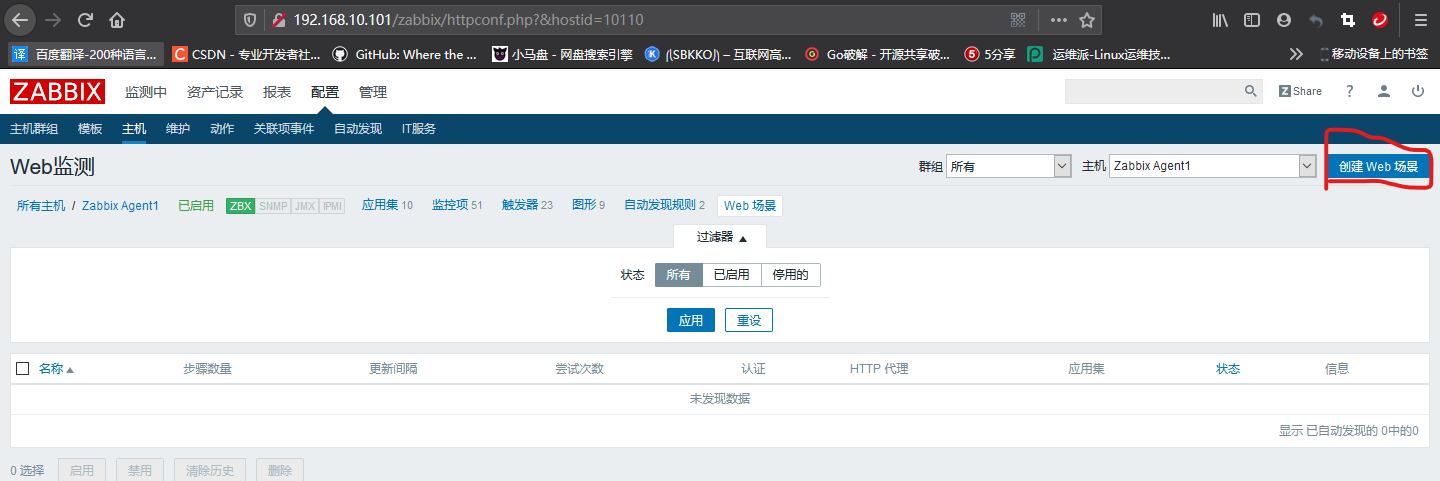 Fill in the information related to Web monitoring according to the instructions in the figure below.
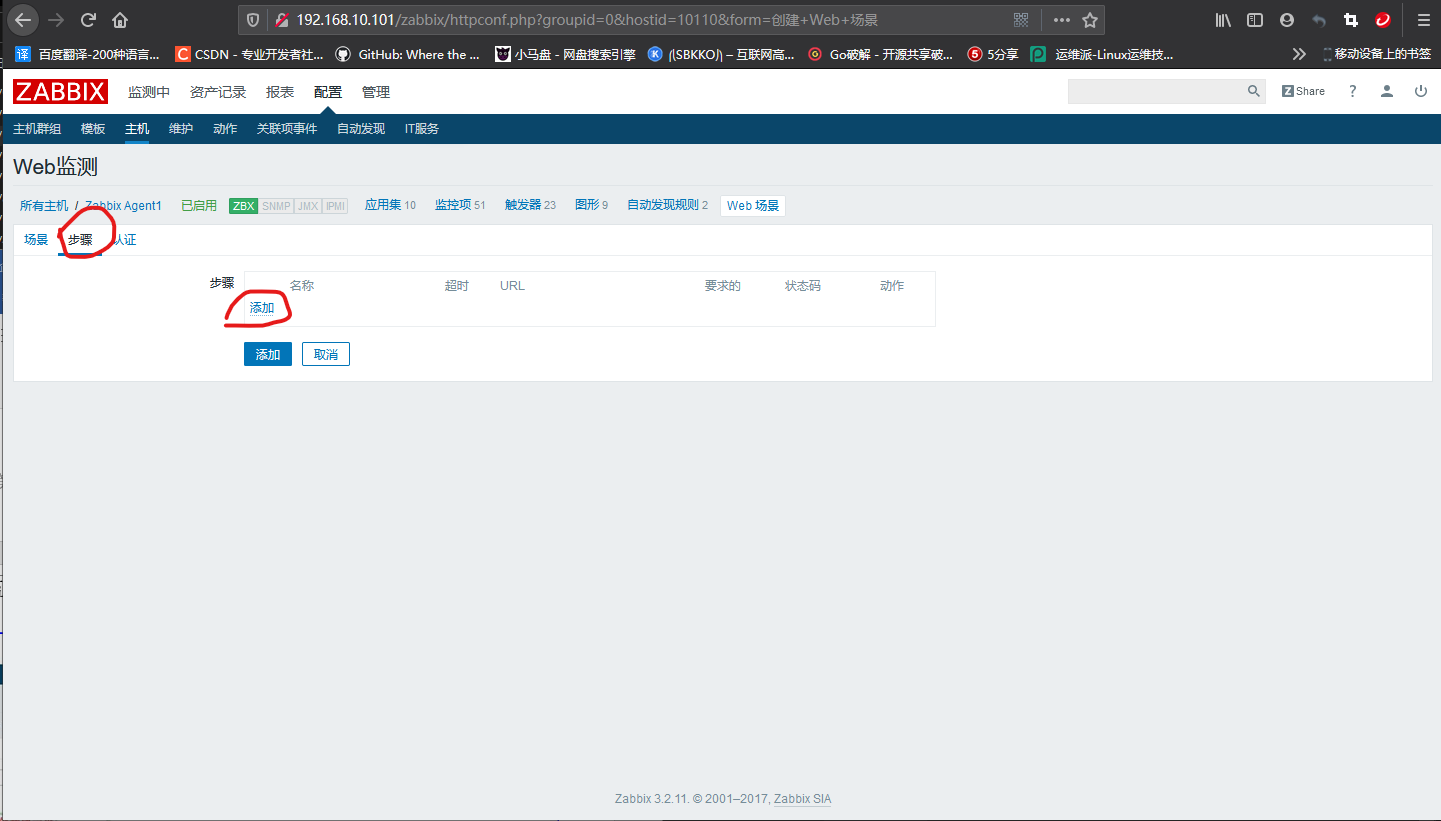
After filling in the basic information, click the "steps" tab to add specific monitoring items, as shown in the figure below.
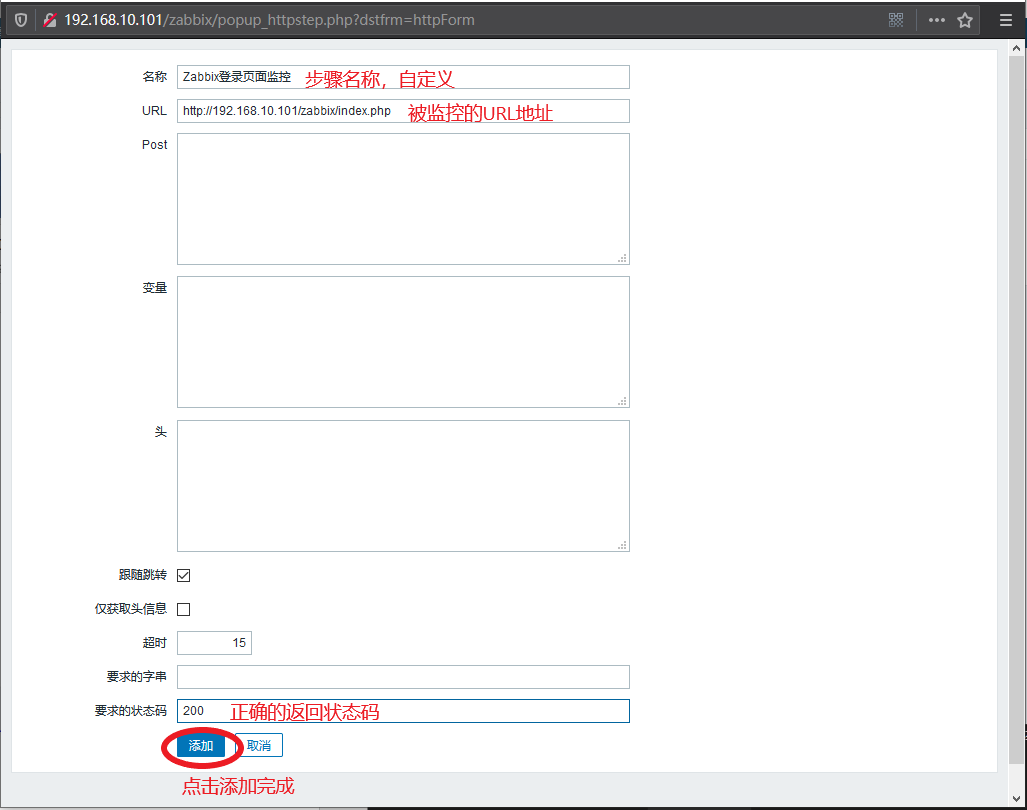
Fill in the Web monitoring project information according to the instructions in the figure below.
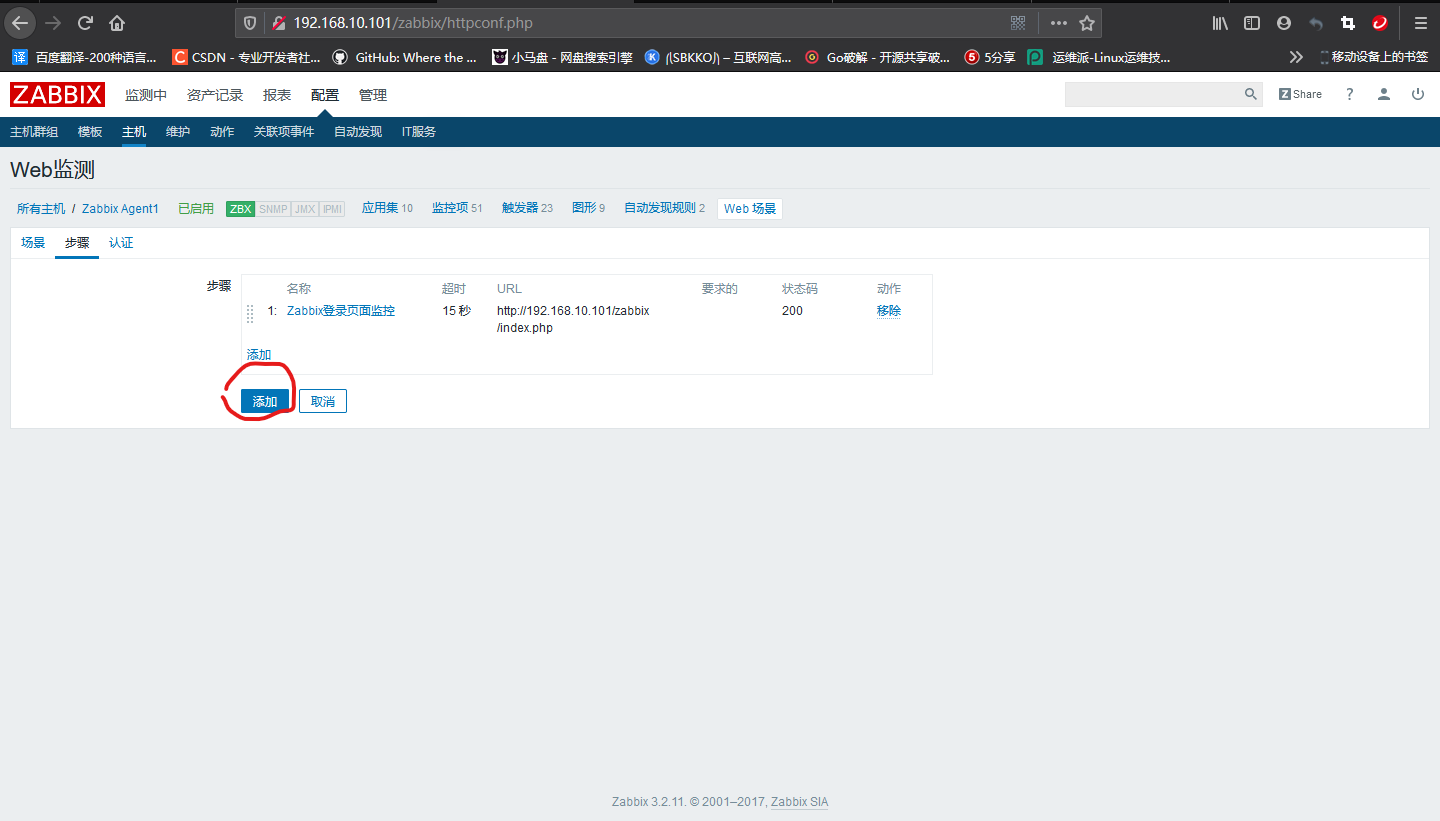
After the above configuration, click the "add" button to complete the operation, as shown in the figure below.
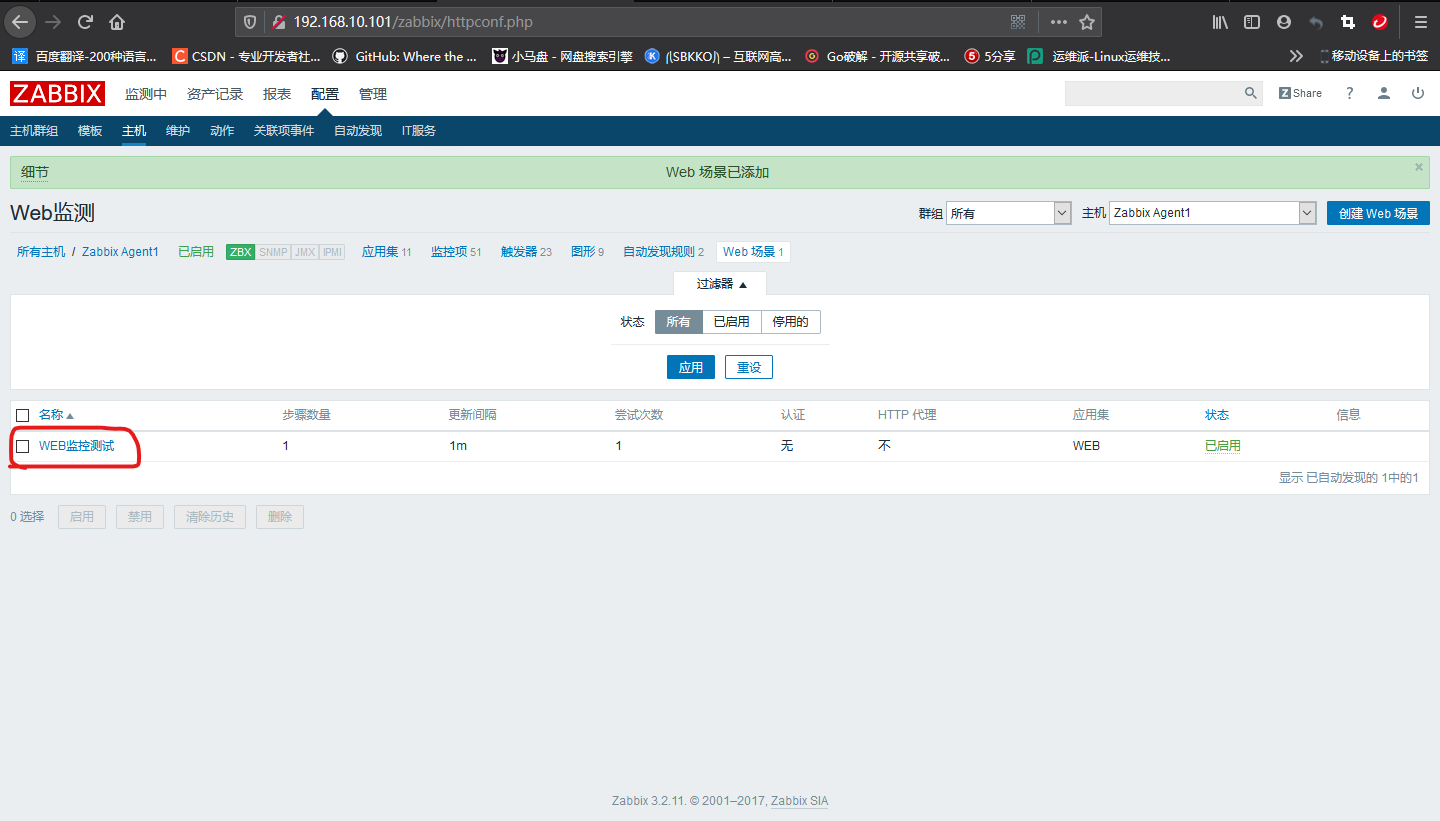
After creation, you can see the item "Web monitoring test" in the web monitoring list, as shown in the following figure.
Zabbix network topology configuration
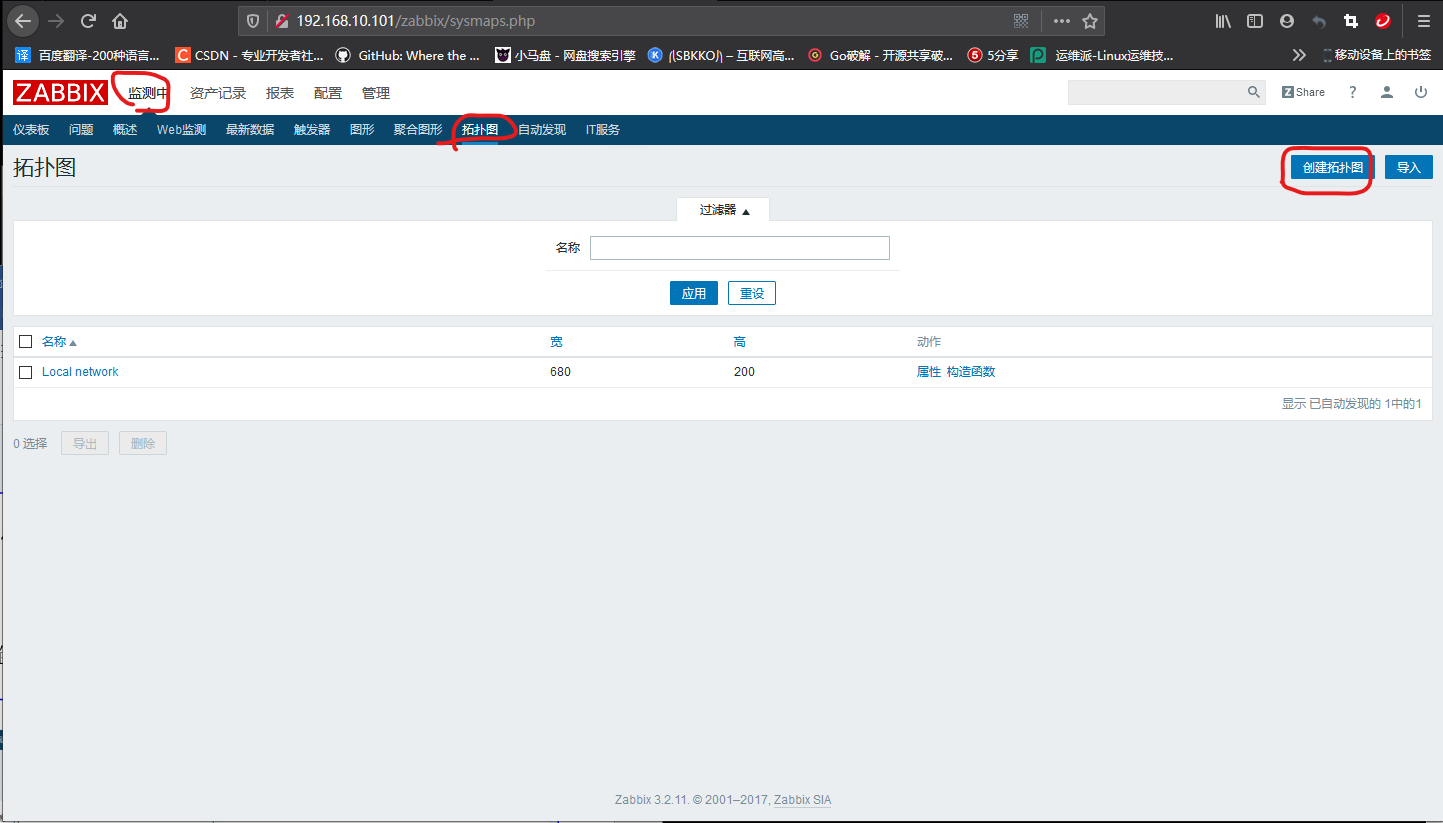
Click "monitoring" - "topology map" - "create topology map" in sequence, as shown in the following figure.
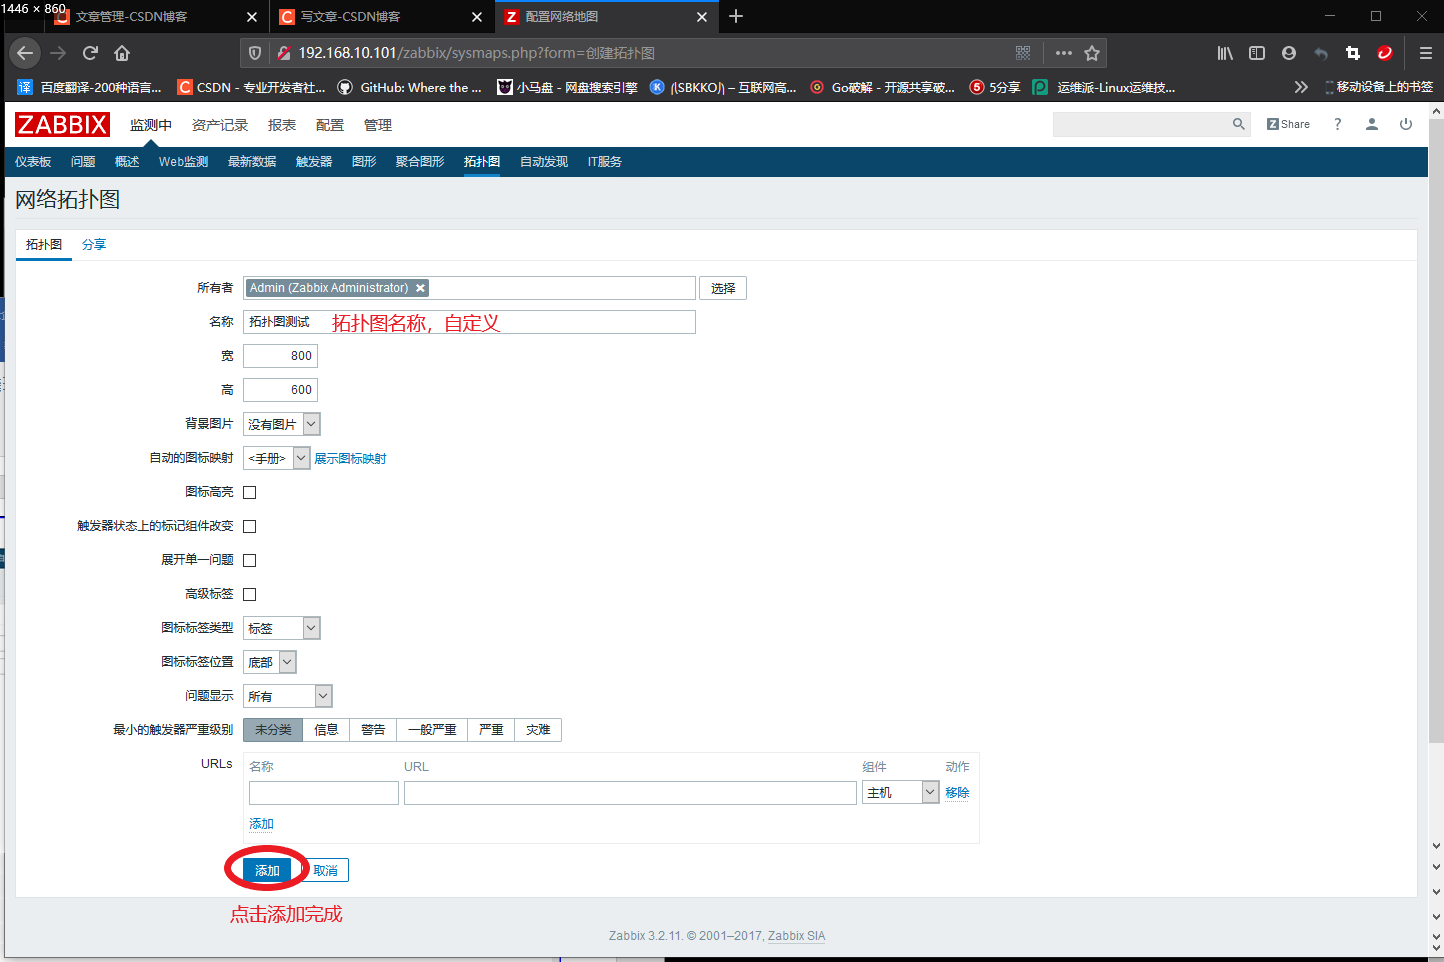
Name the topology map and click the "add" button to complete the creation of the topology map, as shown in the following figure.
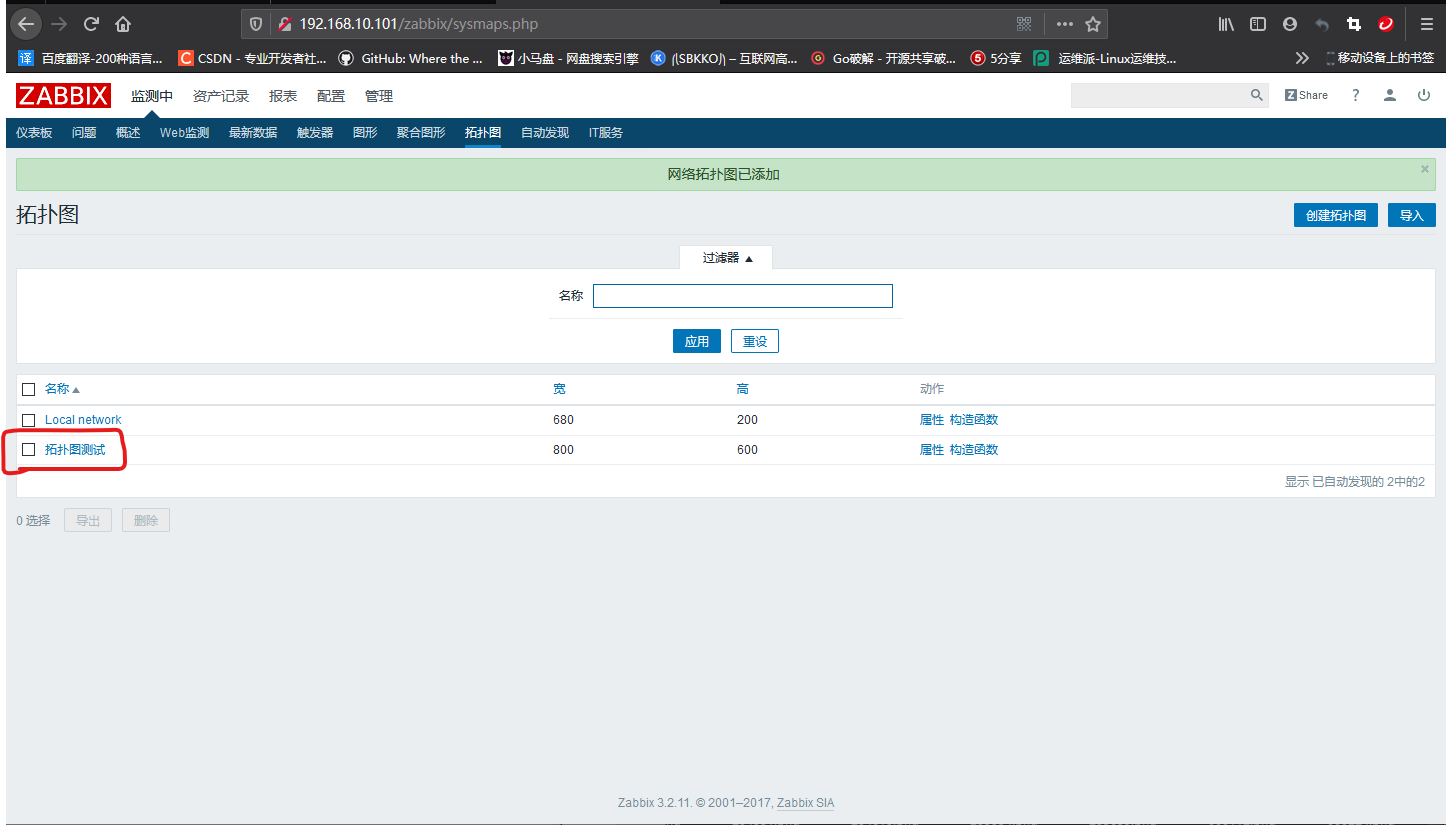
After creation, you can see the item "topology test" in the topology list, as shown in the following figure.
Click "topology test" and click "Edit topology" to enter the editing page, as shown in the figure below.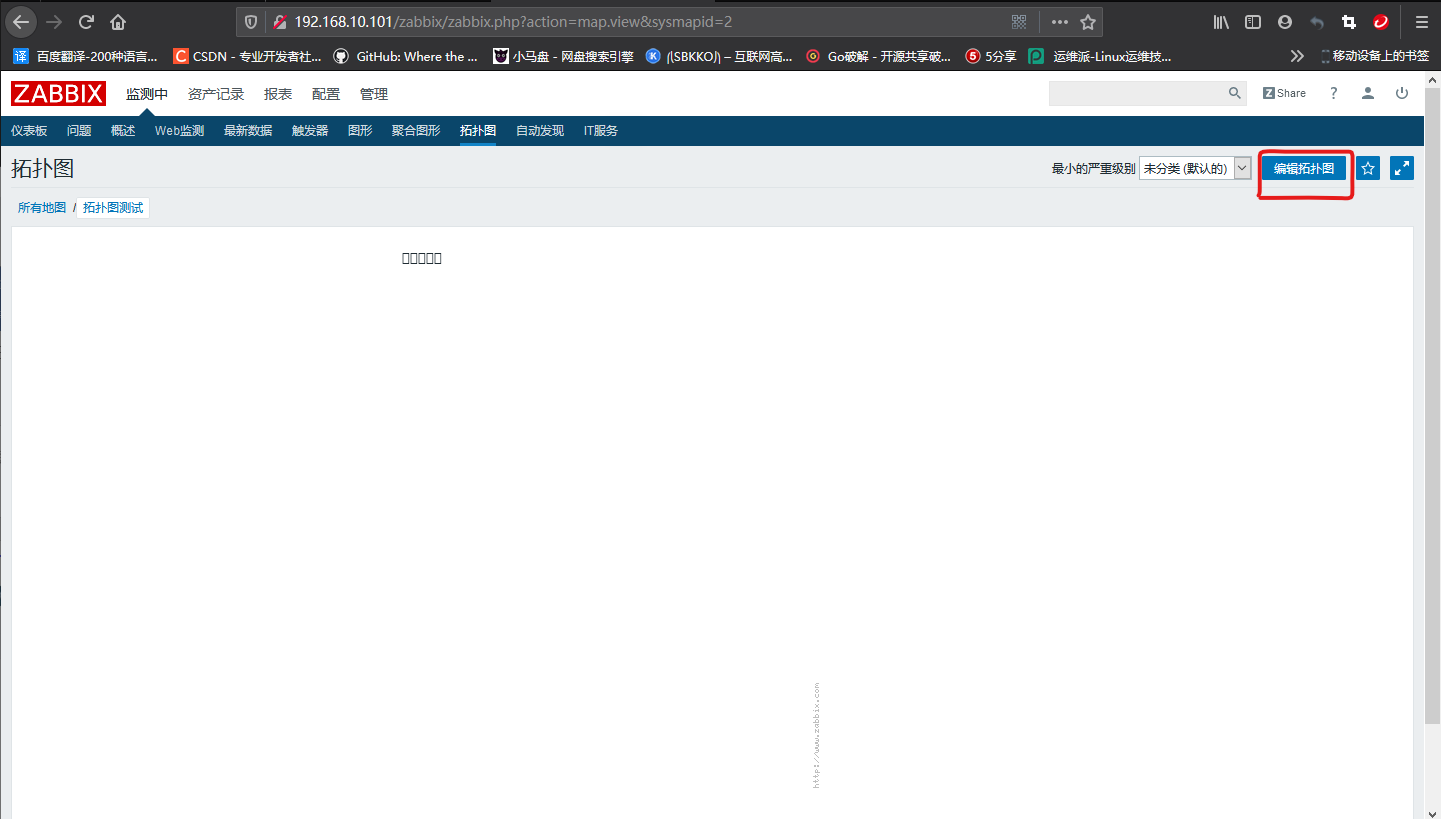
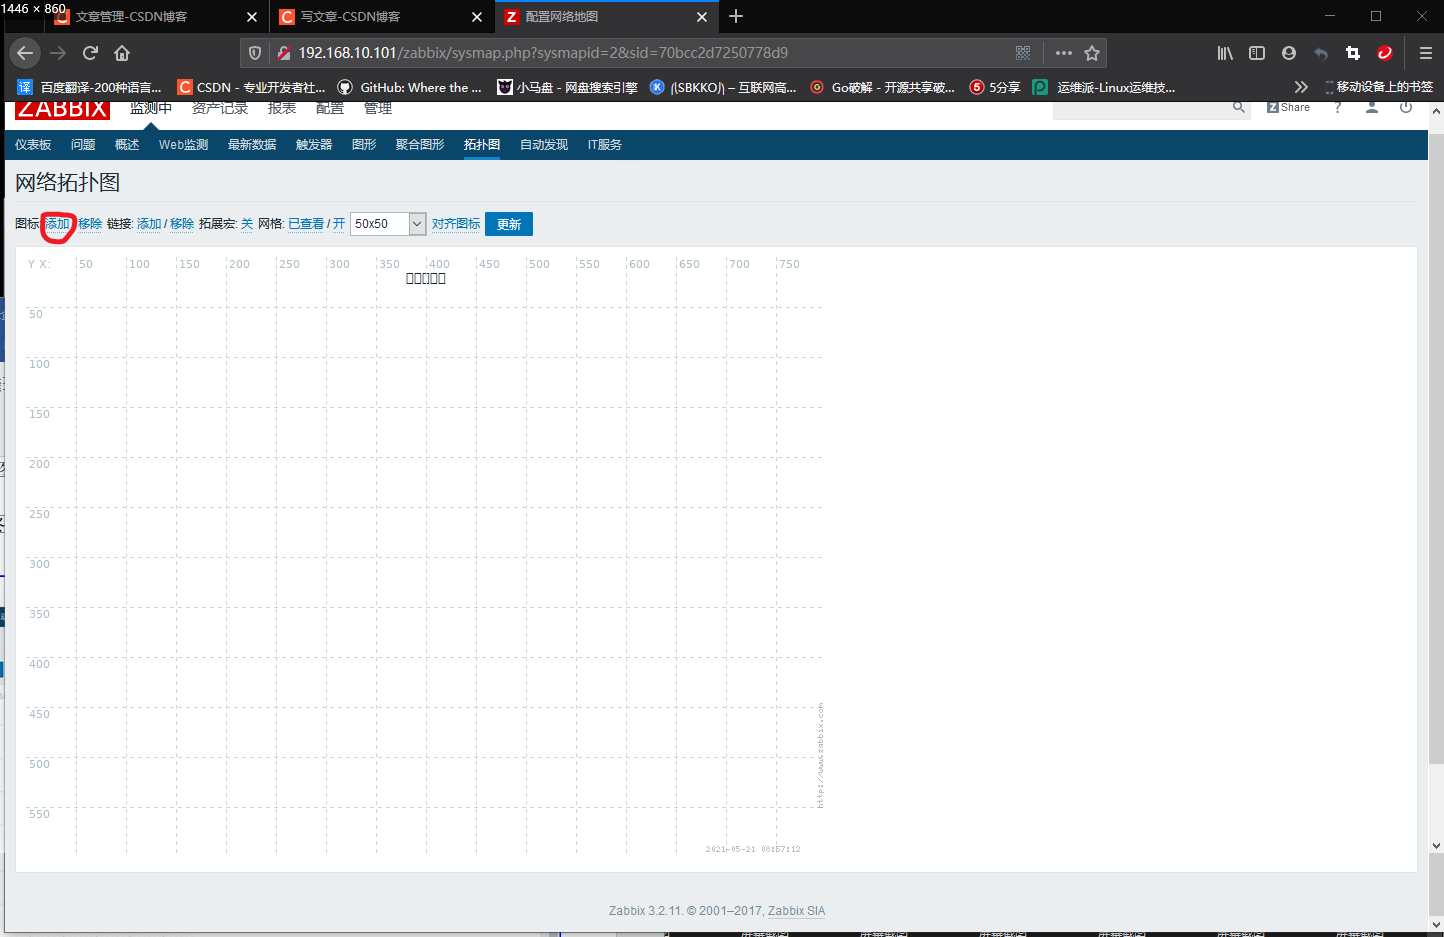
Click the "add" button on the far left to add an icon to the topology diagram, as shown in the figure below.
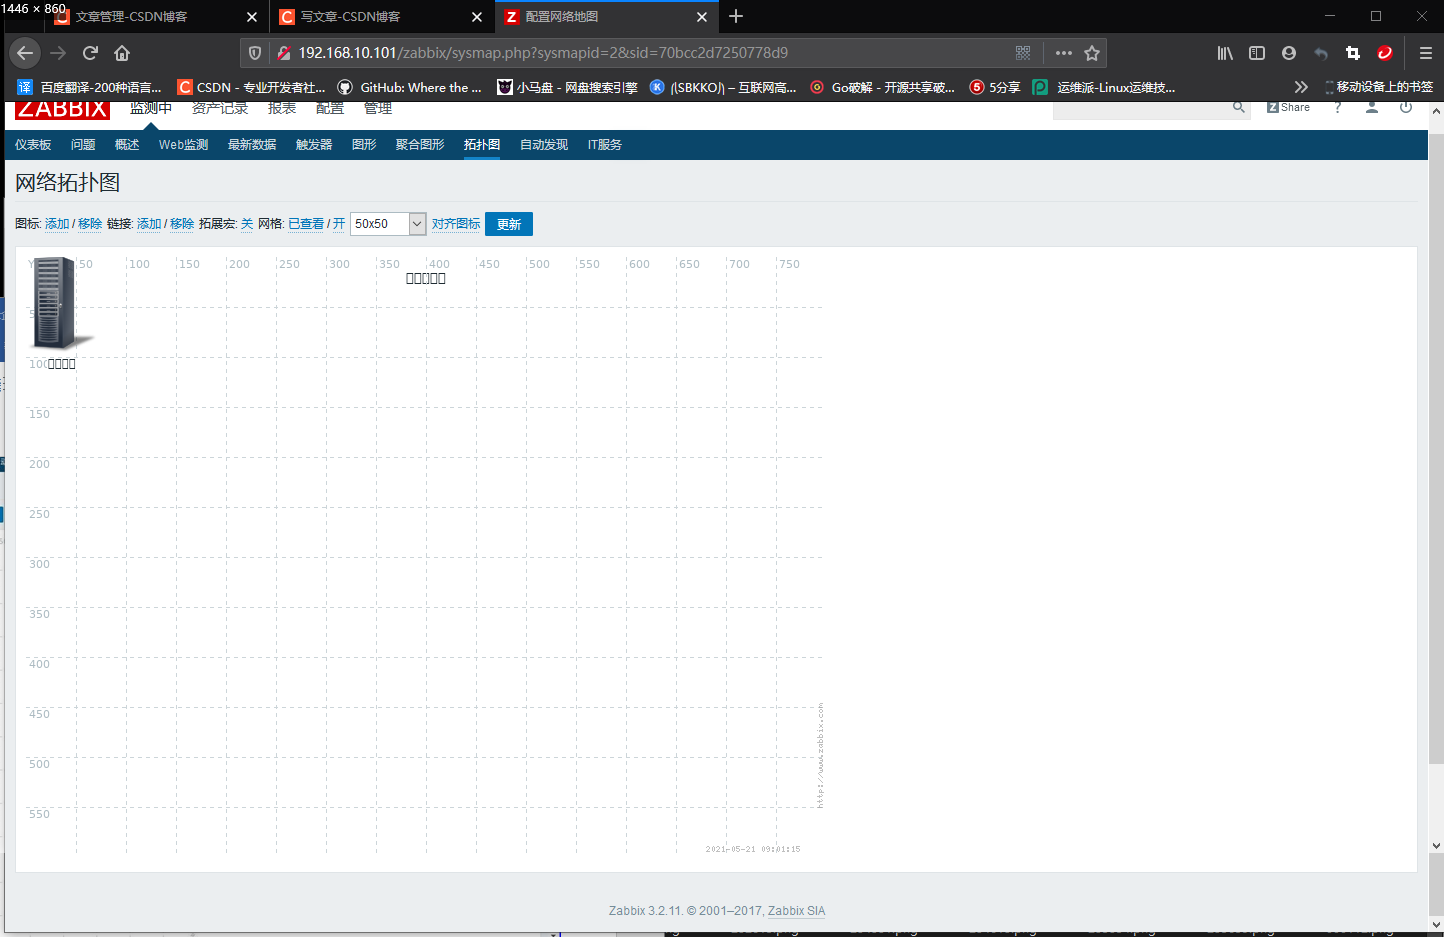
After adding, a host icon will appear on the drawing board. Users can drag it to adjust its position, or click "remove" to delete the icon, as shown in the figure below.
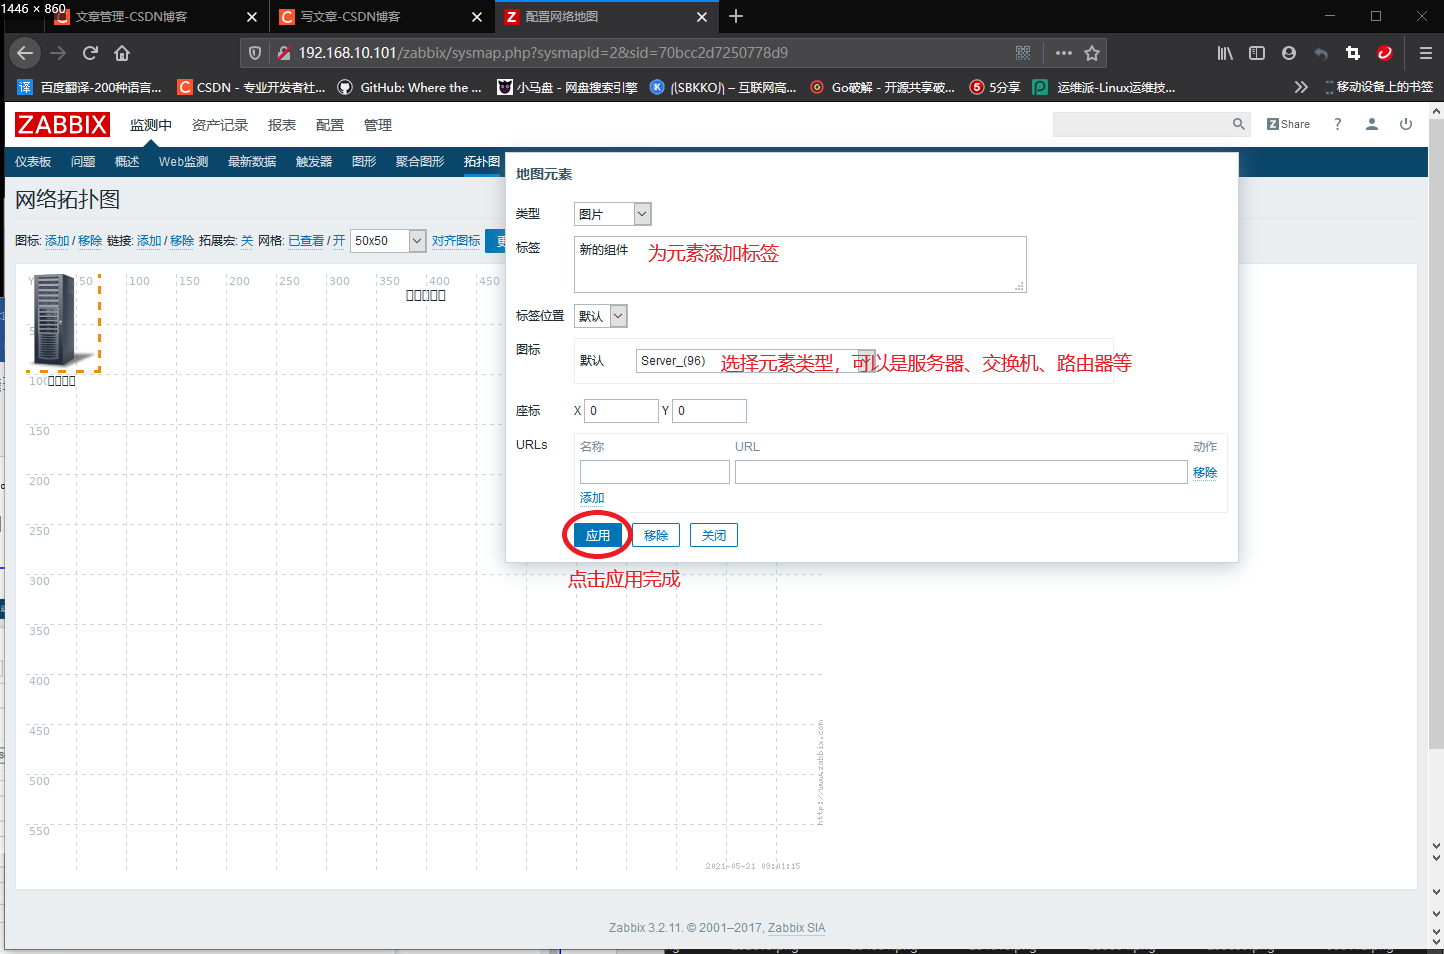
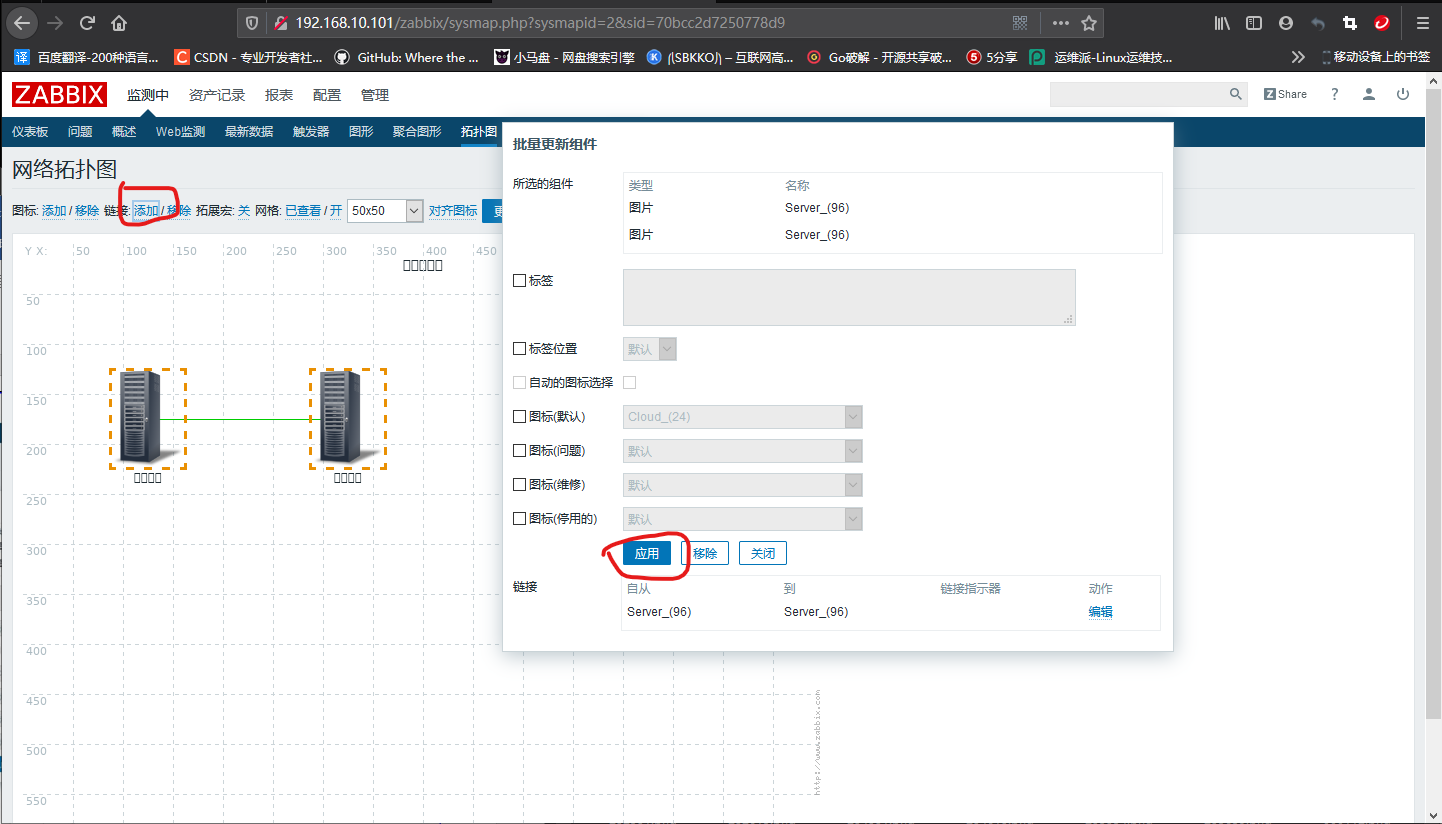
Click the host icon to pop up the icon editing box. Here, you can add labels to the chart and change the icon style. After editing, click the "apply" button to take effect, as shown in the figure below.
Add several icons in sequence as described above, as shown in the figure below. Select any two icons and click the second "add" to establish a connection line for the two icons.
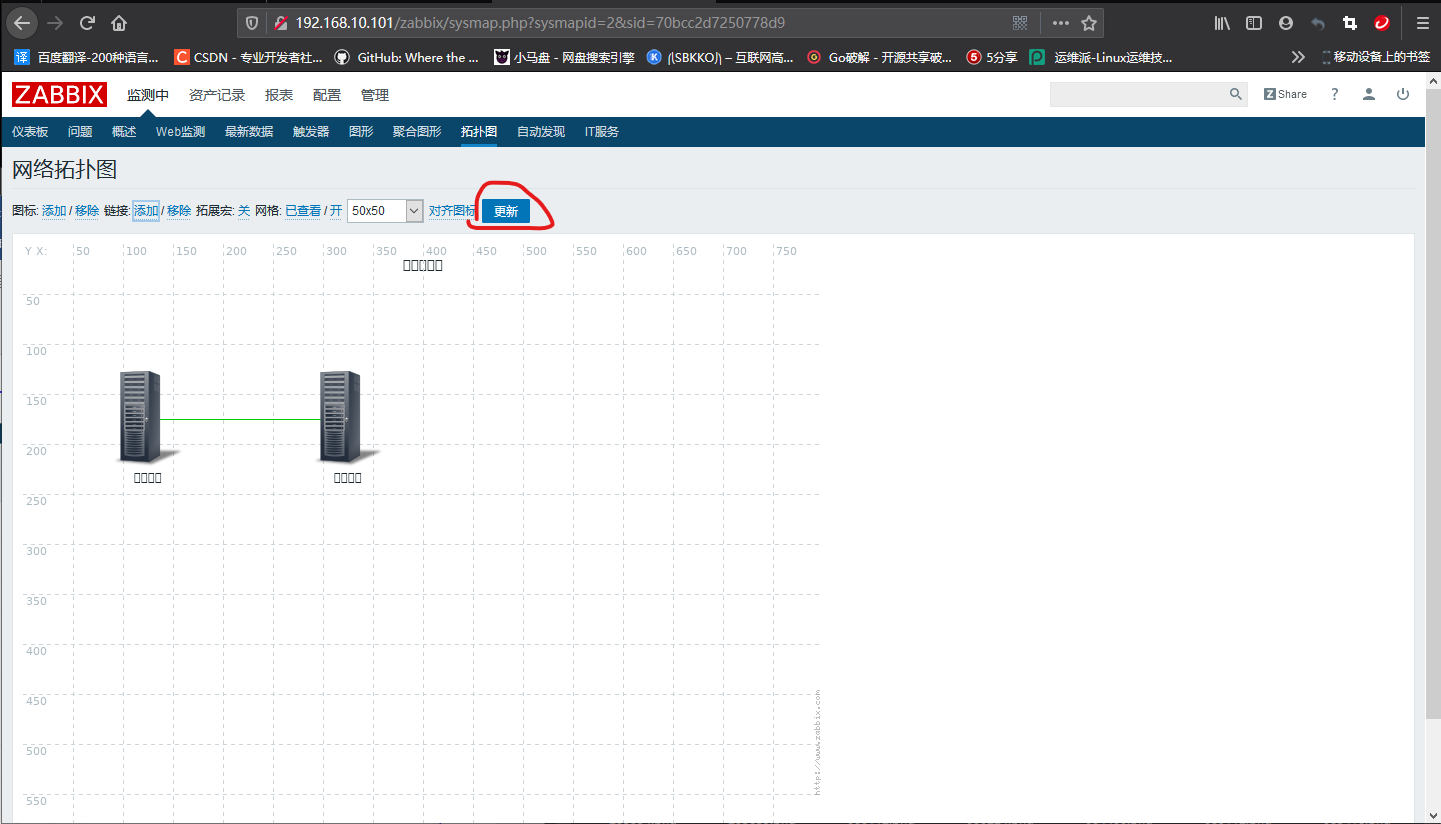
Connect the icons in the drawing board in the above way to form a complete topology. Click the "update" button to complete the editing, as shown in the figure below.
So far, the installation, deployment and basic function configuration of Zabbix system have been completed. Other more technical contents will be further explained in later chapters.