catalogue
2.1 image of implicit function H
2.2 image of implicit function M
1. Problem description
The known conditions are as follows:
① Implicit function H(x,y1)= exp(2*x-y1)*log(x-3*y1)-4 = 0
② Implicit function M(x,y2)= log(2*x-y2)/exp(x-2*y2)+3 = 0
Existing function y= C(y1,y2) = exp(1-y1*y2), find the function image of Y and x in the coordinate axis range x ∈ [2,10], y ∈ [0,25]
2. Function image
We use the official function of matlab fimplicit Draw images of implicit functions H and M.
The fimplicit function takes two parameters, one is the anonymous function, and the other is the coordinate axis range.
2.1 image of implicit function H
figure
H = @(x,y) exp(2*x-y)*log(x-3*y)-4;
bound = [2,10,0,25];
h = fimplicit(H, bound);
title('Implicit function H')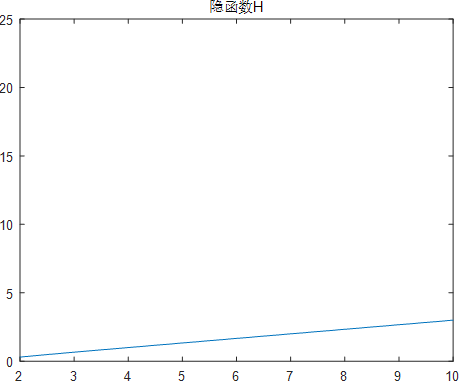
2.2 image of implicit function M
%% Draw implicit function M
figure
M = @(x,y) log(2*x-y)/exp(x-2*y)+3;
bound = [2,10,0,25];
m = fimplicit(M, bound);
title('Implicit function M') 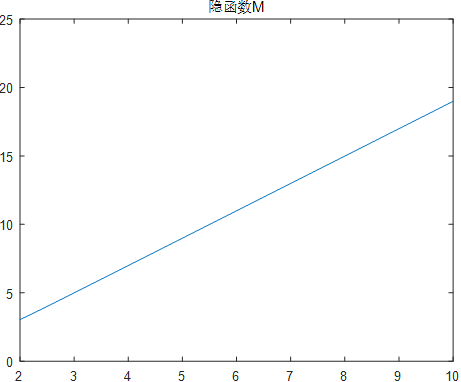
3. Solutions
3.1 preliminary ideas
- For the image of implicit function H(x1,y1), a set of one-to-one corresponding vectors X1 and y1 can be obtained. Similarly, for implicit function M(x2,y2), a set of one-to-one corresponding vectors x2 and y2 can also be obtained;
- If x1 and x2 here fit perfectly, that is, x1 vectors and x2 vectors are completely consistent. You can use X to represent x1 and x2, so you only need to substitute Y1 vectors and Y2 vectors into the function expression y= C(y1,y2) = exp(1-y1*y2), calculate the Y vector, and use plot(x, y) to obtain the objective function image.
3.2 actual situation
For the implicit function h, the function fimplicit not only draws the image of the implicit function h on the bound, but also returns the image window. Here, h is used to receive the returned image window
h = fimplicit(H, bound);
Viewing the h variable in the workspace, you can find that it has sub attributes XData and YData, which respectively correspond to the abscissa and ordinate of each point on the image.
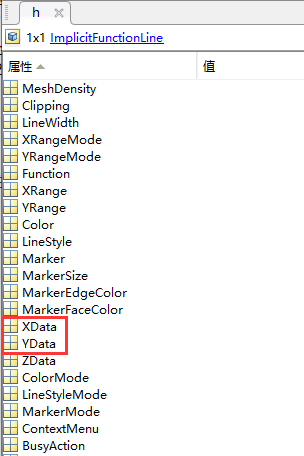
Therefore, using the return value of fimplicit, the x and y vectors of the images of implicit functions H and M can be obtained
%% Get implicit function H of x1,y1 vector
x1 = h.XData;
y1 = h.YData;
%% Get implicit function M of x2,y2 vector
x2 = m.XData;
y2 = m.YData;
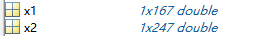
Unfortunately, x1 and x2 are not completely consistent (the requirement for complete consistency is that the lengths of x1 and x2 need to be the same first, and then the two vectors are subtracted into a 0 vector).
3.3 solutions
In this case, we can consider interpolating the image of H, artificially select the vector x = [x1, X2,..., xn], and obtain the corresponding yp1; Similarly, the vector x = [x1, X2,..., xn] is also used to interpolate the image of M to obtain its corresponding yp2, so as to establish the mapping relationship between X and yp1, X and yp2.
%% set up x Interpolation points, right y1 and y2 Interpolate
x = 2:0.5:10;             %set up x Interpolation points
yp1 = interp1(x1, y1, x); %use x yes y1 Obtained by re interpolation yp1
yp2 = interp1(x2, y2, x); %use x yes y2 Obtained by re interpolation yp2
Further, by y= C(y1,y2) = exp(1-y1*y2), the mapping relationship between x and y can be obtained, so as to draw the target image.
%% Calculation and drawing
y = exp(1-yp1.*yp2);
figure
plot(x, y), title('x and y Image of')
4. Complete code
clear, close all
%% Draw implicit function H
figure
H = @(x,y) exp(2*x-y)*log(x-3*y)-4;
bound = [2,10,0,25];
h = fimplicit(H, bound);
title('Implicit function H')
%% Draw implicit function M
figure
M = @(x,y) log(2*x-y)/exp(x-2*y)+3;
bound = [2,10,0,25];
m = fimplicit(M, bound);
title('Implicit function M')
%% Get implicit function H of x1,y1 vector
x1 = h.XData;
y1 = h.YData;
%% Get implicit function M of x2,y2 vector
x2 = m.XData;
y2 = m.YData;
%% set up x Interpolation points, right y1 and y2 Interpolate
x = 2:0.5:10;             %set up x Interpolation points
yp1 = interp1(x1, y1, x); %use x yes y1 Obtained by re interpolation yp1
yp2 = interp1(x2, y2, x); %use x yes y2 Obtained by re interpolation yp2
%% Calculation and drawing
y = exp(1-yp1.*yp2);
figure
plot(x, y), title('x and y Image of')
5. Exchange and discussion