1. Background
The Proxy service is responsible for consuming and parsing CKafka messages, and distributing messages to different CKafka topic s. Recently, it was found that the Proxy service consumption CKafka has message accumulation, and the CVM CPU and memory resources where the service is located only occupy about 50%.
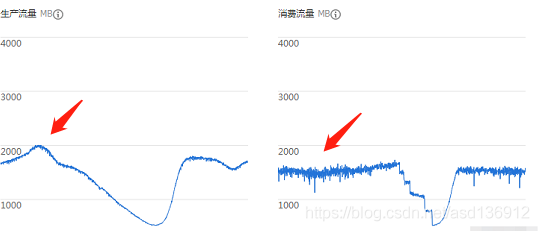
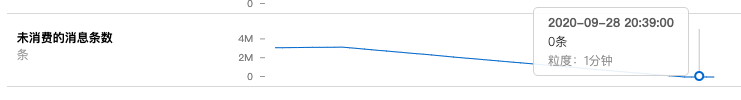
As shown in the figure, when the data volume is peak, the production traffic can reach 2000MB / h, but the consumption traffic can not reach so much, indicating that the service has message accumulation.
Other notes: the number of CKafka partition s is exactly one-to-one with the number of service instances. The consumption Client Concurrence of CKafka is set to 1. The Proxy service maintains a thread pool for parsing and distributing each message consumed. Every time a message enters the service, each message will be parsed by a thread and send data.
    @KafkaListener(topics = "topic")
    public void consumerKafkaMsg(List<ConsumerRecord<?, String>> records) throws Exception {
        for (ConsumerRecord<?, String> record : records) {
            log.debug("kafka topic = {}, value:\n{}", record.topic(), record.value());
            service.handleMsg(record);
        }
    }
@PostConstruct
public void init() {
BlockingQueue<Runnable> workingQueue = new ArrayBlockingQueue<Runnable>(consumerCount);
RejectedExecutionHandler rejectedExecutionHandler = new ThreadPoolExecutor.CallerRunsPolicy();
ThreadFactory namedThreadFactory = new ThreadFactoryBuilder().setNameFormat("kafka-consumer-%d").build();
threadPool = new ThreadPoolExecutor(consumerCount, consumerCount, 0L, TimeUnit.MILLISECONDS,
workingQueue, namedThreadFactory, rejectedExecutionHandler);
}
public void handleMsg(ConsumerRecord<?, String> record) {
threadPool.execute(new ThreadPoolTask(recorde));
}2. Problem analysis
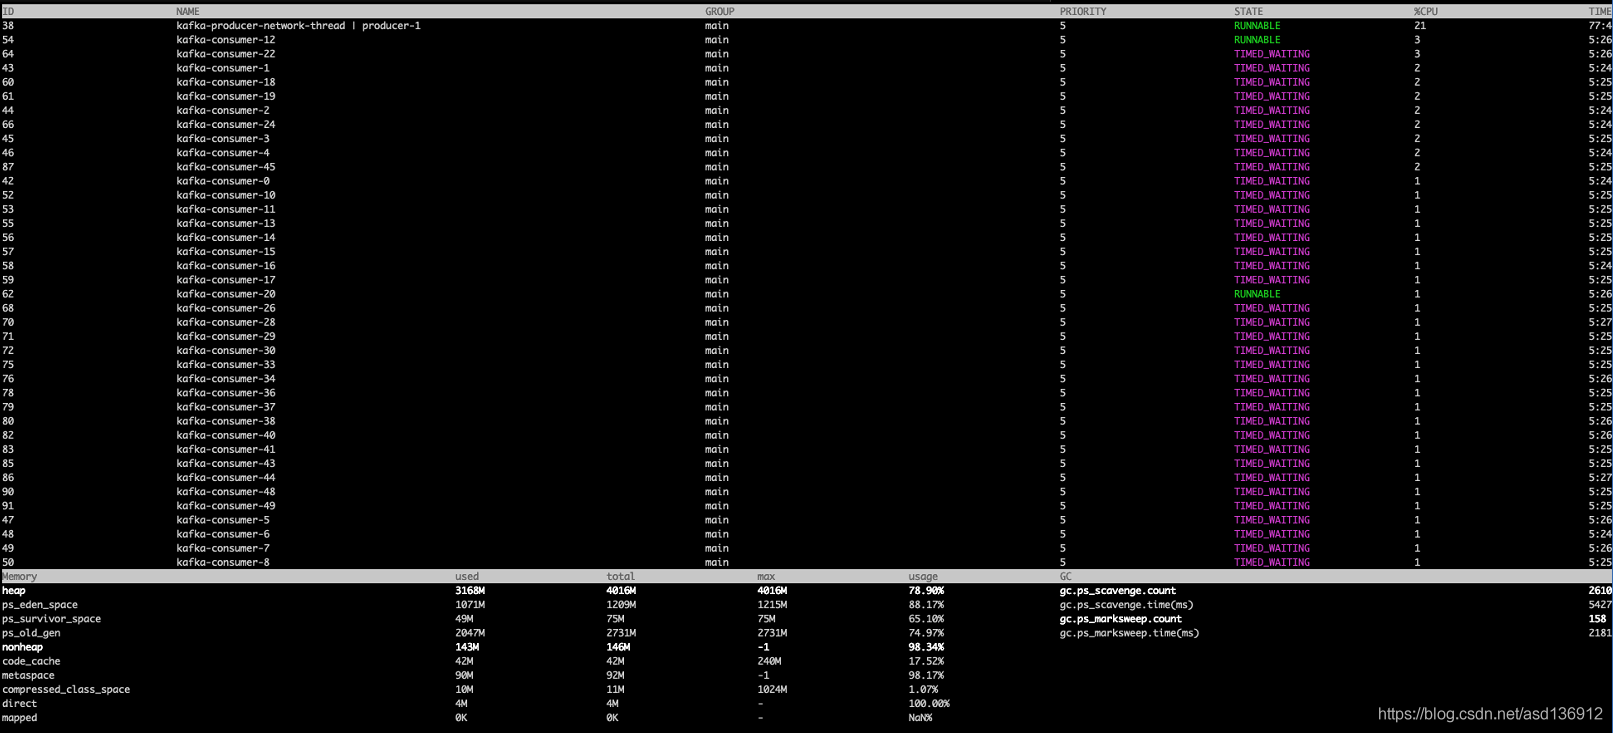
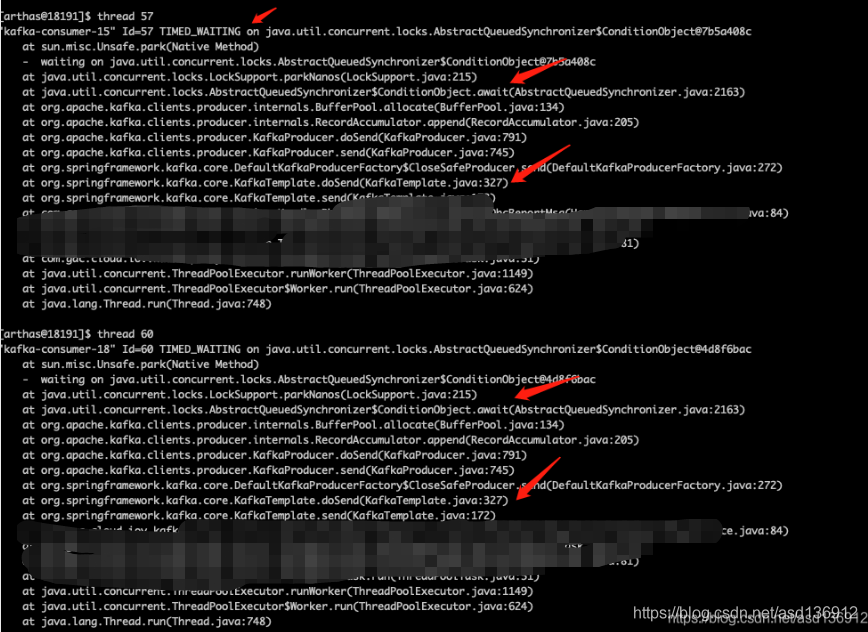
Use the Arthas tool to analyze the stack. As shown in the figure below, you can see that each thread is timed_ In the waiting state, the CPU consumption is also very low. It is preliminarily judged that the consumption accumulation is not due to the insufficient number of threads, but is stuck in IO.
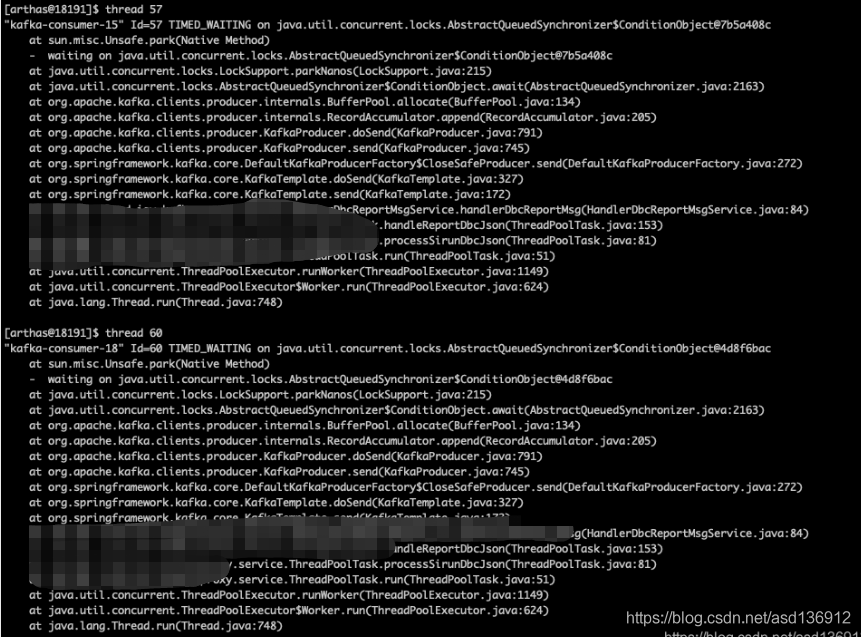
Viewing the thread status, you can also see that each thread in the thread pool is waiting and stuck on the method dosent. It may be the current limit of the CKafka cluster.
3 try to solve
3.1 increase the queue length of message parsing and distribution thread pool
It can be seen in code 2 above that the queue length of the thread pool is consistent with the number of threads, because the strategy of the thread pool is that when the number of threads reaches the maximum of the queue, the main thread will execute the thread job, resulting in the main thread not continuing to pull data, and there is no data after the execution of other threads. As shown in the above figure, wait for the main thread to pull data after completing the job.
After increasing the length of the thread pool queue, it is found that the thread state still does not change much and is still waiting for the main thread.
3.2 thread task tuning
The effect of method 1 is not very obvious. We can change our thinking. In code 1, each message will have a thread to execute the task. Because there are many messages, one thread for each message will be a little inefficient. You can try to put a batch of data into one thread to improve the CPU utilization of the thread, so as to solve the problem.
public void handleMsg(List<ConsumerRecord<?, String>> records) {
threadPool.execute(new ThreadPoolTask(records));
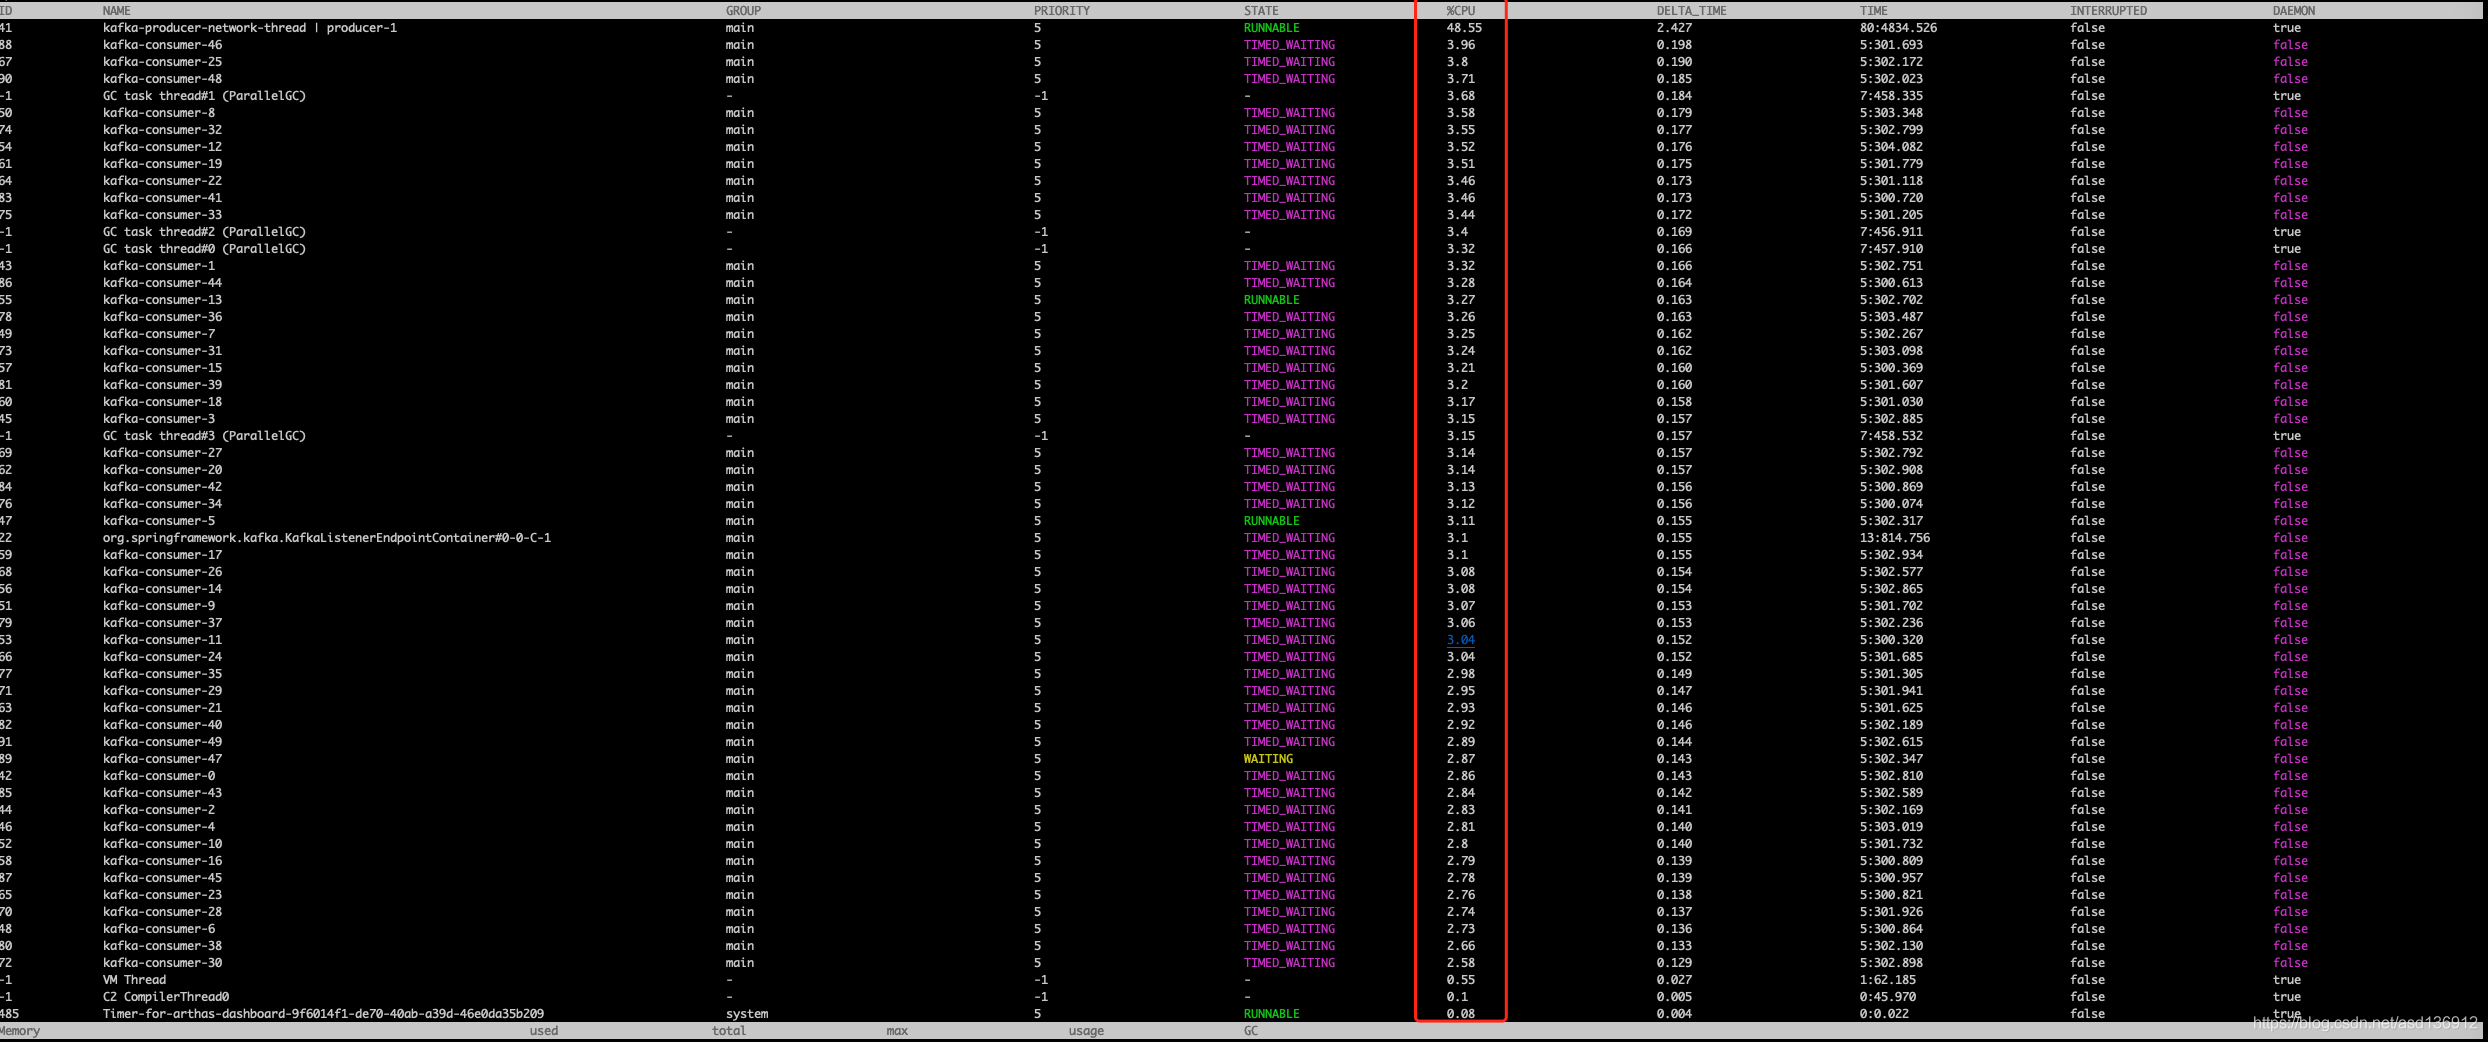
}After the modification, it is found that the thread CPU utilization increases significantly.
3.3 modification of ckafka producer parameters
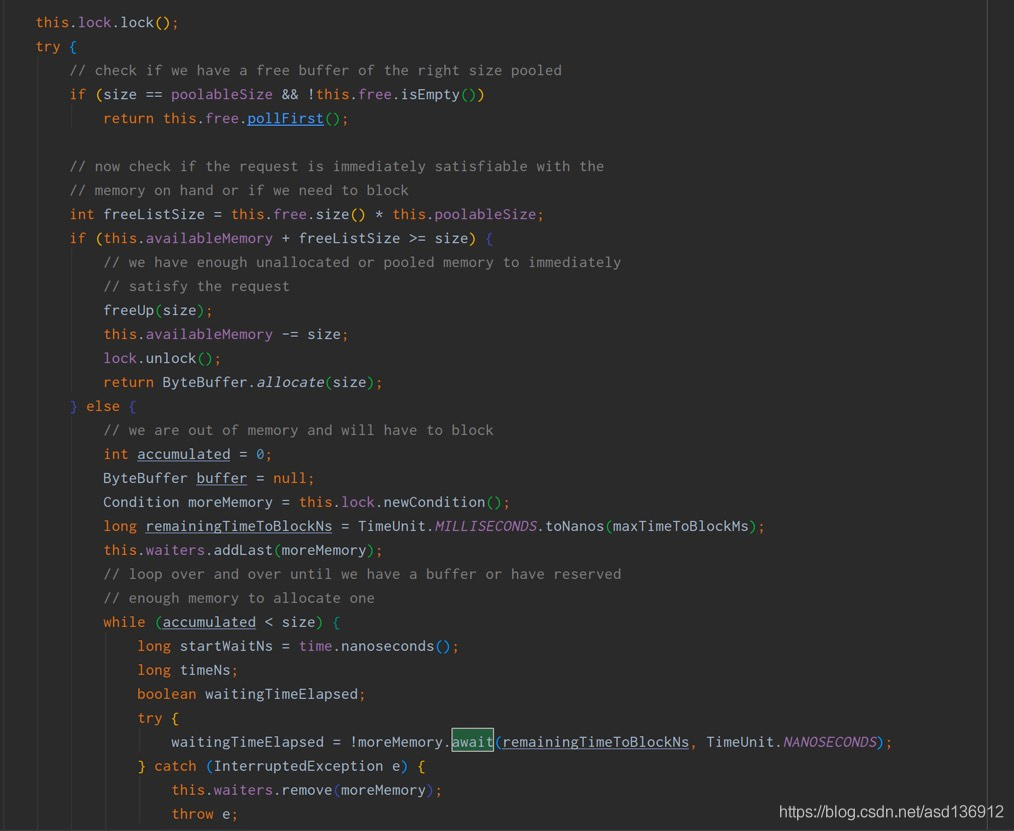
At the same time, recheck the status of each thread in Arthas. The thread is stuck in the dosent method in kafkaTemplate, and then up is awiat
Check the await method source code and find that it is actually waiting for batchSize. Because the batchSize is set to be large during pressure measurement, the data volume in the formal environment does not reach the large data volume of pressure measurement. However, this method has been waiting for the completion of batchSize filling, so the thread has been waiting for no Kafka message to be sent and stuck on dosent.
PS: there is also a lingerms parameter to control the sending. If the batchSIze or lingerms time reaches first, it will be sent. The default time for lingerms is 1 minute. Results and summary
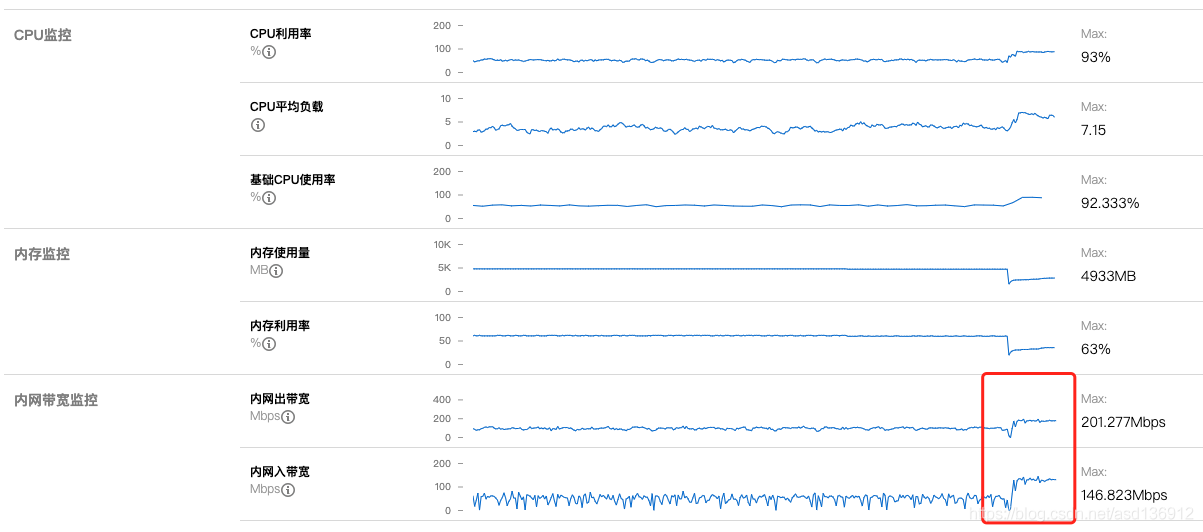
Tencent cloud monitoring still plays a great role and has great reference significance in the tuning process. Appropriate parameter adjustment is required for both Ckafka and components to play their maximum role
The effect is still obvious. You can see that the CPU load of the machine increases significantly, and the unused Kafka messages also decrease slowly, reaching the expectation.