1, Introduction to SVM
General framework of machine learning:
Training set = > extract feature vector = > combine with certain algorithms (classifiers: such as decision tree and KNN) = > get the result
1 SVM definition
support vector machines (SVM) is a binary classification model. It maps the feature vector of an instance to some points in space. The purpose of SVM is to draw a line to "best" Distinguish these two types of points, so that if there are new points in the future, this line can also make a good classification. SVM is suitable for small and medium-sized data samples, nonlinear and high-dimensional classification problems.
SVM was first developed by Vladimir N. Vapnik and Alexey ya Chervonenkis proposed it in 1963. The current version (soft margin) was proposed by Corinna Cortes and Vapnik in 1993 and published in 1995. Before the emergence of deep learning (2012), SVM was considered as the most successful and best performing algorithm in machine learning in recent ten years.
2 basic concepts of SVM
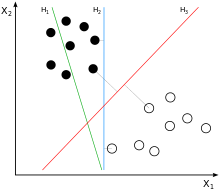
The feature vector of the instance (taking two-dimensional as an example) is mapped to some points in the space, such as solid points and hollow points in the figure below, which belong to two different categories. The purpose of SVM is to draw a line to "best" distinguish the two types of points, so that if there are new points in the future, the line can also be well classified.
Q1: how many lines can be drawn to distinguish sample points?
A: there are countless lines that can be drawn. The difference is whether the effect is good or not. Each line can be called a divided hyperplane. For example, the green line above is not good, the blue line is OK, and the red line looks better. The best line we want to find is the partition hyperplane with maximum spacing.
Q2: why is it called "hyperplane"?
A: because the characteristics of the sample are likely to be high-dimensional, the division of the sample space is not a line.
Q3: what is the standard for drawing lines/ What makes this line work well/ What's good?
A: SVM will look for a partition hyperplane that can distinguish two categories and maximize the margin. A better partition hyperplane has the least impact on it when the sample is locally disturbed, the most robust classification result, and the strongest generalization ability for no examples.
Q4: what is the margin?
A: for any hyperplane, The data points on both sides have a minimum distance (vertical distance) from it, and the sum of the two minimum distances is the interval. For example, the banded area composed of two dotted lines in the figure below is margin, and the dotted line is determined by the two points closest to the central solid line (that is, it is determined by the support vector). However, the margin is relatively small at this time. If we draw it in the second way, the margin will obviously become larger and closer to our goal.

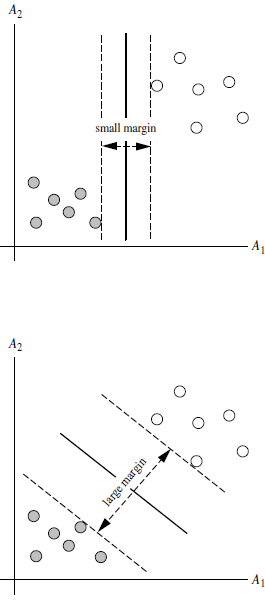
Q5: why make margin as large as possible?
A: because the big margin is less likely to make mistakes, that is, it is more robust.
Q6: what is support vector?
A: as can be seen from the above figure, the distance between the points on the dotted line and the divided hyperplane is the same. In fact, only these points jointly determine the location of the hyperplane, so they are called "support vectors" and "support vector machine" comes from it.
2, Partial source code
%% Clear environment variables
close all;
clear all;
clc;
format compact;
%% Data extraction and preprocessing
data=xlsread('Filtered data');
ts = data((1:320),1);%Training set output
tsx = data((1:320),2:end);%Training set input
tts=data((321:end),1);%Prediction set output
ttx= data((321:end),2:end);%Prediction set input
% Data preprocessing,Normalize the original data
ts = ts';
tsx = tsx';
tts=tts';
ttx=ttx';
% mapminmax by matlab Self contained mapping function
% yes tsx Normalization
[TSX,TSXps] = mapminmax(tsx,-1,1); %Eigenvalue normalization
[TTX,TTXps] = mapminmax(ttx,-1,1);
% yes TSX Transpose,To meet libsvm Data format requirements of toolbox
TSX = TSX';
TTX = TTX';
%% Select the best regression prediction analysis SVM parameter c&g
% Make parameter selection:
[bestmse,bestc,bestg] = SVMcgForRegress(TS,TSX,-10,10,-10,10);
% Print parameter selection results
disp('Print parameter selection results');
str = sprintf( 'Best Cross Validation MSE = %g Best c = %g Best g = %g',bestmse,bestc,bestg);
disp(str);
%% Regression prediction was used to analyze the best parameters SVM Network training
cmd = ['-c ', num2str(bestc), ' -g ', num2str(bestg) , ' -s 3 -p 0.01'];
model = svmtrain(TS,TSX,cmd);
%% SVM Network regression prediction
[predict,mse] = svmpredict(TS,TSX,model);
[predict_2,mse_2] = svmpredict(TTS,TTX,model);
predict = mapminmax('reverse',predict',TSps);
predict_2 = mapminmax('reverse',predict_2',TTSps);
predict = predict';
predict_2 =predict_2'
% Root mean square error calculation
N = length(tts);
RMSE = sqrt((sum((tts-predict_2').^2))/N)
% % correlation coefficient
% N = length(tts);
% YUCE_R2 = (N*sum(predict_2'.*tts)-sum(predict_2)*sum(tts))^2/((N*sum((predict_2).^2)-(sum(predict_2'))^2)*(N*sum((tts).^2)-(sum(tts))^2))
%% Result analysis (test set)
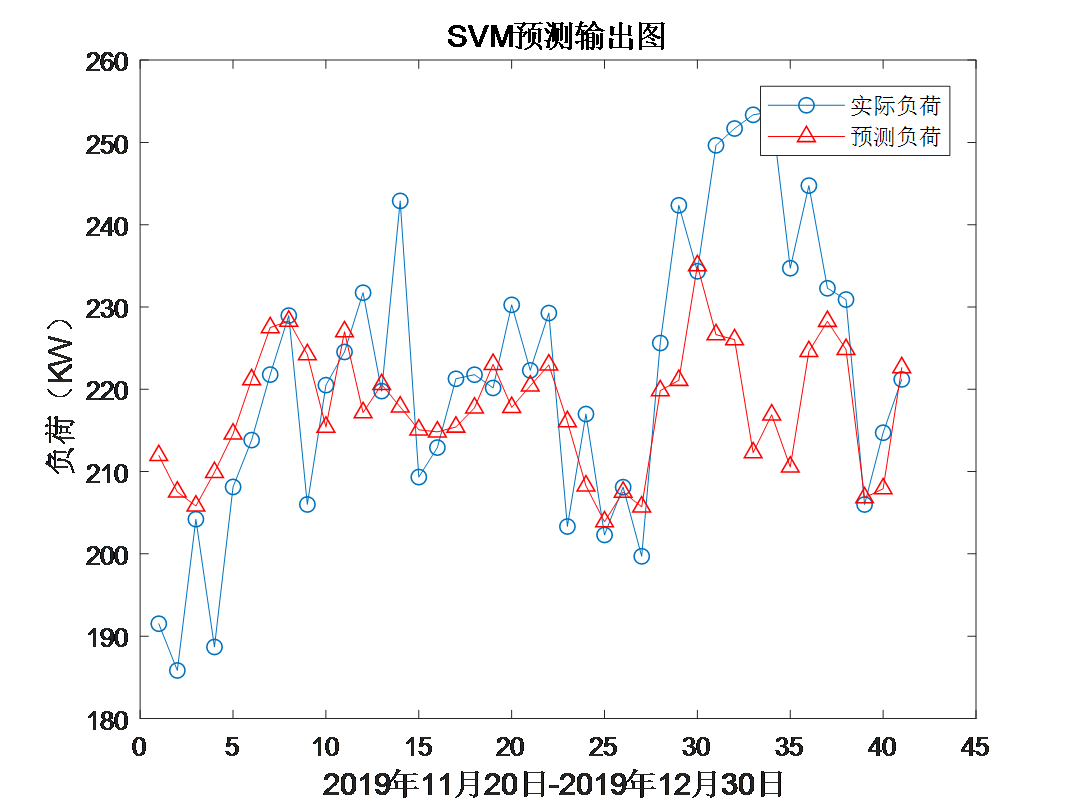
figure;
plot(tts,'-o');
hold on;
plot(predict_2,'r-^');
legend('Actual load','Forecast load');
hold off;
title('SVM Prediction output diagram','FontSize',12);
xlabel('2019 November 20-2019 December 30','FontSize',12);
ylabel('Load( KW)','FontSize',12);
3, Operation results
4, matlab version and references
1 matlab version
2014a
2 references
[1] Steamed stuffed bun Yang, Yu Jizhou, Yang Shan Intelligent optimization algorithm and its MATLAB example (2nd Edition) [M]. Electronic Industry Press, 2016
[2] Zhang Yan, Wu Shuigen MATLAB optimization algorithm source code [M] Tsinghua University Press, 2017
[3] Zhou pin MATLAB neural network design and application [M] Tsinghua University Press, 2013
[4] Chen Ming MATLAB neural network principle and example refinement [M] Tsinghua University Press, 2013
[5] Fang Qingcheng MATLAB R2016a neural network design and application 28 case studies [M] Tsinghua University Press, 2018