1, Introduction of BP neural network traffic sign recognition
Road traffic signs are used to prohibit, warn, instruct and restrict road users to use roads in an orderly manner to ensure travel safety If the road traffic signs can be recognized automatically, the occurrence of road traffic accidents will be greatly reduced However, due to the complexity of road traffic and the immature intelligent recognition technology, a lot of research is still needed in order to obtain an efficient and practical road sign recognition system As an important part of road traffic sign recognition system, the detection and recognition of speed limit traffic signs is of great significance.
At present, many domestic scholars have studied the intelligent recognition of road traffic signs. Aiming at the problem that it is difficult to locate and recognize traffic signs under the background of complex environment, a road traffic sign location algorithm based on specific color of traffic signs and image enhancement and affine transformation of multi-scale Retinex and a sign recognition algorithm based on support vector machine are proposed, Experiments show that the target recognition rate can reach more than 90%, but the detection algorithm based on personal computer (PC) is not suitable for traffic sign detection of image sequence Literature [7] proposed an algorithm for traffic sign recognition in natural scenes based on the fusion of Adaboost algorithm and support vector machine (SVM) algorithm Firstly, the most likely candidate sub image set is selected by Adaboost, and then the candidate set is finally recognized by SVM, so the recognition accuracy is improved to more than 96% Although the above algorithms have achieved certain recognition results to a certain extent, the commonly used methods have some defects, such as high false recognition rate and long detection time The innovation of the neural shift algorithm is that it can shorten the time of adaptive inter frame drift detection and continuous positioning in the video, so as to improve the efficiency of the neural shift algorithm.
1 Detection and identification of speed limit traffic signs
The proposed algorithm mainly includes two parts: detection and recognition of speed limit traffic signs Firstly, the traffic signs are detected from the background of complex environment by using the color and shape characteristics of traffic signs; Then BP neural network is used to train the positive and negative samples to form a training set, so as to realize the recognition of the detected traffic signs; Finally, the time consumption of intelligent detection and recognition is compared by inter frame acceleration method, CamShift method and optical flow method
1.1 detection of speed limit traffic signs
The automatic recognition of traffic signs requires accurate positioning of signs In order to solve the problem of locating speed limit signs in complex environment, by referring to the regulations on the production of speed limit signs in road traffic signs and markings, according to the regulations, the periphery of speed limit signs is red. Using this feature, firstly, the original image is color segmented, the red area is segmented to eliminate some unnecessary noise, and then the image is filtered; Then edge extraction and ellipse fitting are carried out; Finally, the circular sign is detected
1.1.1 color segmentation
Color images taken by digital cameras are generally divided into three channels: red, green and blue (RGB). Sometimes, in order to highlight the characteristics of some colors, they need to be converted to hue saturation value (HSV) space. In order to compare the difference of red information in RGB and HSV space, color segmentation is carried out in RGB and HSV space respectively. The principles are as follows:
(1) RGB space color segmentation Judge the RGB image pixel by pixel. If the five conditions of G-B r < 0.1, R ≥ 160, G-B < 30, G < 120 and B < 120 are met at the same time, the area is assigned to white; Otherwise, turn it black In this way, the white region is the region of interest, and the segmentation is completed The color segmentation effect is shown in Figure 1 © As shown in
(2) HSV space color segmentation First, the original image (Fig. 1 (a)) is transferred from RGB to HSV space, and then judged pixel by pixel. If V ≥ 0.15 and S ≥ 0.1 and H ≤ 7 or H ≥ 170, the area is assigned white; Otherwise, turn it black In this way, the white region is the region of interest, and the segmentation is completed The obtained color segmentation effect is shown in Figure 1 (b)
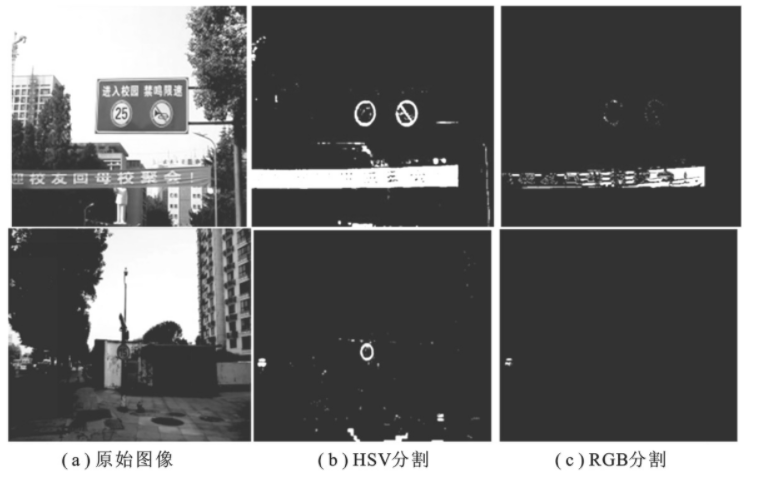
Fig. 1 color segmentation experiment
Through comparative experiments, it can be seen that the color segmentation based on RGB space is difficult to segment the signboard when the image illumination conditions are insufficient, and the HSV space has low requirements for light, which can better identify the red area. Therefore, the color segmentation based on HSV space in this paper is better than the RGB color segmentation proposed in other literatures.
1.1.2 image smoothing and edge extraction
Due to the complex road traffic background, there is still some noise after color segmentation. In order to filter the noise, the method of cubic Gaussian smoothing is used to remove the noise, so as to facilitate the next edge extraction. The experimental results are shown in Fig. 2 The experimental results show that after Gaussian filtering, the image not only maintains the basic contour, but also suppresses the noise.
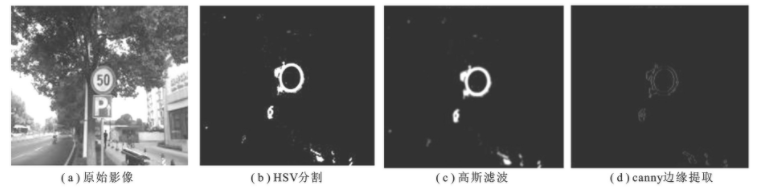
Figure 2 image smoothing and edge extraction
Edge is the place where the gray change rate of image is the largest. It generally contains very important feature information, which is often used in object detection Image edge not only retains the very important information in the original image, but also greatly reduces the amount of data, which fully meets the requirements of feature extraction. Therefore, canny edge extraction is used for image edge extraction in this paper
1.1.3 ellipse fitting
Ellipse fitting method is to find an ellipse closest to the sample point from a group of sample points, that is, fit a group of data in the image with the ellipse equation as the model, make an ellipse equation meet these data as much as possible, and finally determine the best fitting ellipse
As the basic method of data fitting, the least square method was first applied to ellipse fitting. Its basic idea is to minimize the overall error of the equation, that is, continuously assume the ellipse equation according to the given data set, calculate the sum of the distances from each undetermined point to the ellipse, and finally find the ellipse equation with the smallest sum of distances, which is the best fitting ellipse
In this paper, the least square method is used to fit the ellipse. Because the road background is complex and the preliminarily fitted ellipse contains more interference information (as shown in Fig. 3 (a)), the oblateness of the fitted ellipse is limited. If the oblateness e is between 0.8 ~ 1.2, i.e. 0.8 ≤ e ≤ 1.2, it is considered as a circular traffic sign area; Otherwise, it is interference information The final test results are shown in Figure 3 (b)
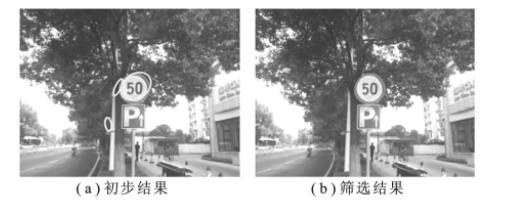
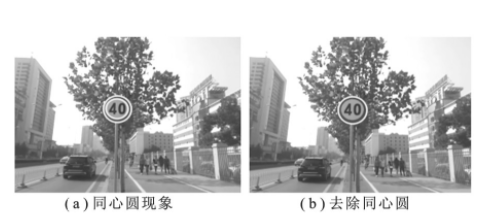
Figure 4 concentric circle removal
1.1.4 concentric circle removal
Since there will be two red circles inside and outside after edge extraction, concentric circles are easy to appear after ellipse fitting, as shown in Fig. 4 (a) To solve this problem, this paper uses an arrangement combination distance comparison method to remove concentric circles, that is, compare the center distances of all detected ellipses. If the Euclidean distance between the two centers is less than the minimum setting distance, only the largest circle is retained and the smallest circle is removed; On the contrary, it is considered that the two circles are not concentric and are all retained Figure 4 (b) shows the test results after removing concentric circles
1.2 speed limit sign recognition based on BP neural network
In the previous section, the road traffic signs are detected from the background of complex environment. Next, the detected traffic signs need to be automatically recognized, so the image recognition technology needs to be used In recent years, artificial neural network is often used in image recognition and other fields because of its strong learning ability and parallel computing ability Although this method belongs to the category of machine learning and cannot be completely comparable with human brain, it has adaptive learning ability and can learn samples through a series of specified learning features, that is, it abstracts human brain neurons to form a simple model, and then forms different networks according to different connection modes, so as to realize the ability of adaptive information processing At present, artificial neural network has been used in medical treatment, transportation, industry, transportation, aviation, aerospace and other fields because of its strong fuzzy learning ability The project in this paper needs real-time detection and recognition of traffic signs. Therefore, the signs can be recognized by BP neural network
1.2.1 algorithm description of BP neural network
BP neural network includes training process and learning process
(1) Training process Firstly, the input layer receives the signal from the outside, and then transmits it to the neurons in the middle layer; The middle layer transforms these information by changing different hidden layer structures; Finally, the information is transferred to the output layer, which is a forward propagation process of learning
When the actual output is different from the expected output, it will enter the error back propagation process Error back transmission means that the output error is transmitted back to the input layer through the hidden layer, and the error is distributed to each layer in the back transmission process, so as to obtain the basis for adjusting the weight of each unit in each layer Through forward and back propagation until the training termination condition is reached
(2) Learning process The learning process of artificial neural network first needs to initialize the network, that is, allocate the connection weight, set the error function, the maximum number of learning, etc; Then input training samples, calculate the input and output of each hidden layer, and adjust the connection weight; Finally, the global error is calculated to judge whether it meets the termination conditions, so as to complete the learning process [10]
1.2.2 calculation of input vector
The input vector is used to represent the feature vector of the pattern. Different signs have different feature vectors. The difference of feature vectors is used to distinguish different sign patterns, so as to achieve the purpose of recognition and classification
The sample images are unified to 30 × 30 pixels, and 63 input nodes are set to calculate the feature vector based on the gray values of three channels of red, green and blue (RGB) of the pattern, and make full use of the image color information, so as to greatly increase the recognition rate
The calculation method of the first three nodes is: calculate the average value of the three red, green and blue channels and normalize it to the range of 0 ~ 1. The calculation formula is as follows:
Then, the projection values in 30 vertical directions vi and horizontal directions hi are calculated:
Where Y is the gray matrix and t is the threshold The expressions for Yi, j and T are

The 63 nodes are used as the values of the input vectors in order for network training.
1.2.3 determination of expected output
The expected output is used to determine the training error of the network and determine the output value. The output can be a value or a vector. In this paper, six different speed limit signs are used as training samples Since the expected output value is in the range of 0 ~ 1, in order to better distinguish different types of speed limit signs, the expected output is set as a six-dimensional vector The vector construction method is as follows: the value of the nth dimension of the expected output vector of the nth training sample is 1, and the values of other dimensions are 0 That is, the expected output vectors of the six training flags are arranged in rows to form a 6 × Identity matrix of 6.
2, Partial source code
function varargout = Traffic_Iden(varargin)
% TRAFFIC_IDEN MATLAB code for Traffic_Iden.fig
%      TRAFFIC_IDEN, by itself, creates a new TRAFFIC_IDEN or raises the existing
%      singleton*.
%
%      H = TRAFFIC_IDEN returns the handle to a new TRAFFIC_IDEN or the handle to
%      the existing singleton*.
%
%      TRAFFIC_IDEN('CALLBACK',hObject,eventData,handles,...) calls the local
%      function named CALLBACK in TRAFFIC_IDEN.M with the given input arguments.
%
%      TRAFFIC_IDEN('Property','Value',...) creates a new TRAFFIC_IDEN or raises the
%      existing singleton*.  Starting from the left, property value pairs are
%      applied to the GUI before Traffic_Iden_OpeningFcn gets called.  An
%      unrecognized property name or invalid value makes property application
%      stop.  All inputs are passed to Traffic_Iden_OpeningFcn via varargin.
%
%      *See GUI Options on GUIDE's Tools menu.  Choose "GUI allows only one
%      instance to run (singleton)".
%
% See also: GUIDE, GUIDATA, GUIHANDLES

% Edit the above text to modify the response to help Traffic_Iden

% Last Modified by GUIDE v2.5 01-Jan-2022 11:02:35

% Begin initialization code - DO NOT EDIT
gui_Singleton = 1;
gui_State = struct('gui_Name',       mfilename, ...
                   'gui_Singleton',  gui_Singleton, ...
                   'gui_OpeningFcn', @Traffic_Iden_OpeningFcn, ...
                   'gui_OutputFcn',  @Traffic_Iden_OutputFcn, ...
                   'gui_LayoutFcn',  [] , ...
                   'gui_Callback',   []);
if nargin && ischar(varargin{1})
    gui_State.gui_Callback = str2func(varargin{1});
end

if nargout
    [varargout{1:nargout}] = gui_mainfcn(gui_State, varargin{:});
else
    gui_mainfcn(gui_State, varargin{:});
end
% End initialization code - DO NOT EDIT


% --- Executes just before Traffic_Iden is made visible.
function Traffic_Iden_OpeningFcn(hObject, eventdata, handles, varargin)
% This function has no output args, see OutputFcn.
% hObject    handle to figure
% eventdata  reserved - to be defined in a future version of MATLAB
% handles    structure with handles and user data (see GUIDATA)
% varargin   command line arguments to Traffic_Iden (see VARARGIN)

% Choose default command line output for Traffic_Iden
handles.output = hObject;
handles.cd0 = cd;
handles.Color = 0;
handles.I = [];

axes(handles.axes1);
set(gca,'Xtick',[]);
set(gca,'Ytick',[]);
box on;

axes(handles.axes2);
set(gca,'Xtick',[]);
set(gca,'Ytick',[]);
box on;

axes(handles.axes3);
set(gca,'Xtick',[]);
set(gca,'Ytick',[]);
box on;

axes(handles.axes4);
set(gca,'Xtick',[]);
set(gca,'Ytick',[]);
box on;
% Update handles structure
guidata(hObject, handles);

% UIWAIT makes Traffic_Iden wait for user response (see UIRESUME)
% uiwait(handles.figure1);


% --- Outputs from this function are returned to the command line.
function varargout = Traffic_Iden_OutputFcn(hObject, eventdata, handles)
% varargout  cell array for returning output args (see VARARGOUT);
% hObject    handle to figure
% eventdata  reserved - to be defined in a future version of MATLAB
% handles    structure with handles and user data (see GUIDATA)

% Get default command line output from handles structure
varargout{1} = handles.output;


% --- Executes on button press in radiobutton3.
function radiobutton3_Callback(hObject, eventdata, handles)
% hObject    handle to radiobutton3 (see GCBO)
% eventdata  reserved - to be defined in a future version of MATLAB
% handles    structure with handles and user data (see GUIDATA)

% Hint: get(hObject,'Value') returns toggle state of radiobutton3


% --- Executes on button press in radiobutton4.
function radiobutton4_Callback(hObject, eventdata, handles)
% hObject    handle to radiobutton4 (see GCBO)
% eventdata  reserved - to be defined in a future version of MATLAB
% handles    structure with handles and user data (see GUIDATA)

% Hint: get(hObject,'Value') returns toggle state of radiobutton4


% --- Executes on button press in radiobutton5.
function radiobutton5_Callback(hObject, eventdata, handles)
% hObject    handle to radiobutton5 (see GCBO)
% eventdata  reserved - to be defined in a future version of MATLAB
% handles    structure with handles and user data (see GUIDATA)

% Hint: get(hObject,'Value') returns toggle state of radiobutton5


% --- Executes on button press in pushbutton1.
function pushbutton1_Callback(hObject, eventdata, handles)
% hObject    handle to pushbutton1 (see GCBO)
% eventdata  reserved - to be defined in a future version of MATLAB
% handles    structure with handles and user data (see GUIDATA)
%%  Image Reading
[filename, cd1] = uigetfile( ...
    {'*.tif;*.TIF;*.JPG;*.jpg;*.bmp;*.BMP;*.jpeg;*.JPEG;','Image file';...
    '*.*', 'All file (*.*)'},'Pick an Image');
axes(handles.axes1);
cla;
axes(handles.axes2);
cla;
axes(handles.axes3);
cla;
axes(handles.axes4);
cla;
if filename

    cd(cd1);
    d = imread(filename);
    cd(handles.cd0);
    handles.I = d;
    axes(handles.axes1);
    imshow(d);
    handles.filename = filename;

    box on;

end

handles.Color = 0;
cd(handles.cd0);
set(handles.text2,'string','');
guidata(hObject, handles);


% --- Executes on button press in pushbutton2.
function pushbutton2_Callback(hObject, eventdata, handles)
% hObject    handle to pushbutton2 (see GCBO)
% eventdata  reserved - to be defined in a future version of MATLAB
% handles    structure with handles and user data (see GUIDATA)
%% Extraction flag
% According to color
Color = 0; % Color mark 1 is red, 2 is blue and 3 is yellow

if get(handles.radiobutton3,'Value')

    Color = 1;

elseif get(handles.radiobutton4,'Value')

    Color = 2;

elseif get(handles.radiobutton5,'Value')

    Color = 3;

end

handles.Color = Color;

Image = handles.I;

switch Color

    case 1

        DI = Image(:,:,1);
        GI = (Image(:,:,1)>110 & Image(:,:,2)<150 & Image(:,:,3)<150 ...
            & abs(double(Image(:,:,2))-double(Image(:,:,3)))<50 & abs(double(Image(:,:,1))-double(Image(:,:,2)))>30);

    case 2

        DI = Image(:,:,3);
        GI = (Image(:,:,1)<100 & Image(:,:,2)<150 & Image(:,:,3)>120 ...
             & abs(double(Image(:,:,2))-double(Image(:,:,3)))>30);

    case 3

        DI = rgb2gray(Image);
        GI = (Image(:,:,1)>160 & Image(:,:,2)>90 & Image(:,:,3)<90 ...
            & abs(double(Image(:,:,1))-double(Image(:,:,2)))<100 & abs(double(Image(:,:,1))-double(Image(:,:,3)))>90);

end
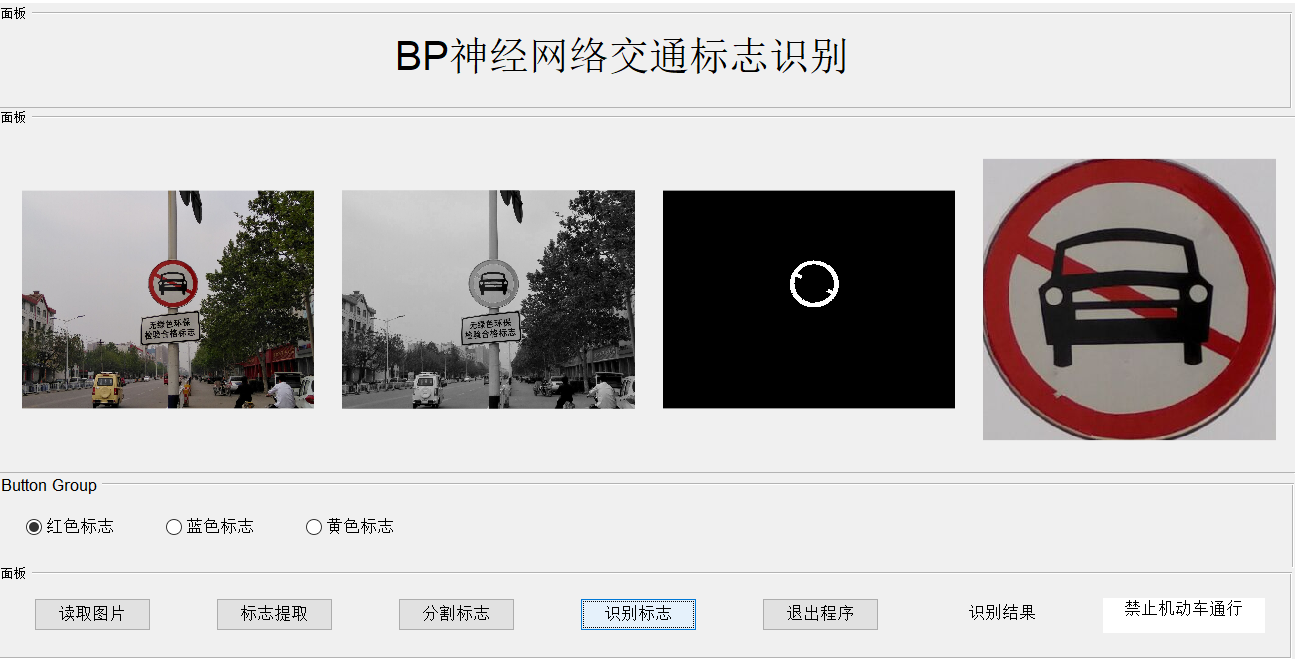
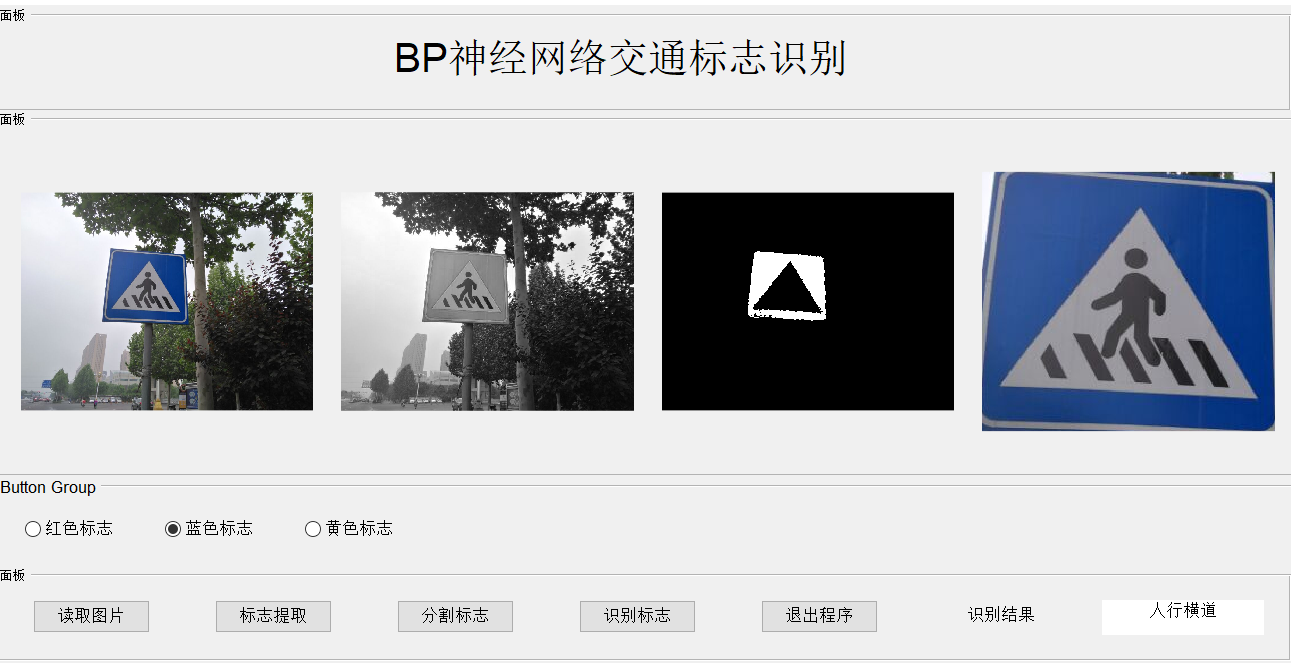
3, Operation results
4, matlab version and references
1 matlab version
2014a
2 references
[1] Cai Limei MATLAB image processing -- theory, algorithm and example analysis [M] Tsinghua University Press, 2020
[2] Yang Dan, Zhao Haibin, long Zhe Detailed explanation of MATLAB image processing example [M] Tsinghua University Press, 2013
[3] Zhou pin MATLAB image processing and graphical user interface design [M] Tsinghua University Press, 2013
[4] Liu Chenglong Proficient in MATLAB image processing [M] Tsinghua University Press, 2015
[5] Zhang Xingguo, Liu Xiaolei, Li Jing, Wang Huandong Real time detection and recognition of speed limit traffic signs based on BP neural network [J] Journal of Xi'an University of Electronic Science and technology 2018,45(05)