Pitch frequency detection
1, Concept
What is the pitch period? When people pronounce, according to whether the vocal cord vibrates, the speech signal can be divided into voiced and voiced. Voiced speech carries a lot of energy, so it is also called voiced speech, which has obvious periodicity in time domain. Unvoiced sound is similar to white noise and has no obvious periodicity. When voiced, the air flow through the glottis causes the vocal cord to produce relaxation vibration, resulting in quasi periodic excitation pulse train. The frequency of this vocal cord vibration is called pitch frequency; The corresponding period is called pitch period.
Pitch frequency is related to the situation of individual vocal cords, including vocal cord length, thickness, toughness, stiffness and pronunciation habits. In general, pitch frequency is one of the characteristics of speakers. Moreover, the pitch frequency also varies with people's gender and age. Men are about 70-200Hz and women are about 200-450Hz.
2, Detection method
Although there are many methods for pitch period detection at present, these methods have limitations. No detection method can be applied to different speakers and different environments. The main reasons are summarized as follows:
- The change of speech signal is complex, the waveform of glottic excitation is not a complete periodic pulse train, and the tail of speech does not have the periodicity of vocal cord vibration. It is difficult to determine the periodicity of some clear voiced transition frames.
- The formant of the vocal tract sometimes affects the harmonic structure of the excitation signal.
- In voiced speech segment, it is difficult to accurately judge the beginning and end positions of each pitch cycle
- Speech signals are often mixed with noise
- The pitch frequency varies widely, from 70Hz of bass male voice to 450Hz of children's women, which is close to three octaves, which brings some difficulties to pitch detection.
At present, pitch detection algorithms can be roughly divided into two categories: non event based detection methods and event based detection methods. Event refers to glottic closure.
Non event based detection methods mainly include autocorrelation function method, average amplitude difference function method, cepstrum method and so on. The non event based detection method takes advantage of the short-time stability of speech signal. Firstly, the speech signal is divided into speech frames with a certain length, and then the pitch period of each frame is calculated. It has the advantages of simple algorithm and small amount of computation, but its disadvantage is that it can not detect the non-stationary change of pitch period in the frame, and the detection accuracy is not high.
Event based detection methods mainly include wavelet transform and Hilbert Huang transform. The event based detection method estimates the pitch period through the closing time of glottis, without the assumption of short-term stationarity of speech signal. The advantages are: it has good local characteristics in time domain and frequency domain, can track the change of pitch period, and can detect the small change of pitch period, with high detection accuracy. The disadvantage is that the amount of calculation is large
3, Estimate the pitch frequency of a frame signal
cepstrum
Due to voice
x
(
i
)
x(i)
x(i) is excited by glottic pulses
u
(
i
)
u(i)
u(i) channel response
v
(
i
)
v(i)
Obtained by v(i) filtering, i.e
x
(
i
)
=
u
(
i
)
∗
u
(
i
)
x(i)=u(i)*u(i)
x(i)=u(i)∗u(i)
Let the cepstrums of these three quantities be
x
^
(
i
)
,
u
^
(
i
)
,
v
^
(
i
)
\widehat{x}(i),\widehat{u}(i),\widehat{v}(i)
x
(i),u
(i),v
(i) , then:
x
^
(
i
)
=
u
^
(
i
)
∗
v
^
(
i
)
\widehat{x}(i)=\widehat{u}(i)*\widehat{v}(i)
x
(i)=u
(i)∗v
(i)
Because in the cepstrum domain
u
^
(
i
)
and
v
^
(
i
)
\widehat{u}(i) and \ widehat{v}(i)
u
(i) And v
(i) It is relatively separated, indicating that the acoustic pulse cepstrum containing pitch information can be separated from the channel response cepstrum, so it is separated from the cepstrum domain
u
^
(
i
)
and
u
(
i
)
\widehat{u}(i) and u(i)
u
(i) And u(i). After calculating the cepstrum, the cepstrum frequency is
P
m
i
n
∼
P
m
a
x
P_{min} \sim P_{max}
Find the maximum value of cepstrum function between Pmin ∼ Pmax ∼ and the number of samples corresponding to the maximum value of cepstrum function is the pitch period of speech signal in the current frame
T
0
(
n
)
T_0(n)
T0 (n), pitch frequency
F
0
(
N
)
=
f
s
/
T
0
(
n
)
F_0(N)=f_s/T_0(n)
F0(N)=fs/T0(n)
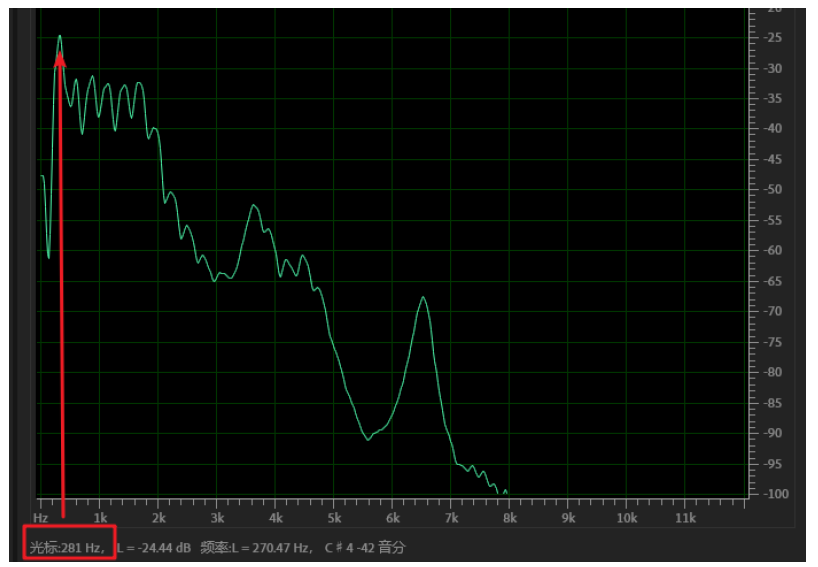
Take out a frame signal from matlab, carry out 256 point fft transformation, calculate its modulus and take logarithm to obtain the amplitude spectrum, and take two adjacent peak points, as shown in the figure below
clc; close all; clear all;
[x1,Fs] = audioread('voice/a9.wav');
wlen=256; inc=128;          % The frame length and frame shift are given
N=length(x1);                    % Signal length
time=(0:N-1)/Fs;                % Calculate the time scale of the signal
signal=enframe(x1,wlen,inc)';     % Framing
framedata = signal(:,15);
x2 = fft(framedata);
amp = 20*log10(abs(x2)+0.0000001);
plot(amp)
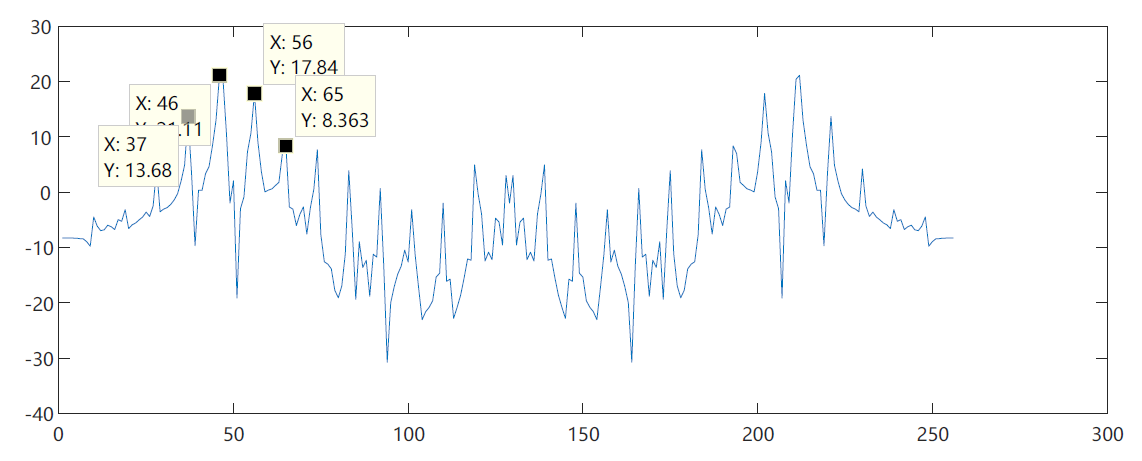
It can be seen from the figure that the period difference between the two peak points is 9. According to the nature of FFT, the frequency interval between adjacent points is:
δ
=
f
s
N
=
8000
256
=
31.25
H
z
\delta = \frac{f_s}{N}=\frac{8000}{256}=31.25Hz
δ=Nfs=2568000=31.25Hz
Therefore, the fundamental frequency corresponding to the period with a difference of 9 points is:
f
b
=
9
δ
=
281.25
H
z
f_b=9\delta=281.25Hz
fb=9δ=281.25Hz
Since both sides are symmetrical after FFT transformation, it is not difficult to find that the corresponding fundamental frequency is also 281.25Hz by moving the spectrum of the symmetrical side with FFT shift () in matlab and taking points for calculation.
signal=enframe(x1,wlen,inc)';     % Framing
framedata = signal(:,15);
x2 = fft(framedata);
amp = 20*log10(abs(x2)+0.0000001);
plot(fftshift(amp));
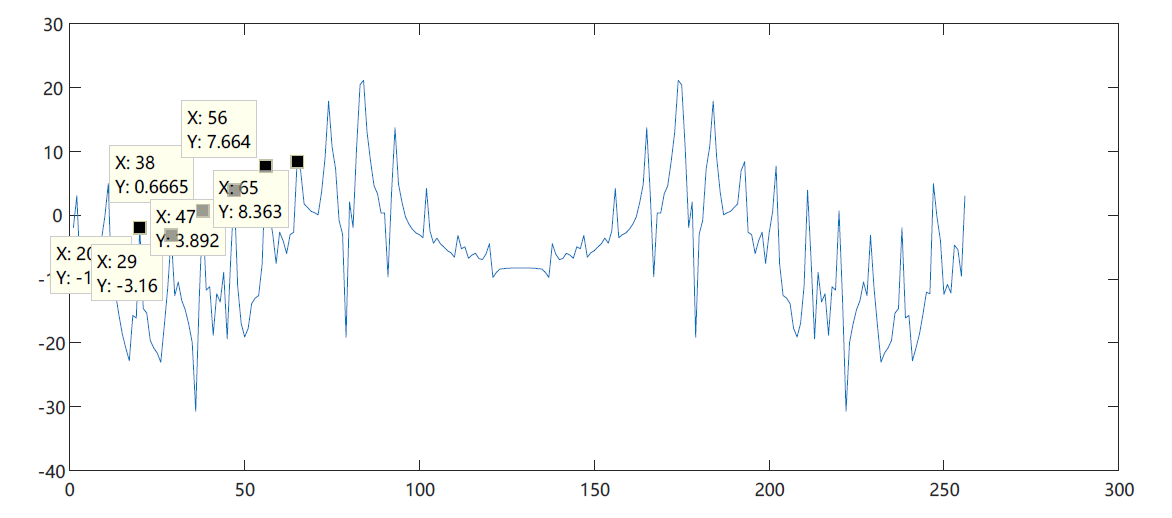
If multiple intervals are used to estimate the frequency detection of adjacent points, it is
f
b
=
65
−
20
5
δ
=
281.25
H
z
f_b=\frac{65-20}{5}\delta = 281.25Hz
fb=565−20δ=281.25Hz
If this amplitude spectrum is regarded as a time domain signal, the corresponding time period of periodicity is:
t
=
9
1
f
s
=
0.001125
s
t=9\frac{1}{f_s}=0.001125 s
t=9fs1=0.001125s
The corresponding frequency is:
f
=
f
s
9
≈
888.9
H
z
f=\frac{f_s}{9} \approx 888.9Hz
f=9fs≈888.9Hz
The number of points corresponding to 888.9Hz in the new frequency domain amplitude obtained by fft transformation of the amplitude spectrum is
888.9
δ
=
888.9
31.25
=
28.4448
≈
28
spot
\frac{888.9}{\delta}=\frac{888.9}{31.25}=28.4448\approx28 points
δ 888.9 = 31.25888.9 = 28.4448 ≈ 28 points
framedata = signal(:,15);
x2 = fft(framedata);
amp = 20*log10(abs(x2)+0.0000001);
% plot(fftshift(amp));
x3 = fft(fftshift(amp));
amp2 = abs(x3);
plot(amp2);
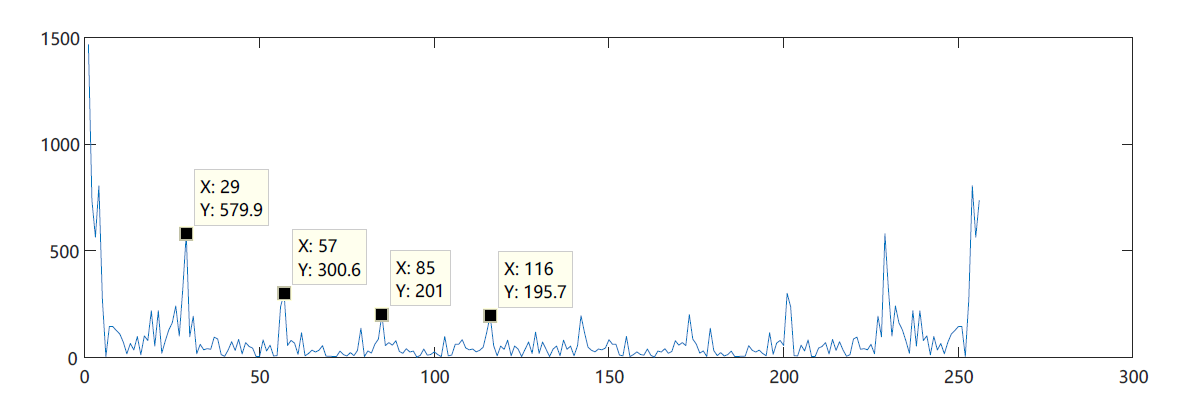
It is not difficult to see from the above figure that there are peaks between 29 and 116, and the interval is about 28.
Process derivation:
f
s
m
⋅
f
s
N
=
N
m
=
888.9
31.25
=
28
spot
f
b
=
m
f
s
N
=
281.25
H
z
\frac{f_s}{m}\cdot\frac{f_s}{N}=\frac{N}{m}=\frac{888.9}{31.25}=28 points \ \ f_b=m\frac{f_s}{N}=281.25Hz
mfs ⋅ Nfs = mN = 31.25888.9 = 28 points fb = mNfs = 281.25Hz
therefore
f
b
=
f
s
28.4448
=
281.25
H
z
f_b = \frac{f_s}{28.4448}=281.25Hz
fb=28.4448fs=281.25Hz
Idea:
The fundamental frequency in a frame signal is required, and the following methods are assumed:
- Calculate the FFT spectrum of the logarithmic amplitude spectrum of a frame signal. After taking half, find the positions of several peak points and calculate the interval of peak points
Other software verification
Put this voice into Adobe audit. From the spectrogram, the first energy column is a little lower at 300Hz.
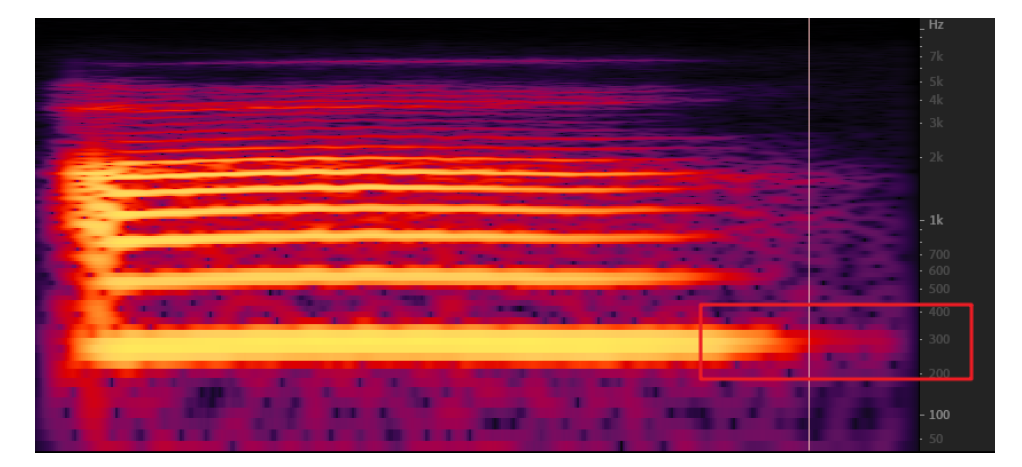
From the spectrum diagram, the frequency corresponding to the first peak is 281Hz, which has little error with the value calculated above
Algorithm implementation
According to the above idea, I wrote a program to calculate the fundamental frequency. The general idea is to estimate the frequency detection of adjacent points with multiple intervals, take half of the amplitude spectrum interval of two FFT transforms, find out the maximum point in this interval, and calculate the fundamental frequency according to the number of points.
clc; close all; clear all;
[x1,Fs] = audioread('voice/a9.wav');
wlen=256; inc=128; % The frame length and frame shift are given
N=length(x1); % Signal length
time=(0:N-1)/Fs; % Calculate the time scale of the signal
signal=enframe(x1,wlen,inc)'; % Framing
framedata = signal(:,15);
x2 = fft(framedata);
amp = 20*log10(abs(x2));
x3 = abs(fft(amp));
x4 = x3(1:128);
%Find the maximum point
datacursormode on
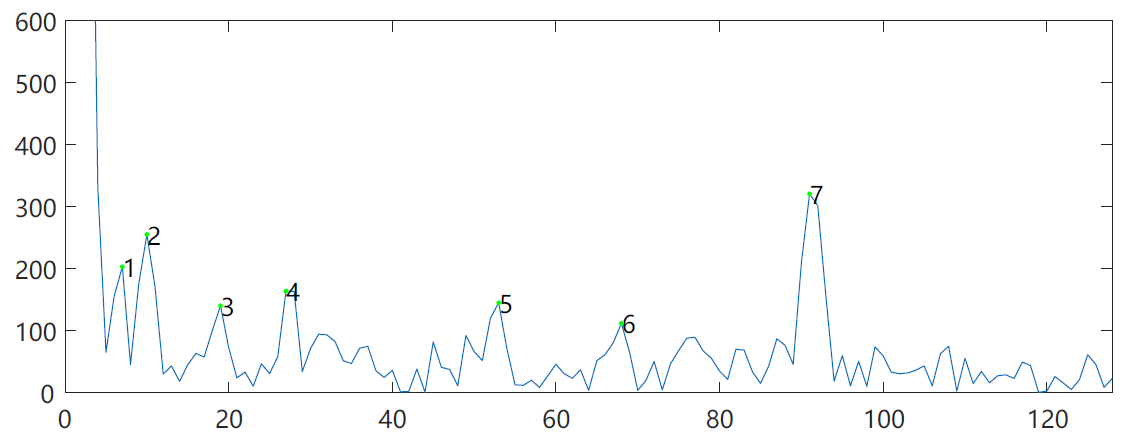
[y,x] = findpeaks(x4,'MinPeakHeight',194);
plot(x4);
% axis([0,128,0,600]);
text(x+.02,y,num2str((1:numel(y))'))
hold on;
plot(x,y,'g.');
%calculation fs
x_len = length(x);
x_min = min(x);
x_max = max(x);
fs = (x_max - x_min)/(x_len - 1)*31.25
The operation results are shown in the figure below. The calculated fundamental frequency is 437.5Hz, which is quite different from the 181Hz found in Au. From the point of finding the maximum value, it is obvious that the point is not right. For example, point 1 and point 3 should be excluded. However, since these points are not uniform from large to small, if the threshold is set higher than 1, then points 4, 5 and 6 will be filtered, Therefore, it is not very appropriate to set the threshold to find the maximum value.
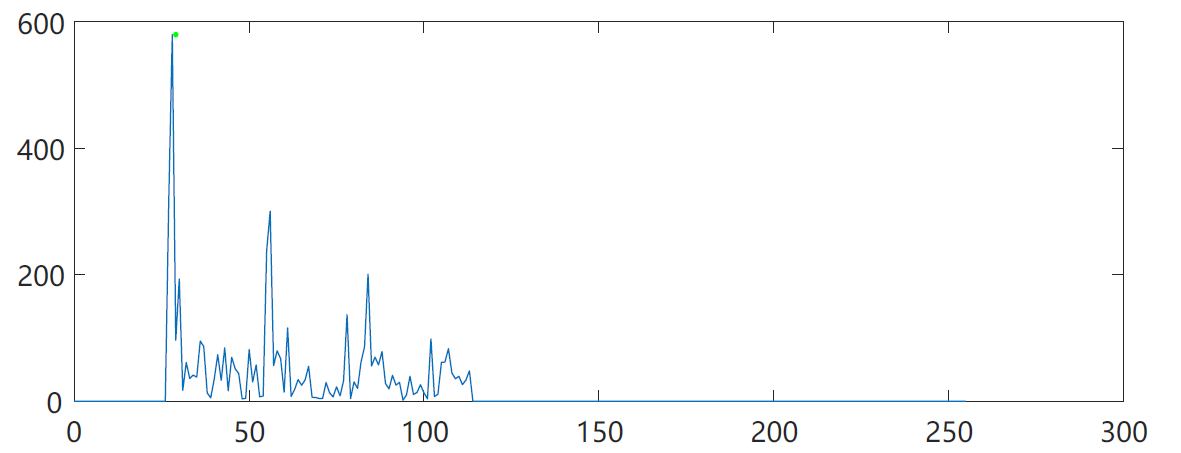
Finally, according to the teacher's idea, the range of pitch frequency of voice is used to determine the maximum value in the x-axis range
clc; close all; clear all;
[x1,Fs] = audioread('voice/a9.wav');
wlen=256; inc=128; % The frame length and frame shift are given
N=length(x1); % Signal length
time=(0:N-1)/Fs; % Calculate the time scale of the signal
signal=enframe(x1,wlen,inc)'; % Framing
framedata = signal(:,15);
x2 = fft(framedata);
amp = 20*log10(abs(x2));
x3 = abs(fft(amp));
x3(1:27) = 0;%Zeros are taken outside the speech fundamental frequency range
x3(115:256) = 0;
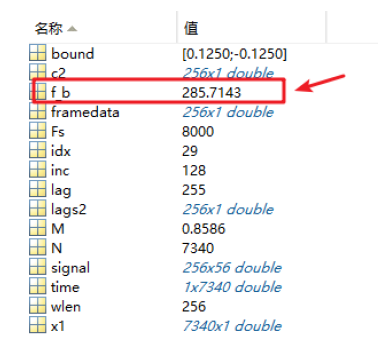
[M,idx] = max(x3);
f_b=Fs/(idx-1);
plot([0:255],x3);
hold on;
plot(idx,M,'g.');
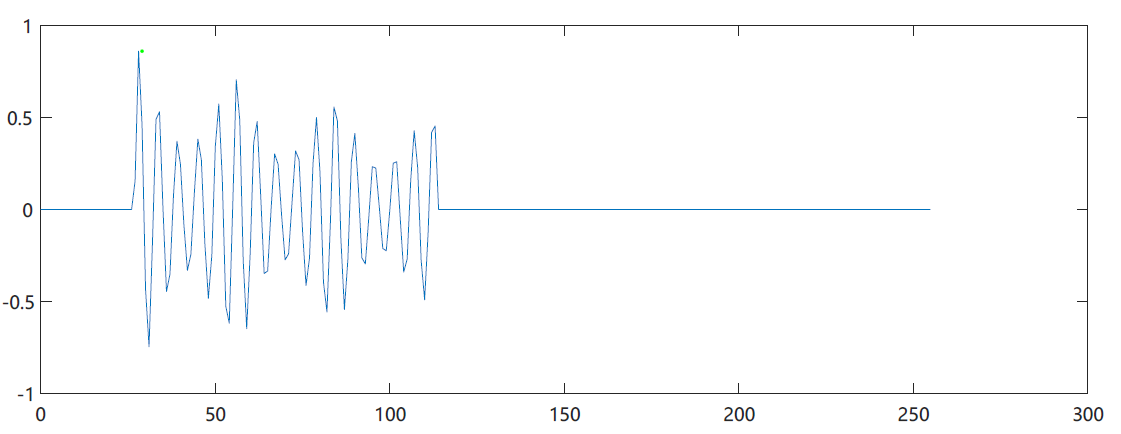
The calculated pitch frequency is 285.7Hz, which is very close to the 281.25Hz we just calculated manually.
Short time autocorrelation method
The pitch detection of short-time autocorrelation method mainly uses the property of short-time autocorrelation function to determine the pitch period by comparing the similarity between the original signal and its delayed signal. When the maximum amplitude of normalized autocorrelation function is other delays, the amplitude is less than 1 If the delay is equal to the pitch period, the two signals have the greatest similarity. Directly finding the distance between the two maxima of the short-term autocorrelation function can be used as the initial estimation of the pitch period. After calculating the short-time autocorrelation, it is the same as finding the maximum value by cepstrum method, and it is also the same when using correlation function method P m i n ∼ P m a x P_{min} \sim P_{max} Pmin ∼ Pmax ∼ see finding the maximum value of the normalized correlation function. The delay corresponding to the maximum value is the pitch period.
Or use the audio of the original vowel a and take out a frame for short-term autocorrelation calculation
clc; close all; clear all;
[x1,Fs] = audioread('voice/a9.wav');
%plot(x1);
lag=255;
%Observe a range of vowels
wlen=256; inc=128;          % The frame length and frame shift are given
N=length(x1);                    % Signal length
time=(0:N-1)/Fs;                % Calculate the time scale of the signal
signal=enframe(x1,wlen,inc)';     % Framing
%Take out a frame of data
% frametime = (frame-1)*inc+1:(frame-1)*inc+wlen;
framedata = signal(:,15);
% plot(frametime,framedata);
%Short time autocorrelation calculation of data
[c2,lags2,bound]=autocorr(framedata,lag);
plot(lags2,c2);
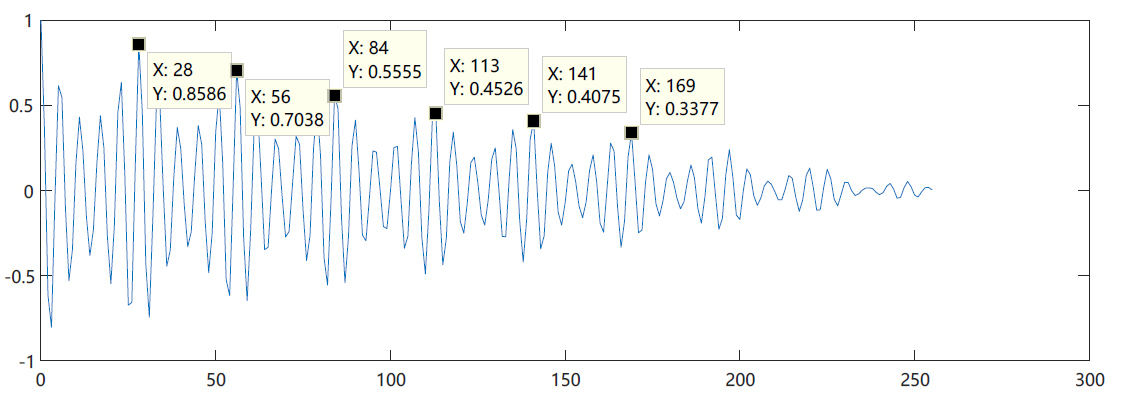
Manual calculation
Take four points with x-axis of 12,56113141 for calculation
f
b
1
=
8000
56
−
28
=
285.71
H
z
f
b
2
=
8000
141
−
113
=
285.71
H
z
f_{b1}=\frac{8000}{56-28}=285.71Hz\\ f_{b2}=\frac{8000}{141-113}=285.71Hz
fb1=56−288000=285.71Hzfb2=141−1138000=285.71Hz
machine computation
As used in cepstrum method, the maximum value in the x-axis range is determined by using the range of pitch frequency of voice to calculate pitch frequency
clc; close all; clear all;
[x1,Fs] = audioread('voice/a9.wav');
%plot(x1);
lag=255;
%Observe a range of vowels
wlen=256; inc=128;          % The frame length and frame shift are given
N=length(x1);                    % Signal length
time=(0:N-1)/Fs;                % Calculate the time scale of the signal
signal=enframe(x1,wlen,inc)';     % Framing
%Take out a frame of data
% frametime = (frame-1)*inc+1:(frame-1)*inc+wlen;
framedata = signal(:,15);
% plot(frametime,framedata);
%Short time autocorrelation calculation of data
[c2,lags2,bound]=autocorr(framedata,lag);
% plot(lags2,c2);
%Zeros are taken outside the speech fundamental frequency range
c2(1:27) = 0;
c2(115:256) = 0;
[M,idx] = max(c2);
f_b=Fs/(idx-1);
plot([0:255],c2);
hold on;
plot(idx,M,'g.');
The calculated fundamental frequency is 285.7Hz, which is consistent with the manually calculated fundamental frequency
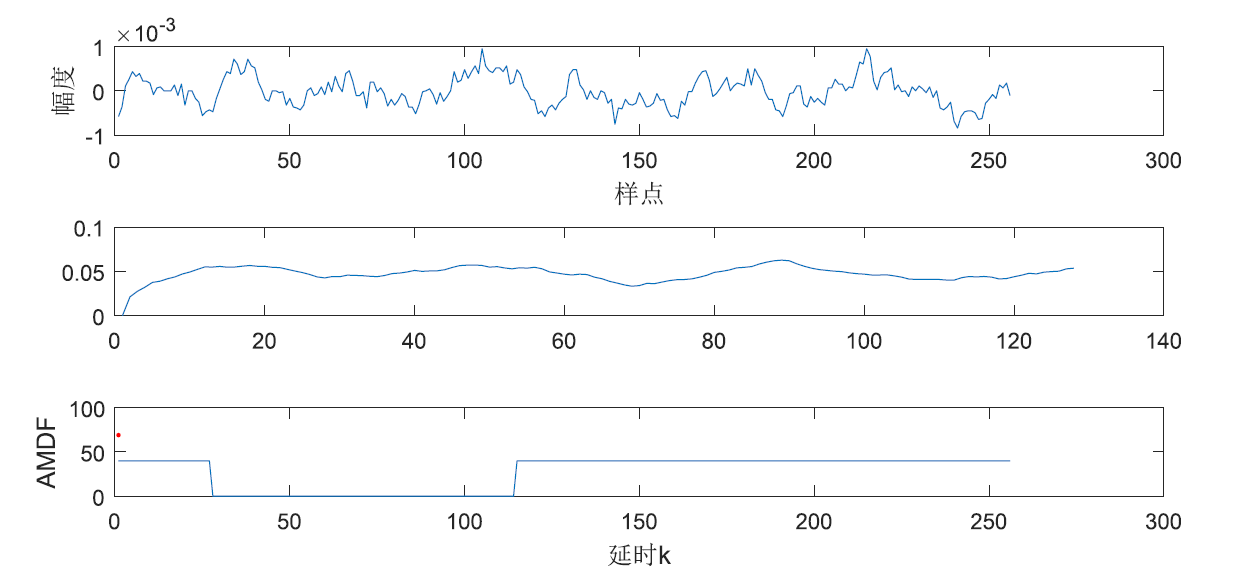
Short time amplitude difference
Short time average amplitude difference function:
F
n
(
k
)
=
∑
m
=
0
N
−
1
−
k
∣
x
n
(
m
)
−
x
n
(
m
+
k
)
∣
,
0
<
k
≤
K
F_{n}(k)=\sum_{m=0}^{N-1-k}\left|x_{n}(m)-x_{n}(m+k)\right|, 0<k \leq K
Fn(k)=m=0∑N−1−k∣xn(m)−xn(m+k)∣,0<k≤K
clc; close all; clear all;
[b,Fs] = audioread('voice/a9.wav');
b1=b(3000:3256); % Select a voice
N=128; % Window size
A=[];
for k=1:128; % Delay length
    sum=0;
    for m=1:N;
        sum=sum+abs(b1(m)-b1(m+k-1));
    end
    A(k)=sum;
end
% A(1:27) = 100;%Zeros are taken outside the speech fundamental frequency range
% A(115:256) = 100;
% [M,idx] = min(A);
% f_b=Fs/(idx-1);
% s=b(1:320)
figure(1)
subplot(2,1,1)
plot(b1);
xlabel('Sample point')
ylabel('range')
% axis([0,320,-0.2,0.2])
subplot(2,1,2)
plot(A);
xlabel('delayed k')
ylabel('AMDF')
% axis([0,320,0,60]);
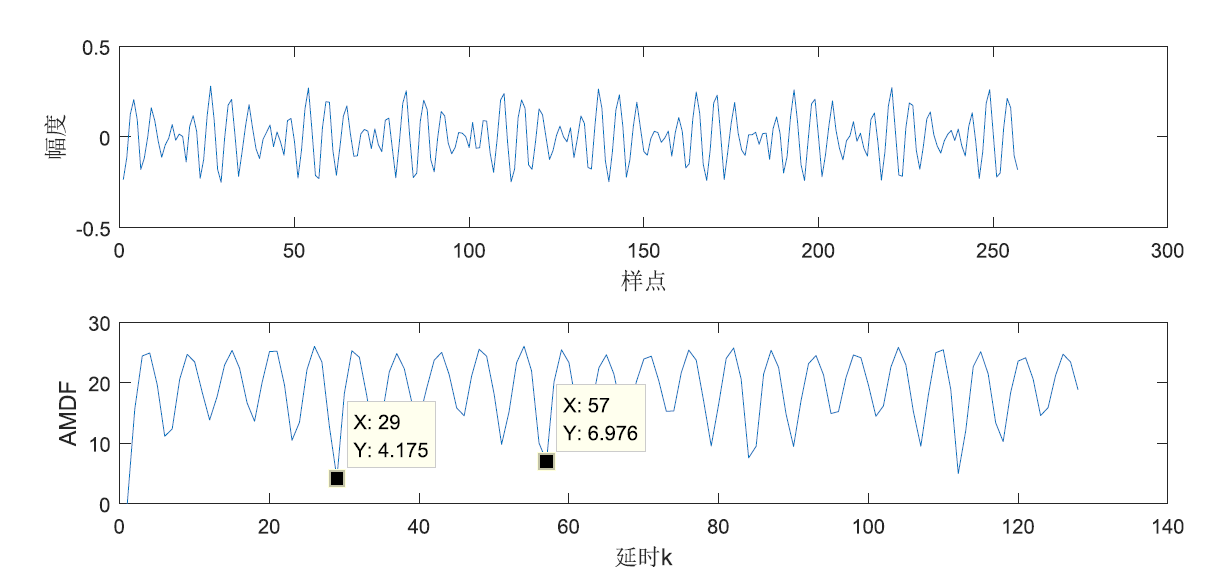
Calculate the pitch frequency between x=57 and x=29
f
b
=
8000
57
−
29
=
285.71
H
z
f_b=\frac{8000}{57-29}=285.71Hz
fb=57−298000=285.71Hz
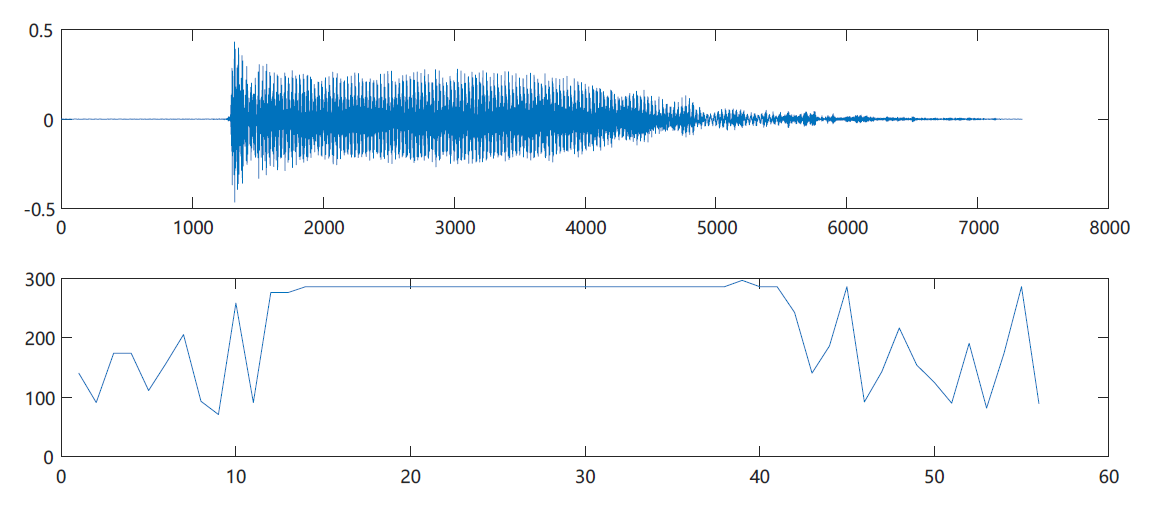
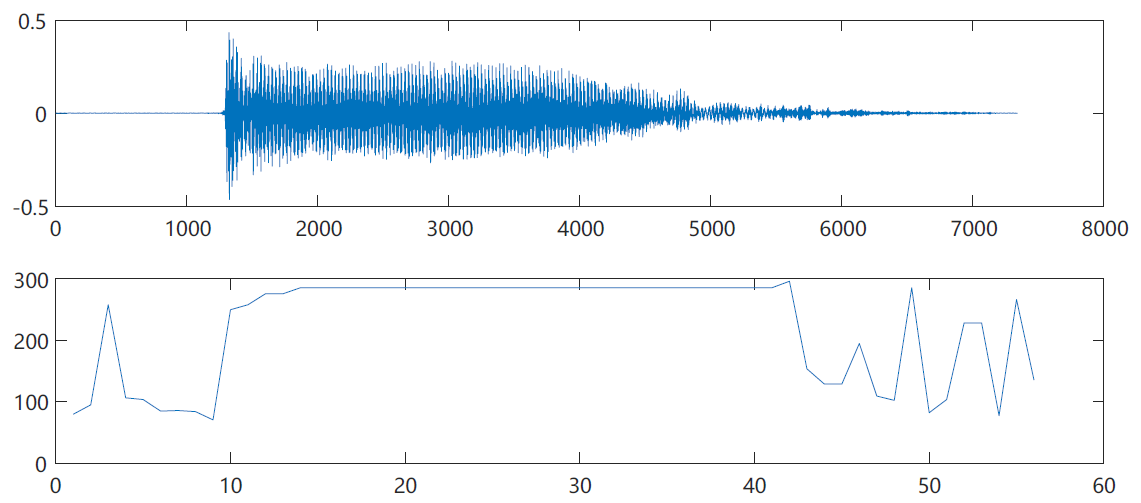
4, Estimate the pitch frequency of a speech
The pitch frequency of each frame after framing is estimated to obtain the pitch frequency map of each frame of the language.
cepstrum
%Find the pitch frequency of a speech
clc; close all; clear all;
[x1,Fs] = audioread('voice/a9.wav');
subplot(2,1,1);
plot(x1);
wlen=256; inc=128;          % The frame length and frame shift are given
N=length(x1);                    % Signal length
time=(0:N-1)/Fs;                % Calculate the time scale of the signal
signal=enframe(x1,wlen,inc)';     % Framing
[n,m]=size(signal);
for i=1:m
    framedata = signal(:,i);
%     f_b=pitch_cep(framedata,Fs); %cepstrum
%     f_b=pitch_cor(framedata,Fs); %Autocorrelation method
    f_b=pitch_admf(framedata,Fs); %Average amplitude difference
    x(i)=f_b;
end
subplot(2,1,2);
plot(x);
Autocorrelation method
Short time amplitude difference method
When the fundamental frequency is 8000, the reason is that the two minimum points coincide
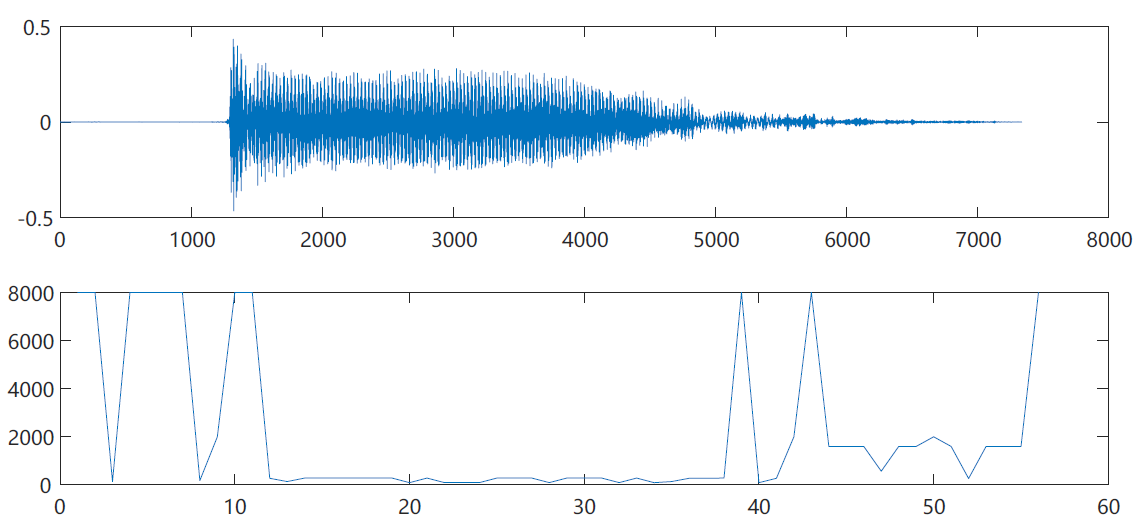
Looking at the graph of the first frame, we can know from the division formula that when the denominator tends to 0, the result will be close to the maximum
5, Validate with voicebox
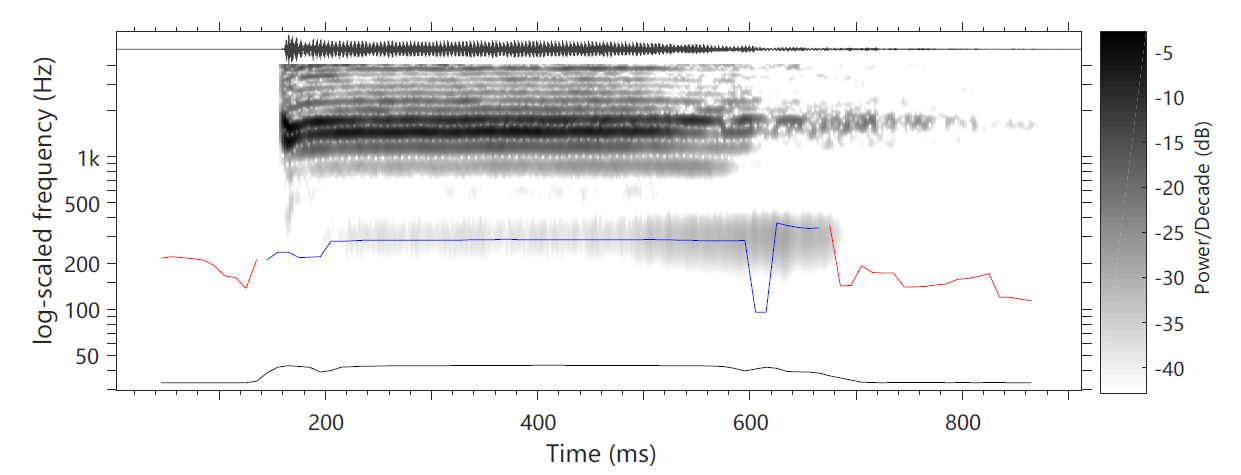
There is no way to superimpose the fundamental frequency on the spectrogram. It is preliminarily speculated that interpolation may be required