Ant colony
brief introduction
Ant colony optimization (ACO), also known as ant algorithm, is a probabilistic algorithm used to find the optimal path in the graph. It was proposed by Marco Dorigo in his doctoral thesis in 1992. Its inspiration comes from the behavior of ants in finding paths in the process of looking for food. Ant colony algorithm is a simulated evolutionary algorithm. Preliminary research shows that the algorithm has many excellent properties. Aiming at the parameter optimization design of PID controller, the results of ant colony algorithm design are compared with those of genetic algorithm design. The numerical simulation results show that ant colony algorithm has the effectiveness and application value of a new simulated evolutionary optimization method.
definition
Each ant starts looking for food without telling them where the food is in advance. When an ant finds food, it will release a volatile secretion pheromone (called pheromone, which will gradually volatilize and disappear with the passage of time, and the pheromone concentration represents the distance of the path) to attract other ants, so that more and more ants will find food.
Some ants do not always repeat the same path as other ants. They will find another way. If the other path is shorter than the original one, then gradually, more ants are attracted to this shorter path.
Finally, after a period of operation, the shortest path may be repeated by most ants.
Ant colony algorithm is a bionic algorithm, which is inspired by the foraging behavior of ants in nature. In nature, in the process of ant foraging, ant colony can always find an optimal path from ant nest and food source. The following figure shows such a foraging process.
In figure (a), there is a group of ants. If a is the ant nest, E is the food source (and vice versa).
The ants will follow A straight path between the nest and the food source. If an obstacle suddenly appears between A and E (Figure (b)), then the ant at point B (or D) will have to make A decision, whether to drive left or right? Since there is no pheromone left by the ants in front at the beginning, the probability of ants moving in both directions is equal. But when an ant walks by, it will release pheromones on its way, and this pheromone will be released at A certain rate. Pheromone is one of the communication tools between ants. The ants behind it make decisions, left or right, based on the concentration of pheromones on the road. More and more ants will travel along the path c, which will attract more and more information.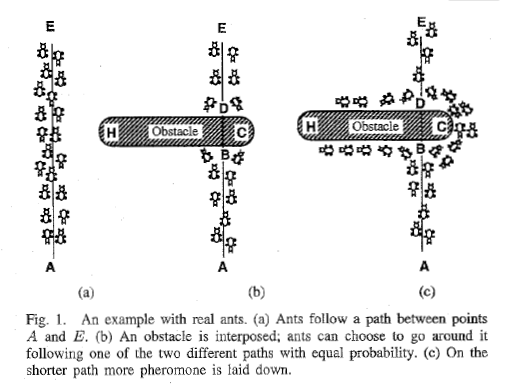
Principle of ant colony algorithm
- If the number of all ants in the ant colony is m, the pheromone between all cities is represented by matrix pheromone. The shortest path is bestLength and the best path is bestTour
- Each ant has its own memory, in which a Tabu is used to store the cities that the ant has visited, indicating that it will not be able to visit these cities in the future search
- An Allowed city table to store the cities it can also access
- Matrix (Delta) to store the pheromone it releases to the path it passes through in a loop (or iteration)
- There are also some additional data, such as some control parameters( α,β,ρ, Q)
- The total cost or tourLength of the ant walking the whole journey
- Assume that the algorithm runs Max in total_ Gen times, running time t.
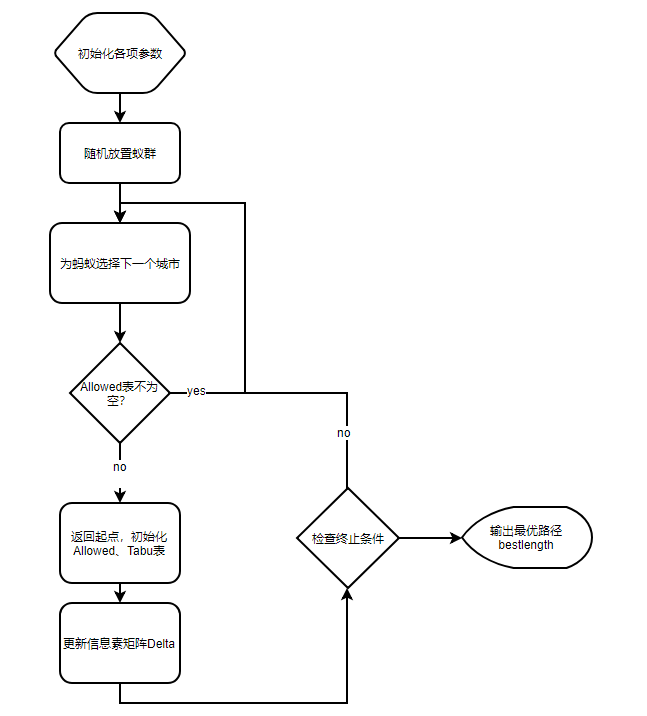
Description of algorithm flow (better effect if eaten in combination with flow chart)
(1) Initialize
Set t=0, initialize bestLength to a very large number (positive infinity), and bestTour is empty. Initialize the Delt matrix of all ants, initialize all elements to 0, clear the Tabu table, and add all city nodes to the Allowed table. Randomly select their starting positions (which can also be specified manually). Add a starting node in Tabu and remove it from Allowed.
(2) Select the next node for each ant
Select the next node for each ant. The node can only be searched with a certain probability (formula 1) from Allowed. For each one, add the node to tabu and delete the node from Allowed. The process is repeated n-1 times until all cities have been traversed once. After traversing all nodes, add the starting node to tabu. At this time, the number of elements in the tabu table is n+1 (n is the number of cities), and the number of Allowed elements is 0. Next, calculate the Delta matrix value of each ant according to (formula 2). Finally, calculate the best path, compare the path cost of each ant, and then compare it with bestLength. If its path cost is smaller than bestLength, give the value to bestLength and Its Tabu to BestTour.
(3) Update pheromone matrix Delta
(4) Check whether the termination condition reaches MAX_GEN times
(5) Output optimal value bestlength
algorithm flow chart
clc
clear all
close all
%The input image should have square size
%All parameters are set to be exactly same as that of the paper
%Image Loading
%filename = 'flower';
I=imread('1.jpg');
%img = double(imread(['C:\Users\yxw\Desktop.jpg']));
img=double(I);
figure(1)
imshow(img/255);
[nrow, ncol, channel] = size(img);
R=img(:, :, 1);
G=img(:, :, 2);
B=img(:, :, 3);
%Convert color image into gray image
intensity_img=zeros(nrow, ncol);
for rr = 1 : nrow
for cc = 1 : ncol
intensity_img(rr, cc)=(((R(rr, cc)).^2+(G(rr, cc)).^2+(B(rr, cc)).^2).^0.5)/(3.^0.5);
end
end
figure(2)
imshow(intensity_img/255);
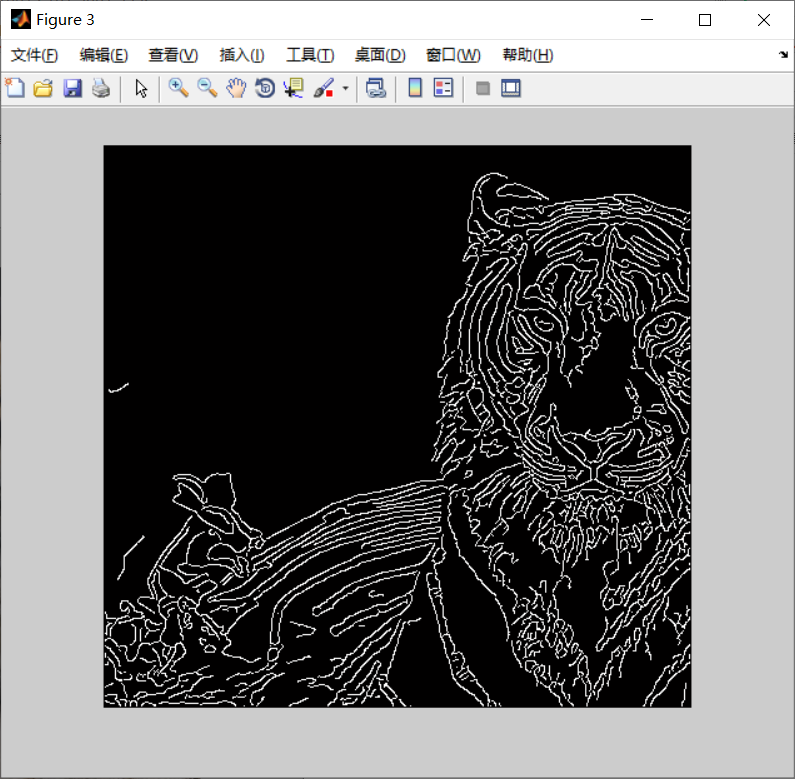
%use canny Operator for edge detection
edge_img = edge(intensity_img, 'canny');
figure(3)
imshow(edge_img);
%average = mean(mean(img))/255;
%Parameter setting
alpha=1;
beta=1;
num=0;%The initial number of supervised clustering centers is initialized to 0
statistic=60;
radius=50;% Cluster radius
lumda=0.40;
rho=0.95;
p1=1;
p2=1;
p3=1;
d=50;
%ACA Image segmentation program
%Initialize the image matrix with classification information
cluster_img = zeros(nrow, ncol, 4);
for rr=1:nrow
for cc=1:ncol
cluster_img(rr, cc, 1) = img(rr, cc, 1);
cluster_img(rr, cc, 2) = img(rr, cc, 2);
cluster_img(rr, cc, 3) = img(rr, cc, 3);
cluster_img(rr, cc, 4) = 0;
end
end
%Initialize ant classification operation matrix
ant_matrix=zeros(rr, cc, 1);
for rr=1:nrow
for cc=1:ncol
if ant_matrix(rr, cc, 1) == 0
ant_matrix(rr, cc, 1) = 2;%ant_matrix(rr, cc, 1)Represents the state of the ant,"0"Indicates not classified,"1"Indicates that it has been classified,"2"Indicates waiting to be classified, "3"Indicates that it becomes a class in this loop, "4"Indicates that the point is an edge pixel
end
end
end
for rr = 1 : nrow
for cc = 1 : ncol
if edge_img(rr, cc)==1
ant_matrix(rr, cc, 1) = 4;%Divided into edge pixels
cluster_img(rr, cc, 1)=255;
cluster_img(rr, cc, 2)=255;
cluster_img(rr, cc, 3)=255;%Set all edge pixels to white;
end
end
end
%Initialize supervised clustering center
%Statistics of image color
color_statistic = zeros(1331, 5);%color_statistic(i, 1)Number of stored pixels,
%color_statistic(i, 2),color_statistic(i, 3),color_statistic(i, 4)Store three components of color respectively, color_statistic(i, 5)Store information on whether it is used as a supervisory clustering center
for rr = 1 : nrow
for cc = 1 : ncol
%Segment each color component
if R(rr, cc) < 12.75
x=1;
elseif R(rr, cc) >= 12.75 && R(rr, cc) < 38.25
x=2;
elseif R(rr, cc) >= 38.25 && R(rr, cc) < 63.75
x=3;
elseif R(rr, cc) >= 63.75 && R(rr, cc) < 89.25
x=4;
elseif R(rr, cc) >= 89.25 && R(rr, cc) < 114.75
x=5;
elseif R(rr, cc) >= 114.75 && R(rr, cc) < 140.25
x=6;
elseif R(rr, cc) >= 140.25 && R(rr, cc) < 165.75
x=7;
elseif R(rr, cc) >= 165.75 && R(rr, cc) < 191.25
x=8;
elseif R(rr, cc) >= 191.25 && R(rr, cc) < 216.75
x=9;
elseif R(rr, cc) >= 216.75 && R(rr, cc) < 241.25
x=10;
elseif R(rr, cc) >= 241.25
x=11;
end
if G(rr, cc) < 12.75
y=1;
elseif G(rr, cc) >= 12.75 && G(rr, cc) < 38.25
y=2;
elseif G(rr, cc) >= 38.25 && G(rr, cc) < 63.75
y=3;
elseif G(rr, cc) >= 63.75 && G(rr, cc) < 89.25
y=4;
elseif G(rr, cc) >= 89.25 && G(rr, cc) < 114.75
y=5;
elseif G(rr, cc) >= 114.75 && G(rr, cc) < 140.25
y=6;
elseif G(rr, cc) >= 140.25 && G(rr, cc) < 165.75
y=7;
elseif G(rr, cc) >= 165.75 && G(rr, cc) < 191.25
y=8;
elseif G(rr, cc) >= 191.25 && G(rr, cc) < 216.75
y=9;
elseif G(rr, cc) >= 216.75 && G(rr, cc) < 241.25
y=10;
elseif G(rr, cc) >= 241.25
y=11;
end
if B(rr, cc) < 12.75
z=1;
elseif B(rr, cc) >= 12.75 && B(rr, cc) < 38.25
z=2;
elseif B(rr, cc) >= 38.25 && B(rr, cc) < 63.75
z=3;
elseif B(rr, cc) >= 63.75 && B(rr, cc) < 89.25
z=4;
elseif B(rr, cc) >= 89.25 && B(rr, cc) < 114.75
z=5;
elseif B(rr, cc) >= 114.75 && B(rr, cc) < 140.25
z=6;
elseif B(rr, cc) >= 140.25 && B(rr, cc) < 165.75
z=7;
elseif B(rr, cc) >= 165.75 && B(rr, cc) < 191.25
z=8;
elseif B(rr, cc) >= 191.25 && B(rr, cc) < 216.75
z=9;
elseif B(rr, cc) >= 216.75 && B(rr, cc) < 241.25
z=10;
elseif B(rr, cc) >= 241.25
z=11;
end
%Update statistics
color_statistic(((x-1)*121+(y-1)*11+z), 2) = (color_statistic(((x-1)*121+(y-1)*11+z), 2) * color_statistic(((x-1)*121+(y-1)*11+z), 1) + R(rr, cc)) / (color_statistic(((x-1)*121+(y-1)*11+z), 1) + 1);
color_statistic(((x-1)*121+(y-1)*11+z), 3) = (color_statistic(((x-1)*121+(y-1)*11+z), 3) * color_statistic(((x-1)*121+(y-1)*11+z), 1) + G(rr, cc)) / (color_statistic(((x-1)*121+(y-1)*11+z), 1) + 1);
color_statistic(((x-1)*121+(y-1)*11+z), 4) = (color_statistic(((x-1)*121+(y-1)*11+z), 4) * color_statistic(((x-1)*121+(y-1)*11+z), 1) + B(rr, cc)) / (color_statistic(((x-1)*121+(y-1)*11+z), 1) + 1);
color_statistic(((x-1)*121+(y-1)*11+z), 1) = color_statistic(((x-1)*121+(y-1)*11+z), 1) + 1;
end
end
for i = 1 : 1331
if color_statistic(i, 1) >= statistic
num = num +1;%Determine the number of supervised clustering centers
color_statistic(i, 5) = 1;
end
end
center_ACA=zeros(num, 5);
for i=1 : num
for j = 1 : 1331
if (color_statistic(j, 1) >= statistic) && (color_statistic(j, 5)==1)
center_ACA(i, 1) = color_statistic(j, 2);
center_ACA(i, 2) = color_statistic(j, 3);
center_ACA(i, 3) = color_statistic(j, 4);
color_statistic(j, 5) = 0;%Has been used as a supervised clustering center
center_ACA(i, 5)=1;%center_ACA(i, 4)Used to store the number of pixels of this class, initialized to 0,center_ACA(i, 5)Used to store the pheromone concentration of this class
break
end
end
end
ant_info = zeros (num, 5);
%ant_info((r-1)*ncol+c, 1) The distance stored to this point; ant_info((r-1)*ncol+c, 2) Store the pheromone of the point; ant_info((r-1)*ncol+c,3) Heuristic function stored at this point
%ant_info((r-1)*ncol+c, 4) The probability of storing to this point; ant_info((r-1)*ncol+c, 5)Storage category
%main program
sum_ph=0;%Denominator of probability formula
do=0;%Judge whether the main program should continue to cycle
do2=1;%Judge whether the class merging program should continue to cycle
judge=zeros(nrow, ncol);%A matrix that determines whether this class can be merged with other classes
n=0;%judge ACA Number of main program cycles
m=0;%Determine the number of cycles of class merging program
while (do<=500)
%Pixel clustering
for rr = 1 : nrow
for cc = 1 : ncol
if ant_matrix(rr, cc, 1)==0
ant_matrix(rr, cc, 1) = 2;%Change the status of unclassified ants in the previous cycle to be clustered
end
end
end
for rr = 1 : nrow
for cc = 1 : ncol
%Calculate pixel(rr, cc)Distance to each cluster center, pheromone and other information
if ant_matrix(rr, cc, 1)==2
ant_info = zeros(num, 6);
sum_ph=0;
for i = 1 : num
ant_info(i, 1) = sqrt(p1 * (R(rr, cc) - center_ACA(i, 1)).^2 + p2 * (G(rr, cc) - center_ACA(i, 2)).^2 + p3 * (B(rr, cc) - center_ACA(i, 3)).^2);
ant_info(i, 2) = center_ACA(i, 5);
ant_info(i, 3)=radius/(ant_info(i, 1)+0.00001);%When the guaranteed distance is 0, the heuristic function is large but not infinite.
sum_ph = sum_ph + ant_info(i, 2).^alpha + ant_info(i, 3).^beta;
ant_info(i, 5) = i;
end
%Calculate the probability to each cluster center
for i=1:num
ant_info(i, 4) = (ant_info(i, 2).^alpha + ant_info(i, 3).^beta)/sum_ph;
end
rand('state', sum(100*clock));
temp = find(cumsum(ant_info(:, 4)) >= rand(1), 1);
%Probability selection calculation of path
if ant_info(temp, 4) >= lumda
ant_matrix(rr, cc, 1) = 1;%The pixel has been classified
cluster_img(rr, cc, 4) = temp;%Record the category of the pixel
center_ACA(temp, 4) = center_ACA(temp, 4) + 1;%The number of pixels included in the cluster is increased by 1
if ant_info(temp, 1) <= radius
center_ACA(temp, 5) = center_ACA(temp, 5) + 1;%If the distance is less than radius,Then pheromone plus 1
end
else
ant_matrix(rr, cc, 1) = 0;%The pixel is not classified and the status changes to 0
end
end
end
end
%Update cluster center information
for i = 1 : num
if ~(center_ACA(i, 4)==0)
sum1=0;
sum2=0;
sum3=0;
for rr = 1 : nrow
for cc = 1 : ncol
if cluster_img(rr, cc, 4)==i
sum1 = sum1 + cluster_img(rr, cc, 1);
sum2 = sum2 + cluster_img(rr, cc, 2);
sum3 = sum3 + cluster_img(rr, cc, 3);
end
end
end
center_ACA(i, 1) = sum1 / center_ACA(i, 4);
center_ACA(i, 2) = sum2 / center_ACA(i, 4);
center_ACA(i, 3) = sum3 / center_ACA(i, 4);
end
end
%Interclass merge
%Initialize judgment matrix
while(do2==1)
judge=zeros(num, 1);
for i = 1 : num
if ~(center_ACA(i, 4)==0)
judge(i, 1)=1;
end
end
for i = 1 : num
if ~(center_ACA(i, 4)==0)
cluster_info = zeros(num, 2);%Record the distance between classes
temp=[d; 0];%The first record is the last distance value and the second record category
for j = 1 : num
if (~(j==i))&&(~(center_ACA(j, 4)==0))
cluster_info(j, 1) = sqrt((center_ACA(i, 1) - center_ACA(j, 1)).^2 + (center_ACA(i, 2) - center_ACA(j, 2)).^2 + (center_ACA(i, 3) - center_ACA(j, 3)).^2);
cluster_info(j, 2) = j;
end
end
for j = 1 : num
if cluster_info(j, 1)<temp(1,1) && (~(j==i)) && (~(center_ACA(j, 4)==0))
temp(1, 1)=cluster_info(j, 1);
temp(2, 1)=cluster_info(j, 2);
%Calculate the closest class
end
end
if temp(1,1)<d
for rr = 1 : nrow
for cc = 1 : ncol
if cluster_img(rr, cc, 4)==i;
cluster_img(rr, cc, 4) = temp(2,1);
%In the pixel classification matrix,(rr, cc)The pixels of the points are classified
end
end
end
center_ACA(temp(2, 1), 1) = (center_ACA(temp(2, 1), 1) * center_ACA(temp(2, 1), 4) + center_ACA(i, 1) * center_ACA(i, 4)) / (center_ACA(temp(2, 1), 4) + center_ACA(i, 4));
center_ACA(temp(2, 1), 2) = (center_ACA(temp(2, 1), 2) * center_ACA(temp(2, 1), 4) + center_ACA(i, 2) * center_ACA(i, 4)) / (center_ACA(temp(2, 1), 4) + center_ACA(i, 4));
center_ACA(temp(2, 1), 3) = (center_ACA(temp(2, 1), 3) * center_ACA(temp(2, 1), 4) + center_ACA(i, 3) * center_ACA(i, 4)) / (center_ACA(temp(2, 1), 4) + center_ACA(i, 4));
center_ACA(temp(2, 1), 4) = center_ACA(temp(2, 1), 4) + center_ACA(i, 4);
center_ACA(temp(2, 1), 5) = center_ACA(temp(2, 1), 5) + center_ACA(i, 5);%max(center_ACA(temp(2, 1), 5), center_ACA(i, 5)) + 0.3 * min(center_ACA(temp(2, 1), 5), center_ACA(i, 5));
center_ACA(i, 4) = 0;
center_ACA(i, 5) = 0;
judge(i, 1)=0;
judge(temp(2, 1), 1)=1;
else
judge(i, 1)=0;
end
end
end
do2=0;
for i = 1 : num
if judge(i, 1) == 1
do2=1;
break
end
end
end
%Pheromone volatilization
for i = 1 : num
center_ACA(i, 5) = center_ACA(i, 5) * rho;
end
do = do + 1 %Once per cycle do
end
for rr = 1 : nrow
for cc = 1 : ncol
if ant_matrix(rr, cc, 1)==1
cluster_img(rr, cc, 1) = center_ACA(cluster_img(rr, cc, 4), 1);
cluster_img(rr, cc, 2) = center_ACA(cluster_img(rr, cc, 4), 2);
cluster_img(rr, cc, 3) = center_ACA(cluster_img(rr, cc, 4), 3);
elseif ant_matrix(rr, cc, 1)==0
cluster_img(rr, cc, 1) = 0;
cluster_img(rr, cc, 2) = 0;
cluster_img(rr, cc, 3) = 0;
end
end
end
%figure(),imshow(cluster_img(:, :, 1:3)./255);
imwrite(cluster_img(:, :, 1:3)./255, 'Result1.bmp', 'bmp');
%FCM main program
C = num;%The number of classes is C
m = 2;%Class parameter setting
e = nrow * ncol * C * (0.01).^2;
sum_d = e+1;
%Initialization class matrix
center_FCM = zeros(C, 3);
for i = 1 : C
center_FCM(i, 1) = center_ACA(i, 1);
center_FCM(i, 2) = center_ACA(i, 2);
center_FCM(i, 3) = center_ACA(i, 3);
end
%Initialize distance matrix
distance=zeros(C, 1);
%utilize ACA Initialization membership matrix of running results
subjection = zeros(nrow, ncol, C);
subjection_temp = zeros(nrow, ncol, C);
for rr = 1 : nrow
for cc = 1 : ncol
if ~(ant_matrix(rr, cc, 1)==4)
for i = 1 : C
distance(i, 1) = sqrt((R(rr, cc)-center_FCM(i, 1)).^2 + (G(rr, cc)-center_FCM(i, 2)).^2 + (B(rr, cc)-center_FCM(i, 3)).^2);
end
do = 1;
for i = 1 : C
if distance(i, 1) == 0
subjection(rr, cc, i) = 1;%If the distance between a pixel and the cluster center is 0, its membership degree is 1
for j = 1 : C
if ~(j==i)
subjection(rr, cc, j) = 0;
do = 0;
end
end
end
break
end
if do == 1
normalize = 0;
for i = 1 : C
sum_distance = 0;
for j = 1 : C
sum_distance = sum_distance + (distance(i, 1)/distance(j, 1)).^(2/(m-1));
end
subjection(rr, cc, i) = 1 / sum_distance;
normalize = normalize + subjection (rr, cc, i);
end
for i = 1 : C
subjection(rr, cc, i) = (1 / normalize) * subjection(rr, cc, i);%Membership normalization
end
end
end
end
end
end
figure
imshow(cluster_img2(:, :, 1:3)./255)
% center_FCM
%cluster_img2(:, :, 4)
imwrite(cluster_img2(:, :, 1:3)./255, 'Result2.bmp', 'bmp');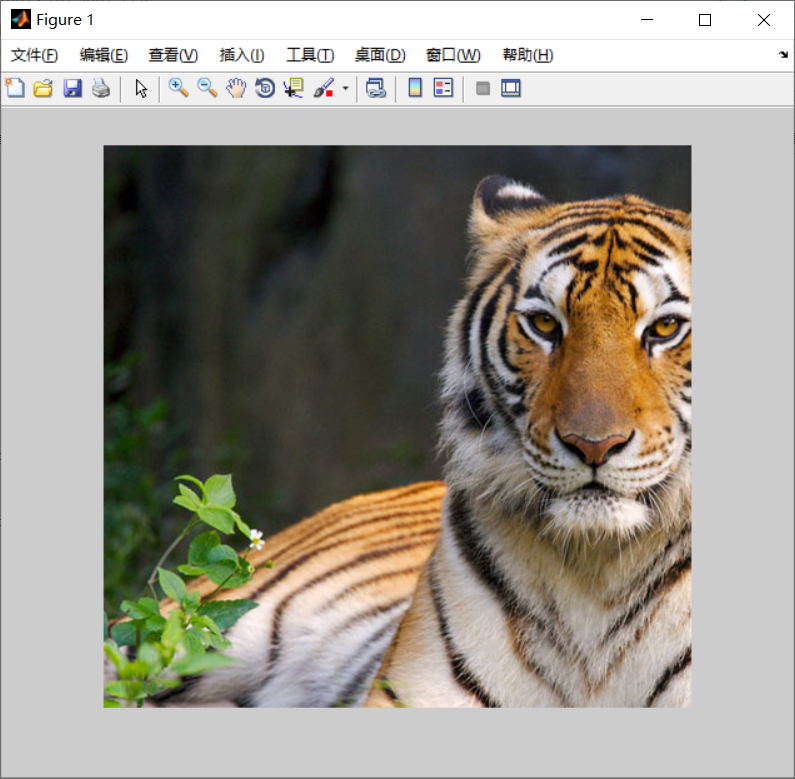
Complete code or write on behalf of QQ1575304183