1, Overview of wavelet threshold denoising
The noise of power quality disturbance signal mostly exists in the form of Gaussian white noise. Wavelet transform is used for multi-resolution decomposition of the signal. Because wavelet transform has the characteristics of removing data correlation, it can separate the energy of useful signal and noise. The effective information in the signal is mainly concentrated in the larger wavelet coefficients, and the noise is mostly distributed in the smaller coefficients. Therefore, by setting the threshold, the coefficients lower than the threshold can be removed as noise, so as to achieve the purpose of filtering.
Suppose a linear, nonstationary and noisy one-dimensional signal, the expression is as follows:

Where f(t) is the original signal, ε (t) Is Gaussian white noise, and x(t) is noisy signal. Then, according to the characteristics of the signal, one-dimensional discrete wavelet transform is performed on x(t) by using appropriate wavelet basis and decomposition layers:
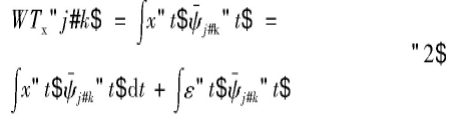
Among them, ψ (t) Is a discrete wavelet scaling function. The expression of wavelet coefficient corresponding to equation (2) is:
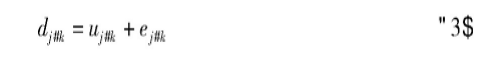
Among them, dj,k are wavelet detail coefficients of each layer of noisy signal x(t) after multi-scale decomposition of wavelet transform, uj,k and ej,k are original signal f(t) and noise signal respectively ε (t) The detail coefficient after multi-scale decomposition of wavelet transform. The flow chart of denoising based on wavelet threshold is shown in Figure 1.
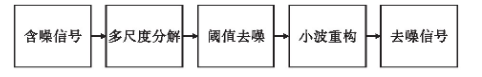
Figure 1 wavelet denoising process
The specific steps of wavelet threshold denoising are as follows:
(1) Multi-scale decomposition: according to the characteristics of noisy signals, select the appropriate wavelet base and decomposition layers, and obtain the wavelet detail coefficients dj,k of each layer through discrete wavelet transform;
(2) Threshold denoising: by determining the threshold λ And threshold function to process the wavelet detail coefficients dj,k, and obtain the processed wavelet detail coefficients d'j,k of each layer;
(3) Wavelet reconstruction: reconstruct the power quality disturbance signal according to the obtained wavelet detail coefficients d'j,k and approximate coefficients to obtain the denoised disturbance signal x '(t).
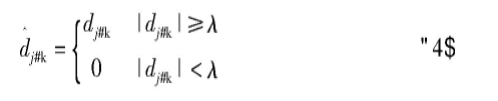
In these steps, the selection of threshold and threshold function is the key of wavelet threshold denoising, which directly affects the quality of reconstructed signal. If the selected threshold is too large, it will cause the useful signal to be filtered as noise; If the threshold is too small, the noise filtering is not thorough enough. The traditional hard and soft threshold functions are as follows:
Definition of soft threshold function:
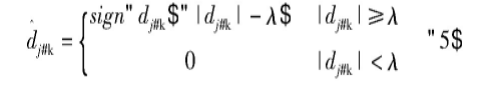
Where sign(dj,k) is the sign function and N is the signal length; σ= Mmid/0.6745,Mmid is the median of wavelet coefficients of the lowest layer. According to the hard and soft threshold functions, after wavelet multi-scale decomposition of the noisy signal, the detail coefficient of each layer is compared with the threshold, the coefficient greater than the threshold is retained, and the coefficient less than the threshold is set to zero, so as to obtain the detail coefficient after noise removal. However, the hard threshold function is not continuous in the signal length λ There are discontinuities at the, which makes the reconstructed signal not smooth enough, and the "Gibbs" phenomenon will occur after the reconstructed signal. Although the soft threshold function ensures the continuity, there is a fixed deviation between the estimated noise value and the real value, which is not only easy to cause the incomplete noise removal, but also may lose some useful information.
Improved method of wavelet threshold denoising
Through the analysis of the hard and soft thresholds in the previous section, it can be seen that the traditional wavelet threshold denoising method is constant for the setting of the wavelet coefficient threshold of each layer, but the noise is different in the wavelet coefficients of each layer. Therefore, the self adaptability of using a fixed threshold is poor and the denoising effect is not ideal. In order to solve these problems, an improved wavelet threshold denoising algorithm is proposed. It will adaptively modify the threshold according to the noise distribution, and its threshold function can realize a variety of different soft and hard features through variable parameters, making it more suitable for a variety of different types of power quality disturbance signals.
2.1 threshold correction
As the boundary between effective information and noise, the selection of threshold directly affects the denoising effect. The traditional general threshold does the same processing for the wavelet detail coefficients of each scale, but the noise distribution is random. Using a fixed threshold for processing will cause the loss of useful information on some scales, and the noise filtering on some scales is not clean enough, so it can not achieve a better denoising effect. Considering that the wavelet detail coefficient of noise decreases with the increase of scale, while the wavelet detail coefficient of signal increases with the increase of scale. Therefore, in order to make the value of threshold more in line with the variation law of noise, this chapter combines the peak to sum ratio (PSR) in literature [7], and proposes a correction factor based on PSR to correct the general threshold. The formula of peak to sum ratio of wavelet detail coefficient in layer j is as follows:
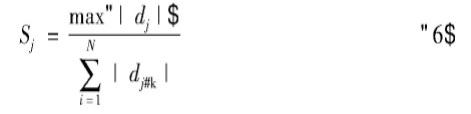
Where DJ and K are wavelet detail coefficients. In the multi-scale decomposition of wavelet, the useful information of signal is mainly concentrated in the larger wavelet detail coefficients, while the noise components are scattered in the wavelet detail coefficients of each layer. Therefore, when the Sj value is large, it means that there is a large coefficient in this scale, indicating that this layer contains more useful information; A small Sj value means that there is a small coefficient in this scale, indicating that this layer contains more noise. Based on this feature, the correction factor Fj is introduced as:
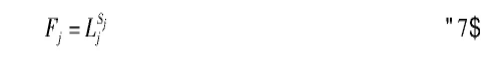
Where Lj is the length of wavelet detail coefficient of layer J. Fj and ln(j+1) are combined to adaptively adjust the threshold. The corrected threshold is:
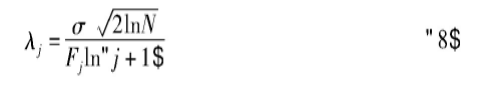
From equation (8), it can be seen that ln(j+1) increases gradually with the increase of J, and the corresponding threshold decreases gradually, which conforms to the general law of noise distribution.
2.2 improved threshold function
In order to overcome the problem that the traditional hard threshold function is discontinuous at the threshold and the soft threshold function will cause the loss of some high-frequency information, a new threshold function is proposed as follows:
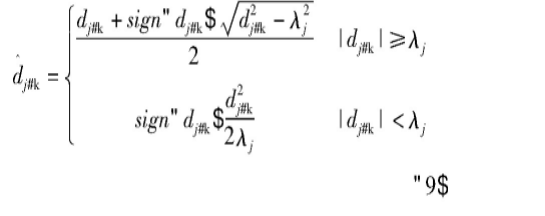
Where the sign function is a symbolic function. The threshold function is in (-!, +!) Internal continuity, proved as follows:
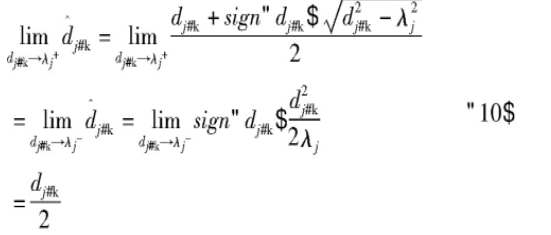
The function is in λ Continuous at j, similarly, the function can be obtained at- λ j is also continuous. It is proved that it does overcome the problem of discontinuity of hard threshold function at the threshold. And the threshold function is in dj,k →±! It is equivalent to hard threshold function. The certificate is as follows:
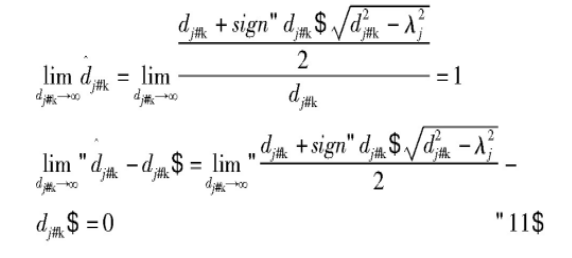
It can be seen from the above formula that with the increase of wavelet detail coefficients DJ and K, the new threshold function curve gradually approaches the hard threshold function, which overcomes the problem of constant deviation of soft threshold function. The schematic diagram of the new threshold function is shown in Figure 2.
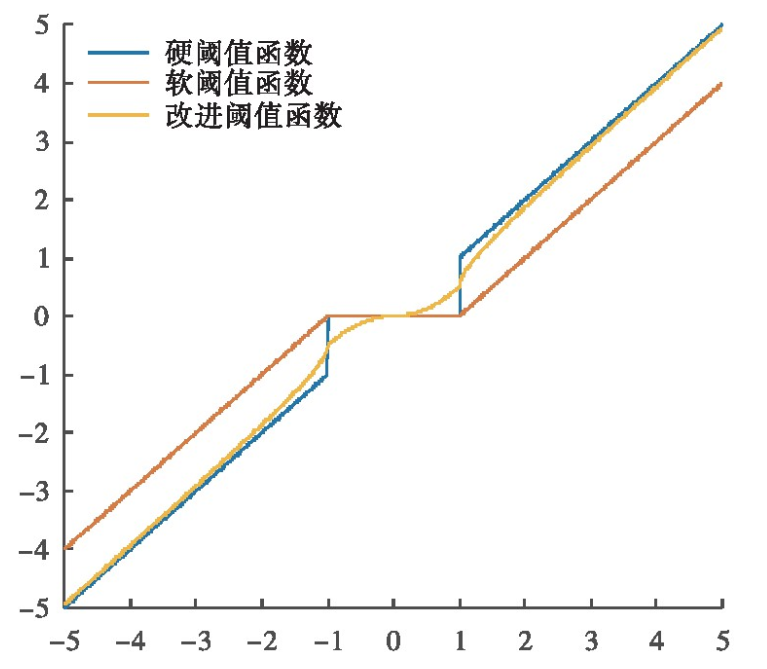
Figure 2 curve of new threshold function
2.3 wavelet basis and decomposition layers
When using wavelet transform to denoise, locate mutation points and extract features of power quality disturbance signals, the selection of wavelet basis is very important. Only by selecting the appropriate wavelet basis, can the power quality disturbance be analyzed accurately. Therefore, in practical application, it is necessary to select the appropriate wavelet base according to the characteristics of the selected signal.
The essence of wavelet transform is the process of approximating the original signal with a series of wavelet functions. For the same signal, different wavelet bases are selected, and the results of wavelet transform are also different. According to the characteristics of its waveform, wavelet transform analysis of power quality signal needs to adopt wavelet which has good locality in time domain and frequency domain and is sensitive to irregular parts. Traditional soft and hard threshold functions are usually used to investigate the effect of wavelet transform on signal denoising. In order to verify the denoising effect, signal noise ratio (SNR) and root mean square error (RMSE) are usually used as evaluation criteria. The definition expression is as follows:
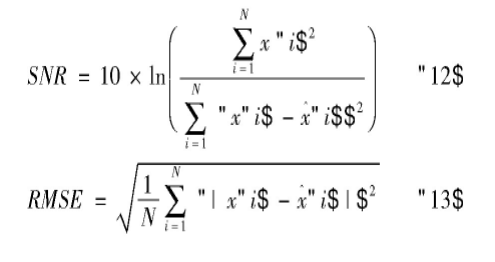
When the signal-to-noise ratio (SNR) is higher and the root mean square error (RMSE) is lower, it is proved that the denoising effect of the signal is better. Here, the voltage interruption disturbance signal is selected as the original data, and the wavelet threshold denoising is carried out by combining different types of wavelet basis functions with soft and hard threshold functions.
2, Partial source code
N=1024;n1=7;
n=0:N-1;
Fs=500;
t=n/Fs;
x=sin(2*pi*10*t);
y=rand(1,1024);
for i=1:length(y)
if y(1,i)>0.98
y(i)=3;
else y(1,i)=0;
end
end
signal=x+y;
xref=x;
points=1024; level=4; sr=360; num_inter=6; wf='db3';
%Length of data processed Decomposition series sampling rate Number of iterations Wavelet name
offset=0;
%%=======Binary wavelet transform (discrete stationary wavelet transform),Give the overview and detailed waveform at all levels:=====%%
[Lo_D,Hi_D,Lo_R,Hi_R]=wfilters(wf); %call wfilters To obtain the decomposition and reconstruction filter coefficients of the specified wavelet,wf For wavelet
[swa,swd] = swt(signal,level,Lo_D,Hi_D);%Calculate low frequency coefficient SWA And high frequency coefficient SWD Isostationary wavelet coefficient
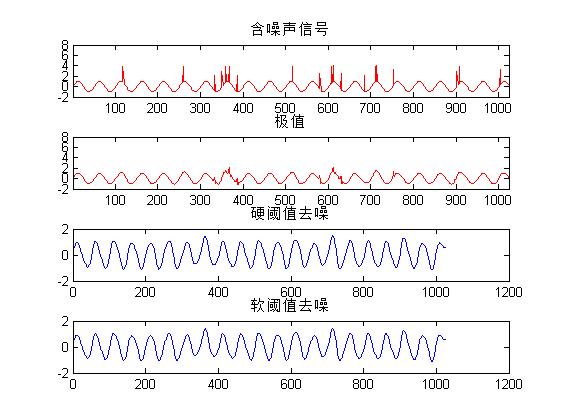
figure;
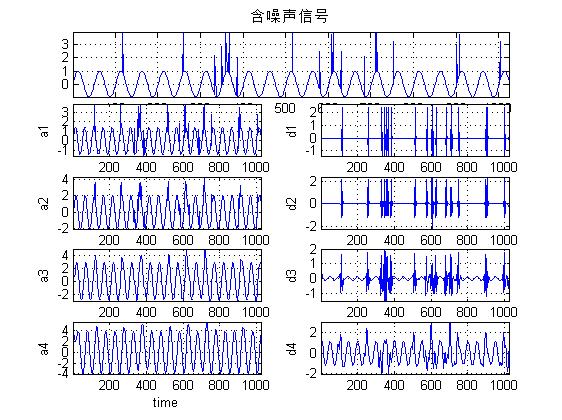
subplot(level,1,1); plot(real(signal));
title('Noisy signal'),grid on;axis tight;
for i=1:level
subplot(level+1,2,2*(i)+1);
plot(swa(i,:)); axis tight;grid on;xlabel('time');
ylabel(strcat('a ',num2str(i)));
subplot(level+1,2,2*(i)+2);
plot(swd(i,:)); axis tight;grid on;
ylabel(strcat('d ',num2str(i)));
end
%____Figure 1 It is the original signal with noise and each level Approximate and detail wavelet coefficients of wavelet analysis
%%=======Finding the modulus maxima and its position of wavelet transform,The waveforms of modulus maxima of wavelet transform are given by level=====%%
% swa:Wavelet overview; swd:Wavelet detail;
% ddw:Local maximum position; wpeak:Local maximum sequence of wavelet transform.
%Finding the modulus maxima and its position of wavelet transform
ddw=zeros(size(swd));
pddw=ddw;
nddw=ddw;
posw=swd.*(swd>0);
pdw=((posw(:,1:points-1)-posw(:,2:points))<0);
pddw(:,2:points-1)=((pdw(:,1:points-2)-pdw(:,2:points-1))>0);
negw=swd.*(swd<0);
ndw=((negw(:,1:points-1)-negw(:,2:points))>0);
nddw(:,2:points-1)=((ndw(:,1:points-2)-ndw(:,2:points-1))>0);
ddw=pddw|nddw;
ddw(:,1)=1;
ddw(:,points)=1;
wpeak=ddw.*swd;
wpeak(:,1)=wpeak(:,1)+1e-10;
wpeak(:,points)=wpeak(:,points)+1e-10;
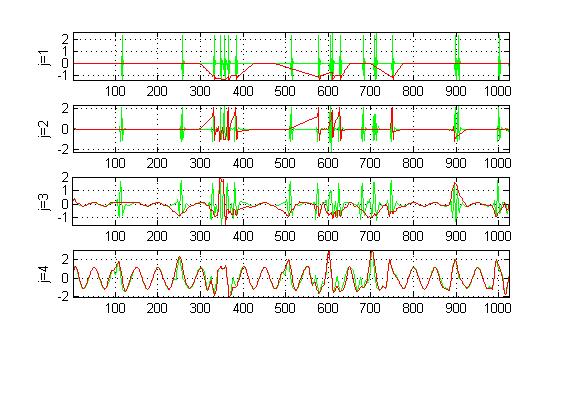
%The waveform of modulus maxima of wavelet transform is given by level
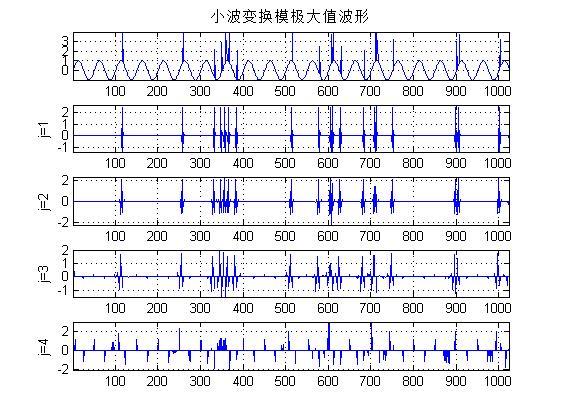
figure;
subplot(level+1,1,1); plot(real(signal)); grid on;axis tight;
title('Wavelet transform modulus maxima waveform'),grid on;axis tight;
for i=1:level
subplot(level+1,1,i+1);
plot(wpeak(i,:)); axis tight;grid on; %Maximum sequence
ylabel(strcat('j= ',num2str(i)));
end
%____Figure 2 Modulus maxima of wavelet transform and its position,The waveforms of modulus maxima of wavelet transform are given by level
%
%%%%%==================Processing of modulus maxima=======================%%
C=0.8;
%This parameter needs to be adjusted in order to set an appropriate threshold on the maximum scale to determine the reserved modulus maximum point on the maximum scale.
D4_wpeak=wpeak(level,:);
M=max(D4_wpeak);
Thr=C*M/level; %For threshold calculation, refer to the following paper:"3mm Research on band pulse radar system and wavelet denoising analysis".
D4_wpeak=D4_wpeak.*(abs(D4_wpeak)>Thr);
%Processing method of modulus maxima:
%In scale j At the position of the upper maximum point, a search area is constructed,
%In scale j-1 In, the point where the maximum value point falls in this area is reserved, and the others are set to 0;
D3_wpeak=wpeak(level-1,:);
D4_p=(D4_wpeak~=0);
O_d4=3;%This parameter determines the range of searching the maximum value at the upper level and can be adjusted.
for P_d4=O_d4:(length(D4_wpeak)-O_d4);
if D4_p(P_d4)==1;
for i=1:O_d4-1;
D4_p(P_d4-i)=1;
end ;
end;
end;
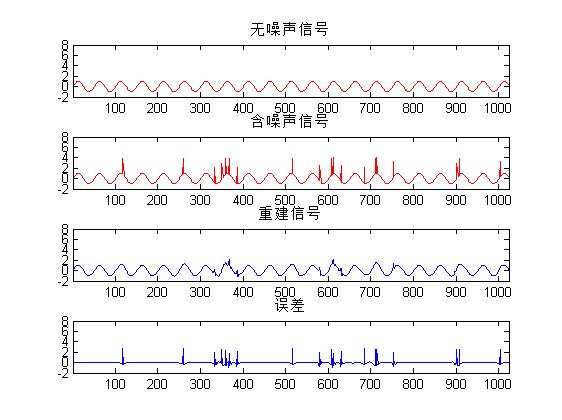
3, Operation results
4, matlab version and references
1 matlab version
2014a
2 references
[1] Shen Zaiyang Proficient in MATLAB signal processing [M] Tsinghua University Press, 2015
[2] Gao Baojian, Peng Jinye, Wang Lin, pan Jianshou Signal and system -- Analysis and implementation using MATLAB [M] Tsinghua University Press, 2020
[3] Wang Wenguang, Wei Shaoming, Ren Xin MATLAB implementation of signal processing and system analysis [M] Electronic Industry Press, 2018
[4] Zheng Wei Denoising algorithm of power quality disturbance signal based on improved wavelet threshold [J] Electrical switch 2021,59(01)