Training data generation
Modification of configuration file
This article takes the human hand detection as an example (there is only one label: hand)
- Add or modify data / hand Names file, which records labels, one label per line (Note: labels corresponding to training data)
- Add or modify CFG / hand Data file, the contents of which are as follows:
classes= 1  # Number of categories of your own dataset (excluding background classes)
train  = /home/xxx/darknet/train.txt  # Path to the train file
valid  = /home/xxx/darknet/test.txt   # Path to test file
names = /home/xxx/darknet/data/hand.names
backup = /home/xxx/darknet/backup   # Generate a weight storage folder. If it does not exist, it needs to be created in advance
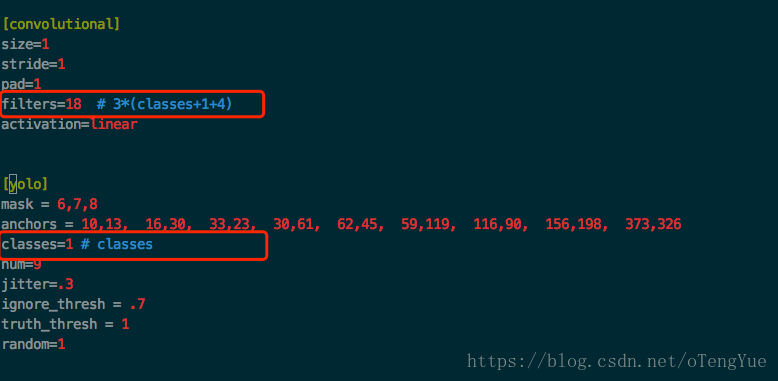
- Modify CFG / yolov3 Cfg file
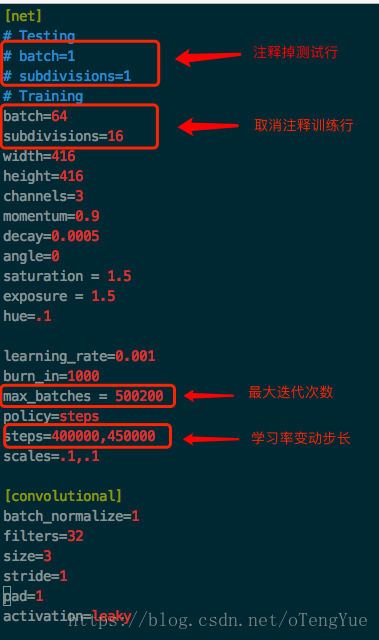
As shown in the figure, modify 3 places, query and locate directly according to the "yolo" keyword, and then modify according to the notes:
Using darknet training model
matters needing attention:
- . data file. The file contains some configuration information, including the total number of training categories, the path of training data and verification data, category name, model storage path, etc.
- When reading the training data, only the path of the picture is input to the program, but the path of the label data is not directly given, which is obtained by modifying the picture path. (the premise of replacement is that the label data folder labels has the same parent directory as the picture data folder images. In addition, it is no problem to directly put the txt label file in the same path as the picture.)
- . cfg file. It mainly contains some configuration information of training, such as input image size, learning rate, data enhancement, etc. It also includes the network structure of training.
See: Detailed description of precautions
Model training command
./darknet detector test <data_cfg> <models_cfg> <weights> <test_file> [-thresh] [-out]
./darknet detector train <data_cfg> <models_cfg> <weights> [-thresh] [-gpu] [-gpus] [-clear]
./darknet detector valid <data_cfg> <models_cfg> <weights> [-out] [-thresh]
./darknet detector recall <data_cfg> <models_cfg> <weights> [-thresh]
'< >' required and '[]' optional
- data_cfg: data configuration file, eg: CFG / VOC data
- models_cfg: model configuration file, eg: CFG / yolov3 VOC cfg
- Weights: weight profile, eg: weights / yolov3 weights
- test_file: test file, eg: / / * / test txt
- -Thresh: displays the bounding box with confidence greater than or equal to [- thresh] in the detected object. The default value is 0.005
- -Out: the name of the output file. The default path is under the results folder. eg: - out "" / / output class_num files named class_name.txt; If this option is not selected, the default output file name is comp4_det_test_ “class_name”. txt
- -i/-gpu: specify a single gpu, the default is 0, eg: - gpu 2
- -gpus: specify multiple gpus. The default is 0. eg: - gpus 0,1,2
Train the model and save the log (save to the log.txt file under the current file):
./darknet detector train cfg/voc.data cfg/yolov3-tiny.cfg backup202106032111/yolov3-tiny.backup > results/log.txt
Training model visualization
yolov3 training log visualization is mainly the visualization of loss and iou curves, which is an important basis for us to view the training effect.
Among them, screenshot of log information printed on the console during darknet training:
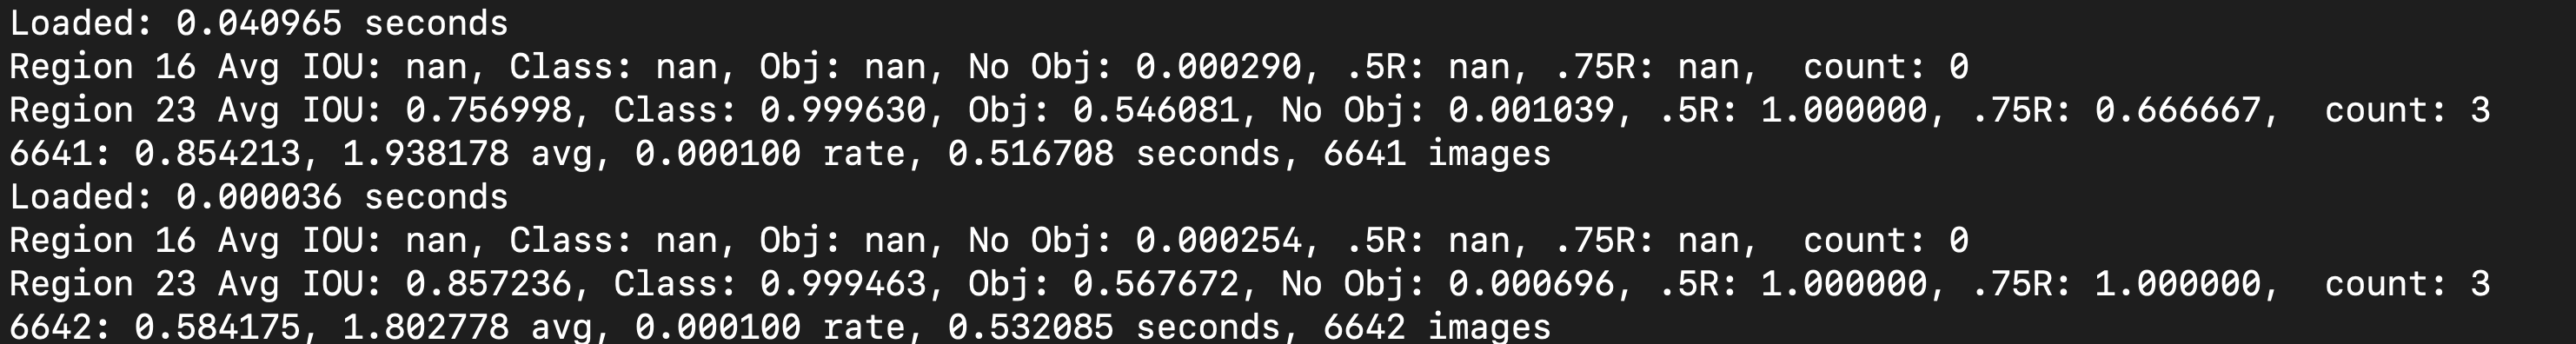
log parsing information:
- Aug IOU: in the current iteration, the larger the average intersection and union ratio between the predicted box and the marked box, the better. The expected value is 1;
- Class: the classification accuracy of marked objects. The larger the better. The expected value is 1;
- obj: the bigger the better. The expected value is 1;
- No obj: the smaller the better;
- . 5R: recall with IOU=0.5 as the threshold; Recall = detected positive sample / actual positive sample
- 0.75R: recall with IOU=0.75 as the threshold;
- count: number of positive samples.
Note: the existence of nan value indicates that the sub batch has not predicted positive samples, which is a normal phenomenon at the beginning of training.
Output meaning of each batch in the next line:
- Which batch: total loss, average loss, current learning rate, training time of the current batch, and the total number of pictures participating in training so far
Model training visualization script:
#coding=utf-8
import os
import pandas as pd
import numpy as np
import matplotlib.pyplot as plt
import logging
logging.basicConfig(
    level=logging.DEBUG,
    format='%(asctime)s %(levelname)s: %(message)s',
    datefmt='%Y-%m-%d %H:%M:%S'
)
logger = logging.getLogger(__name__)

class Yolov3LogVisualization:

    def __init__(self,log_path,result_dir):

        self.log_path = log_path
        self.result_dir = result_dir

    def extract_log(self, save_log_path, key_word):
        with open(self.log_path, 'r') as f:
            with open(save_log_path, 'w') as train_log:
                next_skip = False
                for line in f:
                    if next_skip:
                        next_skip = False
                        continue
                    # Remove the synchronization log of multiple GPUs
                    if 'Syncing' in line:
                        continue
                    # Remove the log of division error
                    if 'nan' in line:
                        continue
                    if 'Saving weights to' in line:
                        next_skip = True
                        continue
                    if key_word in line:
                        train_log.write(line)
        f.close()
        train_log.close()

    def parse_loss_log(self,log_path, line_num=2000):
        result = pd.read_csv(log_path, skiprows=[x for x in range(line_num) if ((x % 10 != 9) | (x < 1000))],error_bad_lines=False, names=['loss', 'avg', 'rate', 'seconds', 'images'])
        result['loss'] = result['loss'].str.split(' ').str.get(1)
        result['avg'] = result['avg'].str.split(' ').str.get(1)
        result['rate'] = result['rate'].str.split(' ').str.get(1)
        result['seconds'] = result['seconds'].str.split(' ').str.get(1)
        result['images'] = result['images'].str.split(' ').str.get(1)

        result['loss'] = pd.to_numeric(result['loss'])
        result['avg'] = pd.to_numeric(result['avg'])
        result['rate'] = pd.to_numeric(result['rate'])
        result['seconds'] = pd.to_numeric(result['seconds'])
        result['images'] = pd.to_numeric(result['images'])
        return result

    def gene_loss_pic(self, pd_loss):
        fig = plt.figure()
        ax = fig.add_subplot(1, 1, 1)
        ax.plot(pd_loss['avg'].values, label='avg_loss')
        ax.legend(loc='best')
        ax.set_title('The loss curves')
        ax.set_xlabel('batches')
        fig.savefig(self.result_dir + '/avg_loss')
        logger.info('save iou loss done')

    def loss_pic(self):
        train_log_loss_path = os.path.join(self.result_dir, 'train_log_loss.txt')
        self.extract_log(train_log_loss_path, 'images')
        pd_loss = self.parse_loss_log(train_log_loss_path)
        self.gene_loss_pic(pd_loss)


    def parse_iou_log(self,log_path, line_num=2000):
        result = pd.read_csv(log_path, skiprows=[x for x in range(line_num) if (x % 10 == 0 or x % 10 == 9)],error_bad_lines=False,names=['Region Avg IOU', 'Class', 'Obj', 'No Obj', 'Avg Recall', 'count'])
        result['Region Avg IOU'] = result['Region Avg IOU'].str.split(': ').str.get(1)
        result['Class'] = result['Class'].str.split(': ').str.get(1)
        result['Obj'] = result['Obj'].str.split(': ').str.get(1)
        result['No Obj'] = result['No Obj'].str.split(': ').str.get(1)
        result['Avg Recall'] = result['Avg Recall'].str.split(': ').str.get(1)
        result['count'] = result['count'].str.split(': ').str.get(1)

        result['Region Avg IOU'] = pd.to_numeric(result['Region Avg IOU'])
        result['Class'] = pd.to_numeric(result['Class'])
        result['Obj'] = pd.to_numeric(result['Obj'])
        result['No Obj'] = pd.to_numeric(result['No Obj'])
        result['Avg Recall'] = pd.to_numeric(result['Avg Recall'])
        result['count'] = pd.to_numeric(result['count'])
        return result

    def gene_iou_pic(self, pd_loss):
        fig = plt.figure()
        ax = fig.add_subplot(1, 1, 1)
        ax.plot(pd_loss['Region Avg IOU'].values, label='Region Avg IOU')
        # ax.plot(result['Class'].values,label='Class')
        # ax.plot(result['Obj'].values,label='Obj')
        # ax.plot(result['No Obj'].values,label='No Obj')
        # ax.plot(result['Avg Recall'].values,label='Avg Recall')
        # ax.plot(result['count'].values,label='count')
        ax.legend(loc='best')
        ax.set_title('The Region Avg IOU curves')
        ax.set_xlabel('batches')
        fig.savefig(self.result_dir + '/region_avg_iou')
        logger.info('save iou pic done')

    def iou_pic(self):
        train_log_loss_path = os.path.join(self.result_dir, 'train_log_iou.txt')
        self.extract_log(train_log_loss_path, 'IOU')
        pd_loss = self.parse_iou_log(train_log_loss_path)
        self.gene_iou_pic(pd_loss)


if __name__ == '__main__':
    log_path = '/path/to/log/file' # The model training output log can be obtained by redirecting after the training command
    result_dir = '/path/to/save/result' # Folder where the analysis result file is output
    logVis = Yolov3LogVisualization(log_path,result_dir)
    logVis.loss_pic()
    logVis.iou_pic()