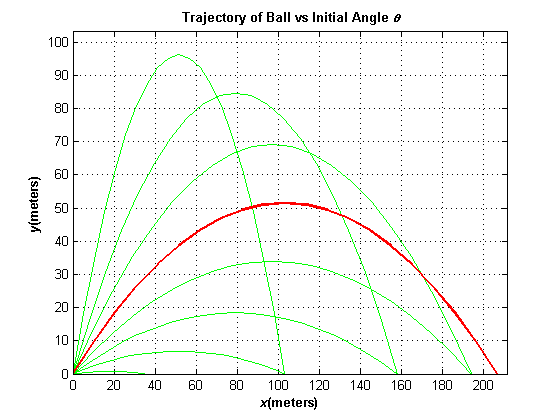
Now that I have learned grammar and drawing functions, I will do a comprehensive exercise today.
Preparatory knowledge: Physical knowledge of high school ball throwing
The code is as follows:
%Purpose:
%This program calculates the distance traveled by a ball throw at a
%specified angle "theta" and a spedified velocity "vo" from a
%point,ignoring air friction.It calculates the angle yielding maximum
%range,and also plots selected trajectories.
%
%Define variable:
%conv           Degrees to adians conv factor
%grav           The gravity acceleration
%ii,jj          Loop index
%index          The maximum range in array
%maxangle       The angle that gives the maximum range
%maxrange       Maximum range
%time           Time
%theta          Initial angle
%fly_time       The total trajectory time
%vo             The initial velocity
%vxo            x-component of the initial velocity
%vyo            y-component of the initial velocity
%x              x position of ball
%y              y position of ball
%Define Constant Value
conv=pi/180;
grav=-9.82;
vo=input('Enter the initial velocity:');
range=zeros(1,91);
%Calculate maximum horizontal distance
for ii = 1:91
    theta = ii -1;
    vxo = vo * cos(theta * conv);
    vyo = vo * sin(theta * conv);
    max_time = -2 * vyo/grav;
    range(ii) = vxo * max_time;
end
%Show a list of calculated horizontal distances
fprintf('Angle versus Range\n');
for ii = 1:5:91
    theta = ii-1;
    fprintf('%2d\t\t%8.4f\n',theta,range(ii));
end
%Calculate maximum angle and horizontal distance
[maxrange,index]=max(range);
maxangle = index -1;
fprintf('\n Max range is %8.4f at %2d degrees.\n',maxrange,maxangle);
%Draw Track Graphics
for ii = 5:10:80
    theta =ii;
    vxo = vo*cos(theta*conv);
    vyo = vo*sin(theta*conv);
    max_time = -2 * vyo/grav;
    %Calculating the trajectory of a sphere x,y Coordinate Value
    x=zeros(1,21);
    y=zeros(1,21);
    for jj=1:21
        time = (jj-1) * max_time/20;
        x(jj) = vxo * time;
        y(jj) = vyo * time + 0.5 * grav * time^2;
    end
    plot(x,y,'g');
    if ii == 5
        hold on;
    end
end
%Add the title of the graphic and the name of the coordinate axis
title('\bf Trajectory of Ball vs Initial Angle \it\theta');
xlabel('\bf\itx\rm\bf(meters)');
ylabel('\bf\ity\rm\bf(meters)');
axis([0,max(range)+5,0,-vo^2/2/grav]);
grid on;
%Draw the maximum horizontal trajectory graph
vxo = vo * cos(maxangle * conv);
vyo = vo * sin(maxangle * conv);
max_time = -2 * vyo/grav;
%Calculation ( x,y)spot
x = zeros(1,21);
y = zeros(1,21);
for jj = 1:21
    time = (jj -1)*max_time/20;
    x(jj) = vxo * time;
    y(jj) =vyo * time + 0.5 * grav * time ^ 2;
end
plot(x,y,'r','Linewidth',2);
hold off;
Save the above code as ball.m. Enter the ball in the command window of matlab and return.Enter a different initial speed.The operation is as follows:
>> ball
Enter the initial velocity:45
Angle versus Range
 0        0.0000
 5       35.8083
10       70.5286
15      103.1059
20      132.5504
25      157.9674
30      178.5847
35      193.7757
40      203.0790
45      206.2118
50      203.0790
55      193.7757
60      178.5847
65      157.9674
70      132.5504
75      103.1059
80       70.5286
85       35.8083
90        0.0000

 Max range is 206.2118 at 45 degrees.
The parabola is as follows:

Parabola with Vo 45 m/s.png
Here's a little explanation of some of the code in ball.m:
- zeros(1,91) generates a zero matrix of 1*91
- xlabel('\bf\itx\rm\bf(meters)')
- \bf denotes that the trailing character is in bold
- \it means the trailing character is italic
- \rm Restores normal fonts
- \theta Reference Advanced control of text strings
- hold off makes it easy to erase the previous figure the next time you call ball.m
Practice:
1. Draw parabola at each angle in a different color and label it with a legend function
2. Draw images with the same projection angle and different initial velocities